


September 22, 2026
|
Lesedauer: 5 Minuten


Erhalten Sie sofortigen Zugriff auf eine TrueFoundry-Live-Umgebung. Stellen Sie Modelle bereit, leiten Sie den LLM-Verkehr weiter und erkunden Sie die gesamte Plattform — Ihre Sandbox ist in Sekundenschnelle einsatzbereit, ohne dass eine Kreditkarte erforderlich ist.



Published: September 22, 2026
.png)
Unglaublich schnelle Methode zum Erstellen, Verfolgen und Bereitstellen Ihrer Modelle!
A payments API is easy to observe because it is boring. The same input produces the same code path, so three numbers — request rate, error rate, duration — tell you nearly everything. When one goes bad you read a stack trace, and a stack trace is a fact about the program, not a guess at intent.
An agent breaks every assumption in that sentence. The model chooses the path at runtime, so the same input does not produce the same code path. Often there is no error at all: the agent finishes, returns text, and every HTTP call it made returned 200. And what went wrong is usually not a crash but a decision — it picked the wrong tool, re-read a file it already had, kept retrying a search that could never work.
So the question shifts: not was it up, but why did it do that. And “why” is a property of the whole sequence, not of any single request — which is why a dashboard can look healthy while your agent fails. P99 latency of 900 ms across every model call tells you nothing about a run that made 140 of them.
The data has four nested levels, only the bottom two of which look like a conventional request.
The middle two levels hold the value, and are exactly the two a request-scoped tracer does not model. It sees a scatter of outbound calls with no meaningful parent, and cannot tell you that calls 11 through 27 were one turn trying the same thing seven times.
One property makes this genuinely different from distributed tracing: any level can loop. There is no equivalent in a normal service graph — A calls B calls C, and if A ever calls itself you have a bug. In an agent, a step that decides to call itself again is the normal case, and the only way to tell a productive loop from a stuck one is to read the sequence.
Each level needs its own signals. Collecting everything everywhere produces data without insight, so this is the minimum that earns its keep.
The last cell is the highest-yield signal in agent observability, and almost nobody records it: the same tool called twice with the same arguments inside one turn is a loop. Trivial once arguments are on the span. Impossible from aggregate metrics.
Three shapes cover almost every production incident.
1. The silent retry loop. An agent searches a knowledge base, gets nothing useful, rephrases, searches again — twenty times. Every search returns 200 in 300 ms, so request-rate and error-rate dashboards show a small traffic bump and nothing else. At session level it is unmissable: turn count of one, tool-call count of twenty, duration of two minutes. The diagnosis is not in any single span; it is in the repetition.
2. The tool that succeeds while returning garbage. A document-fetch tool hits a permissions wall and returns a polite 200 whose body is an HTML login page. The model reads it and reports that no such policy exists. Zero errors anywhere. The only way to catch this is to capture the raw result — which is why result capture, not just status codes, is table stakes.
3. The 40x run. Median session cost is $0.04; one session cost $1.60, and nothing failed. A single step re-read a large file into context, that file rode along in every subsequent turn, and input tokens compounded for the rest of the run. You find it by sorting sessions by cost and reading the outlier’s per-turn token counts until you see the step change. Never in an average.
The pattern across all three: the anomaly is a relationship between steps. A tool that stores steps independently has thrown away the thing you need.
This is capturable without instrumenting your agent code because enforcement and observation happen in one place. Every model and tool call goes through a gateway, so the trajectory is recorded as a side effect of serving it — nothing reconstructed from scattered logs, and no opting out.
For agents on the TrueFoundry agent harness, Sessions lists every conversation across every agent — opening message, agent, turn count, cost, duration. Enough to scan for expensive or overlong runs without opening anything, which is exactly what failure mode 3 needs.
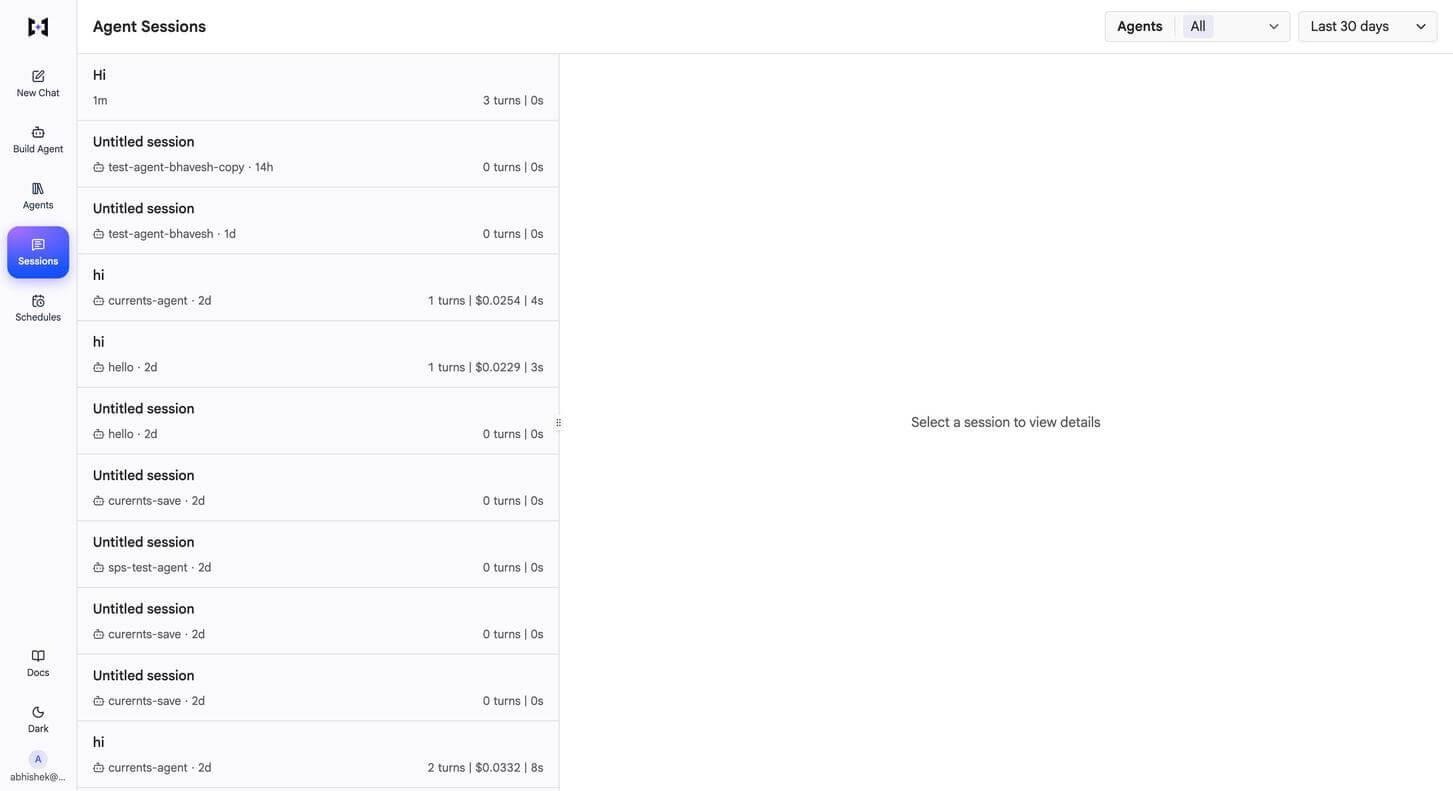
Opening a session gives all three things the hierarchy asks for. Aggregate metrics cover turns, duration, cost, tokens, context, tool calls, sub-agents and errors. An event-type timeline breaks the run into system, user, model and tool-call segments per turn — a turn dominated by tool-call colour is tool-bound, one dominated by model colour is model-bound, visible at a glance instead of computed. Below it sits the transcript, with per-turn tokens, duration and cost, and an expandable agent steps panel listing tool calls in order with outcomes.
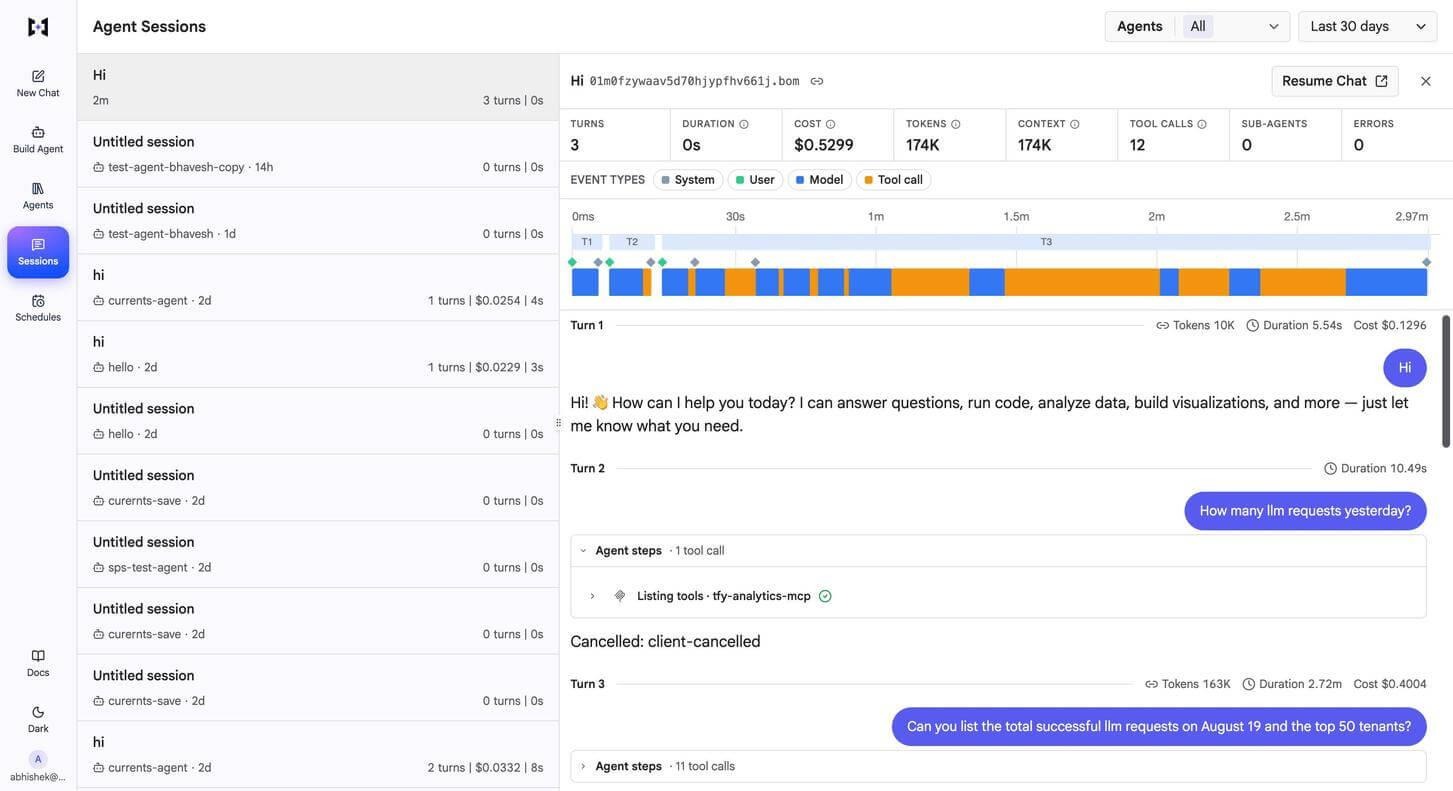
That ordered step list is where a cancelled turn, a failing MCP server or an empty tool result becomes visible. A session can be resumed as a live chat from the same view — how you confirm a fix.
One level down, a trace is a real span hierarchy, not a flat log. A single chat completion with a PII guardrail attached produces five spans: a ChatCompletion root with no parent, a Guardrail span beneath it, the guardrail’s outbound call beneath that, a Model span, and the model’s outbound call beneath that.

Chat completion trace showing a five-span hierarchy including guardrail processing
Span attributes make cost and latency attributable rather than estimated. The root span carries tfy.model.metric.cost_in_usd, input_tokens, output_tokens, latency_in_ms, time_to_first_token_in_ms and inter_token_latency_in_ms, alongside tfy.input, tfy.output and tfy.triggered_guardrail_fqns, and every span records the subject that created it. Spans are queryable: client.traces.query_spans(...) with a trace_ids filter and a time window returns the whole hierarchy, paginated — how you get from “this session was expensive” to “this span was expensive”.
Guardrail execution appears as its own span with result, latency and findings, and blocked requests are traced too — a denied call is evidence, not a gap.
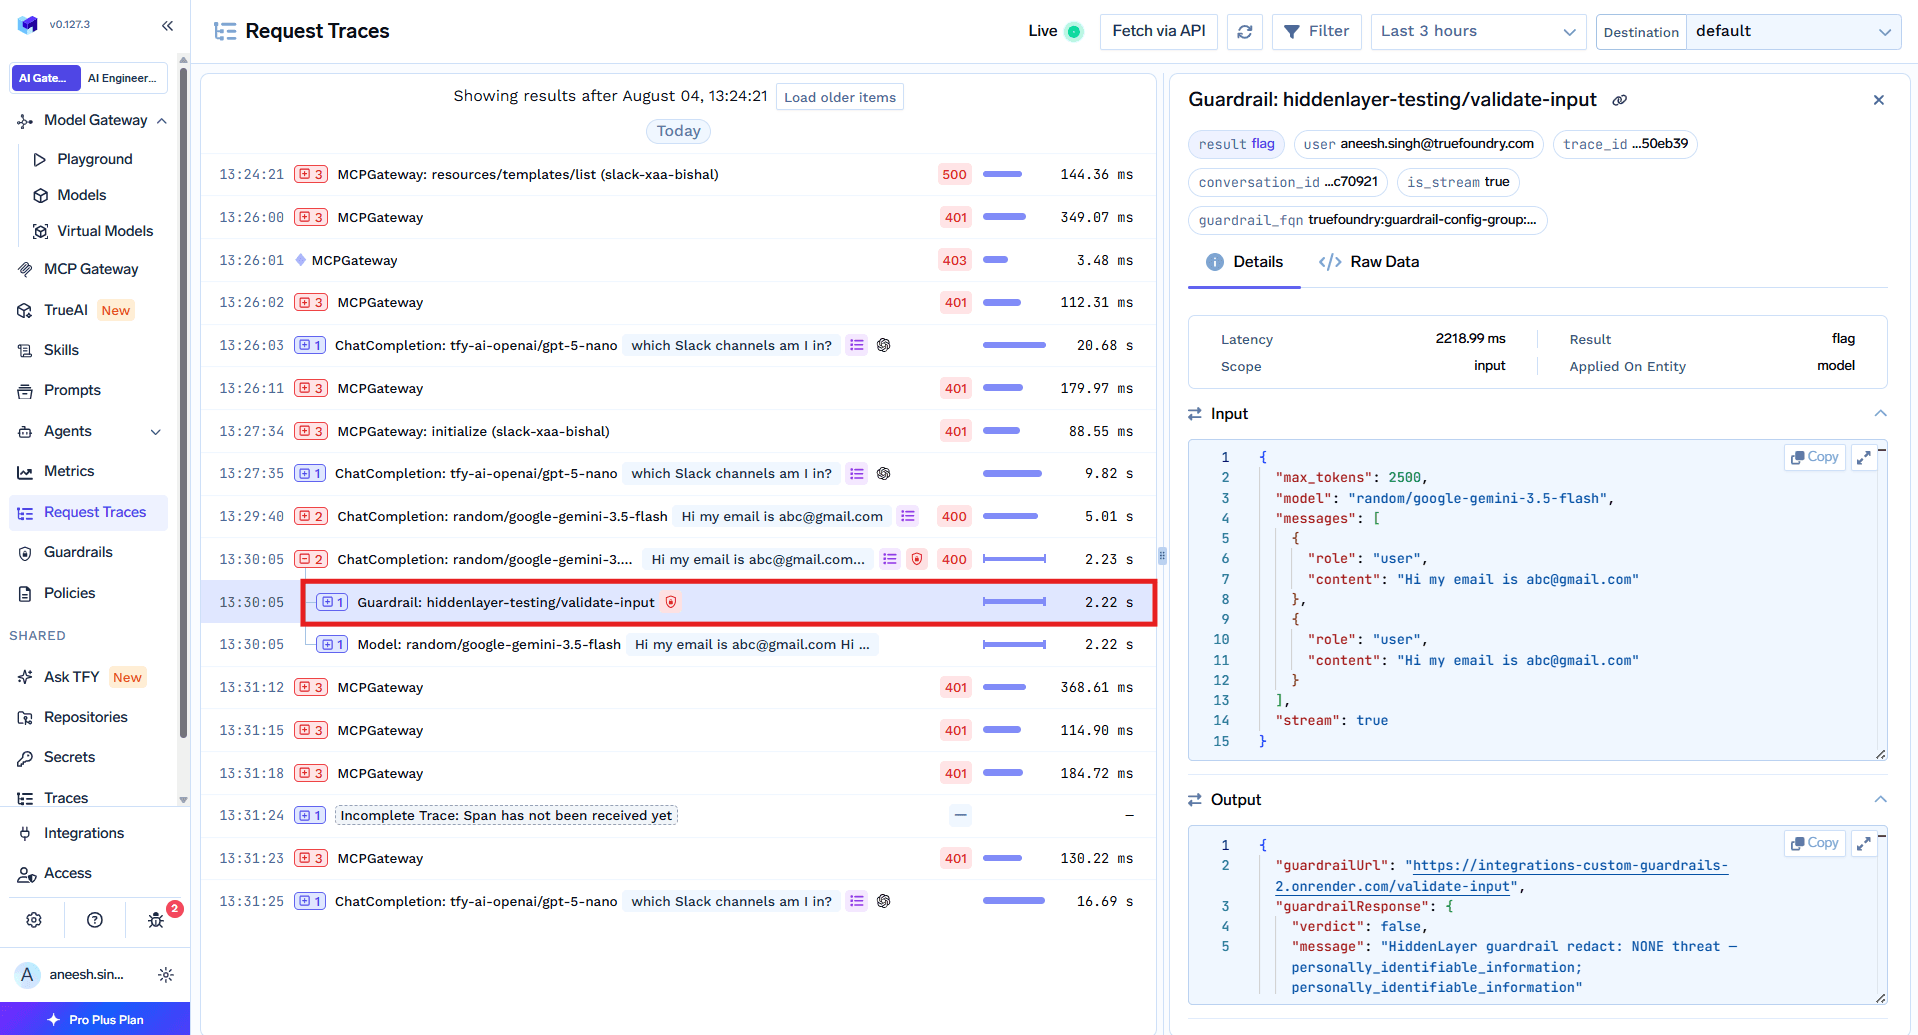
Request Traces with a guardrail span selected, showing latency, result and findings
Aggregates live in the Metrics Dashboard. Model Metrics carries input and output tokens, request count and total cost, plus throughput, failure rate and failure breakdown by error type. Latency comes at P50, P75, P90 and P99 across four measures — end-to-end latency, time to first token, inter-token latency, time per output token — which matters because a slow first token and a slow token stream have different causes.
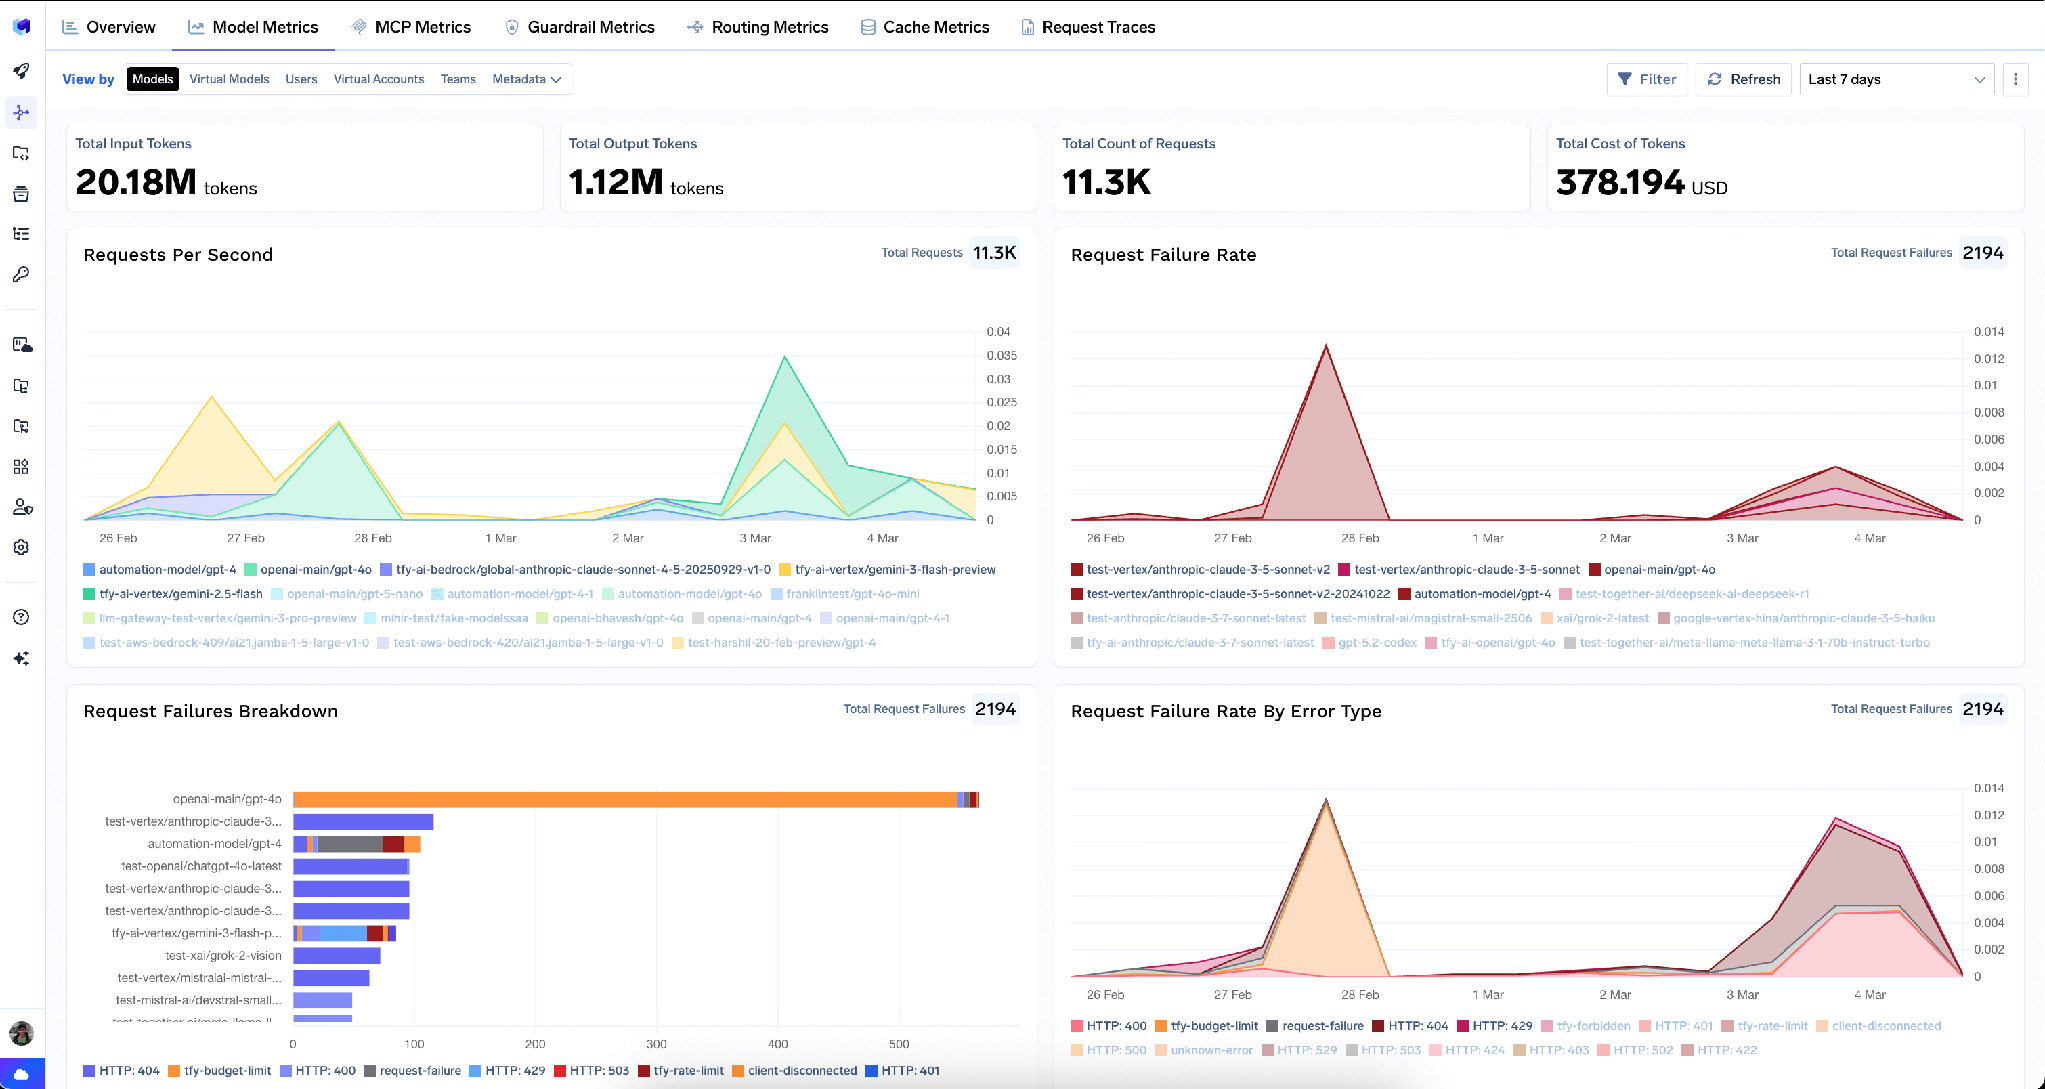
Model Metrics tab with requests per second, failure rates, latency percentiles and token cost charts
Every chart pivots through a View by selector — models, virtual models, users, virtual accounts, teams, or custom metadata keys sent as request headers. Plan for metadata early: send an agent name or run ID and you get per-agent cost and latency views without building anything.
Tool calls get the same treatment through MCP metrics — the half most LLM-centric setups skip. The servers view gives per-server throughput, latency percentiles, failure rate and error breakdown, plus a method calls breakdown across tools/list, tools/call, resources/list and the rest. An agent burning requests on repeated tools/list has a discovery problem, not a task problem.
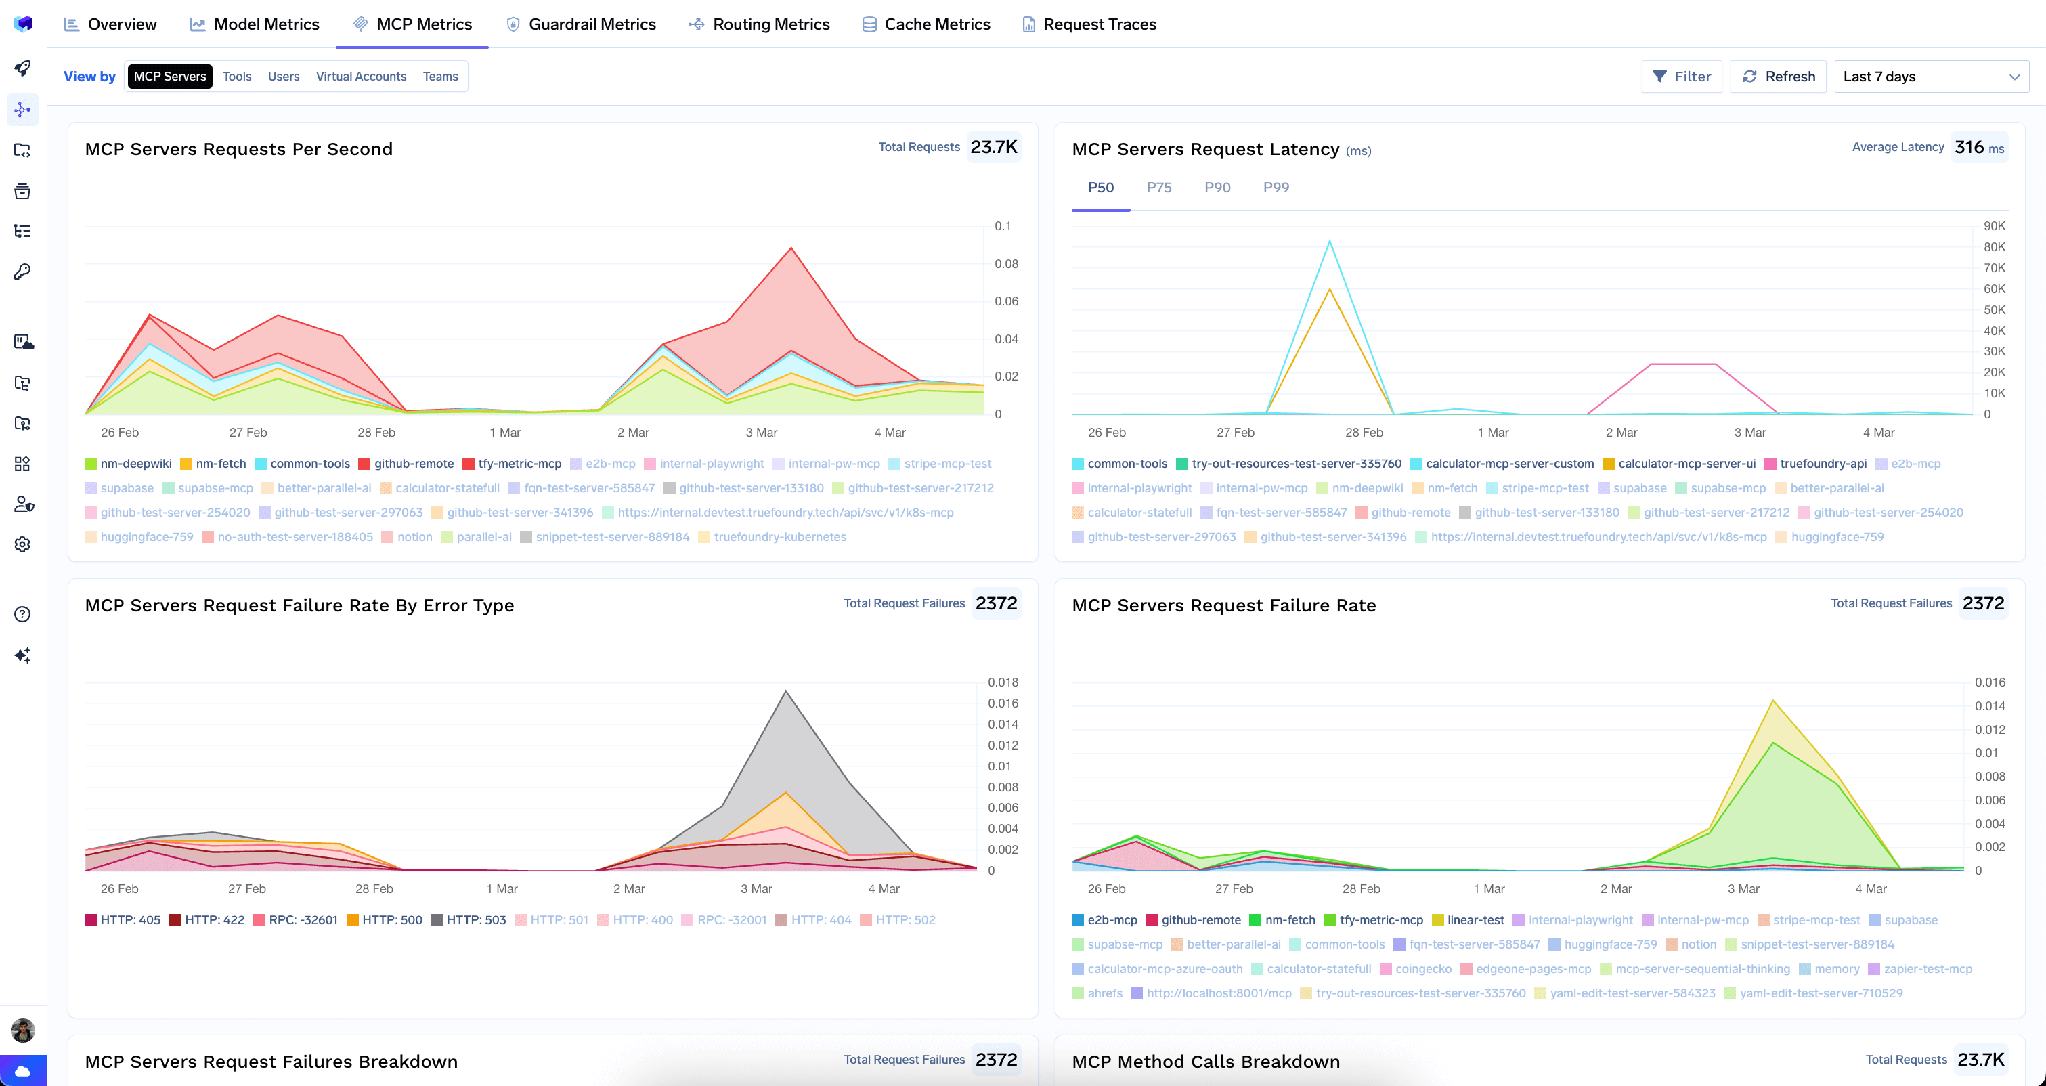
MCP Metrics servers view with per-server request rates, latency and method call breakdown
The Tools view drills into individual tools across all servers: requests per second, latency percentiles, failure rate by error type, a side-by-side latency summary, and tools ranked by request count. That ranking is the fastest way to spot a tool the agent leans on harder than you expected.
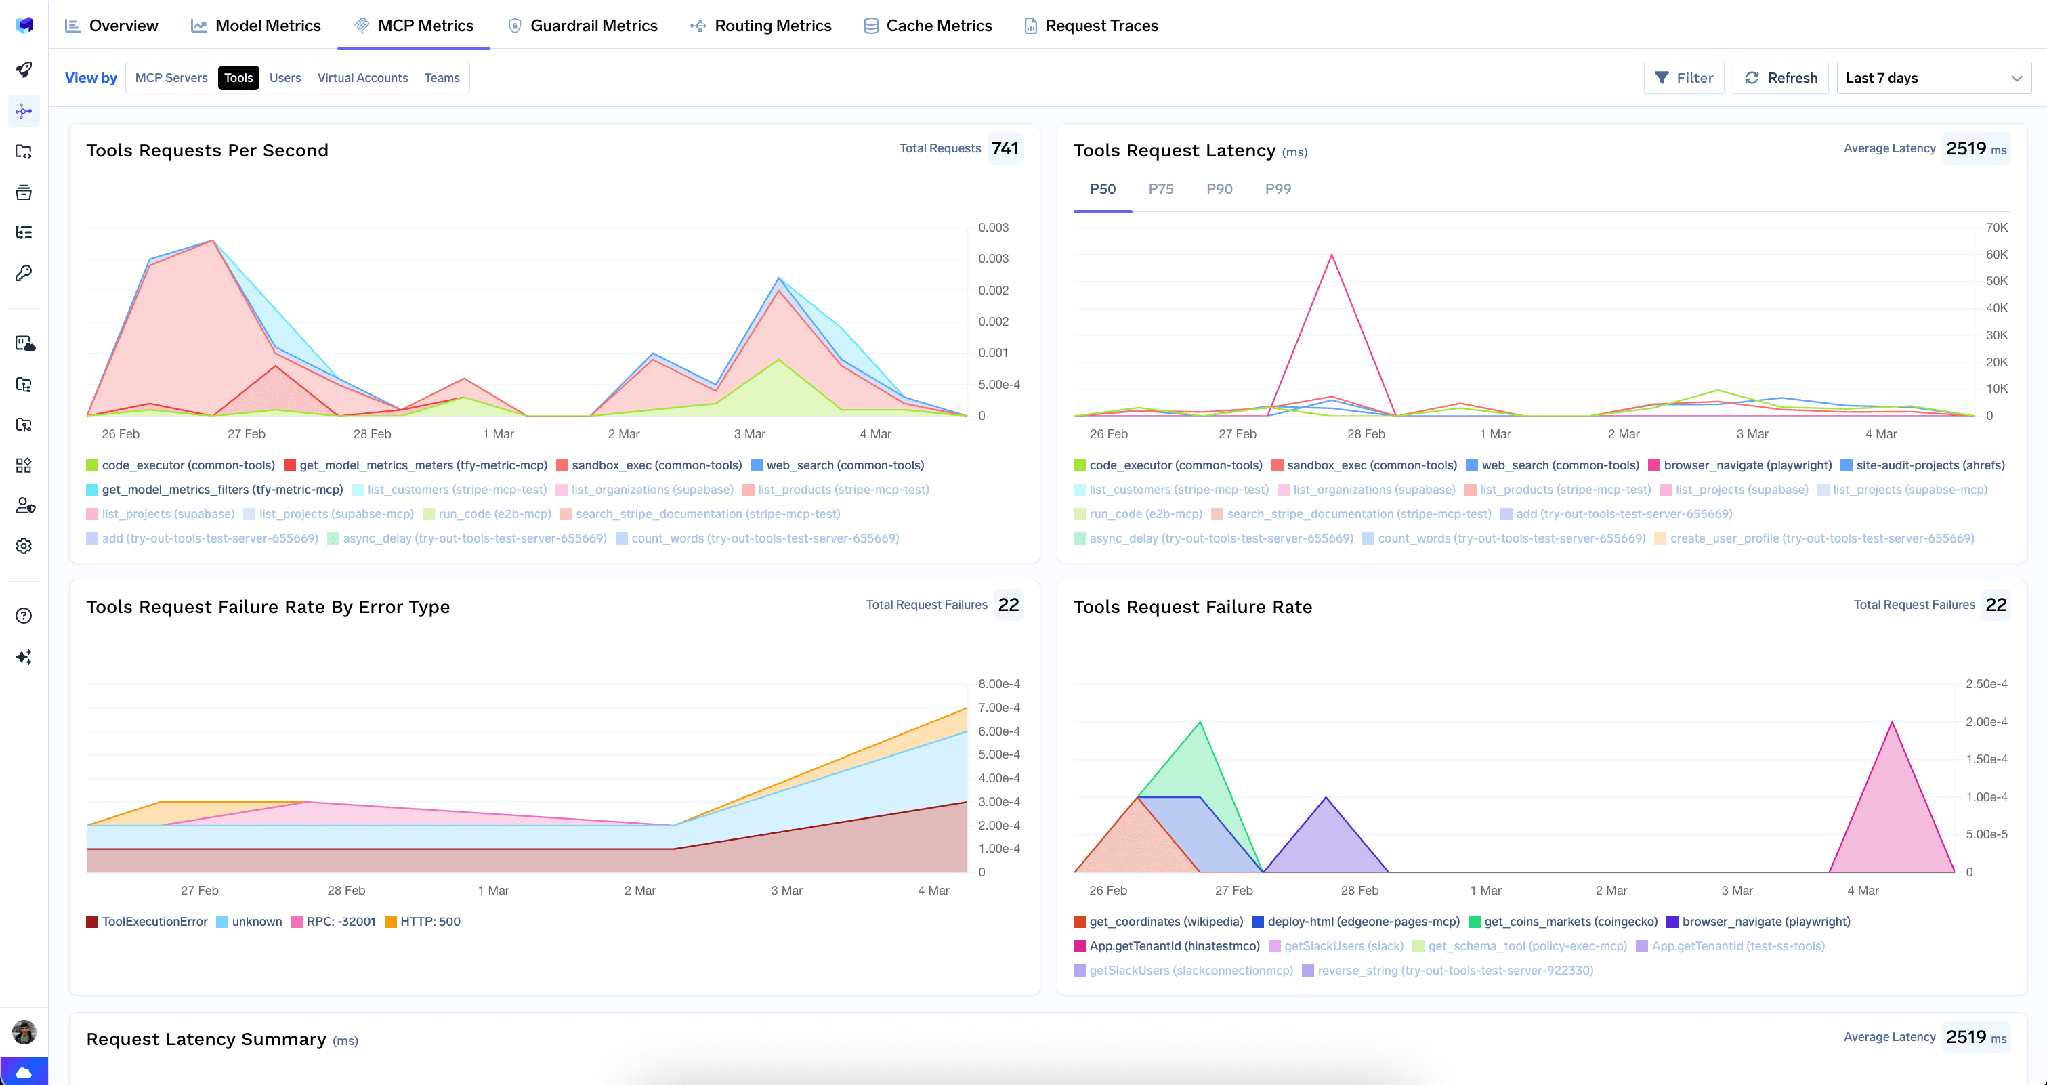
MCP Metrics Tools view with per-tool request rates, latency and failure rates
Filters persist across tabs, so narrowing to one user on the model tab keeps that filter when you switch to MCP — how you tell whether their slow sessions are a model problem or a tool problem without rebuilding the query.
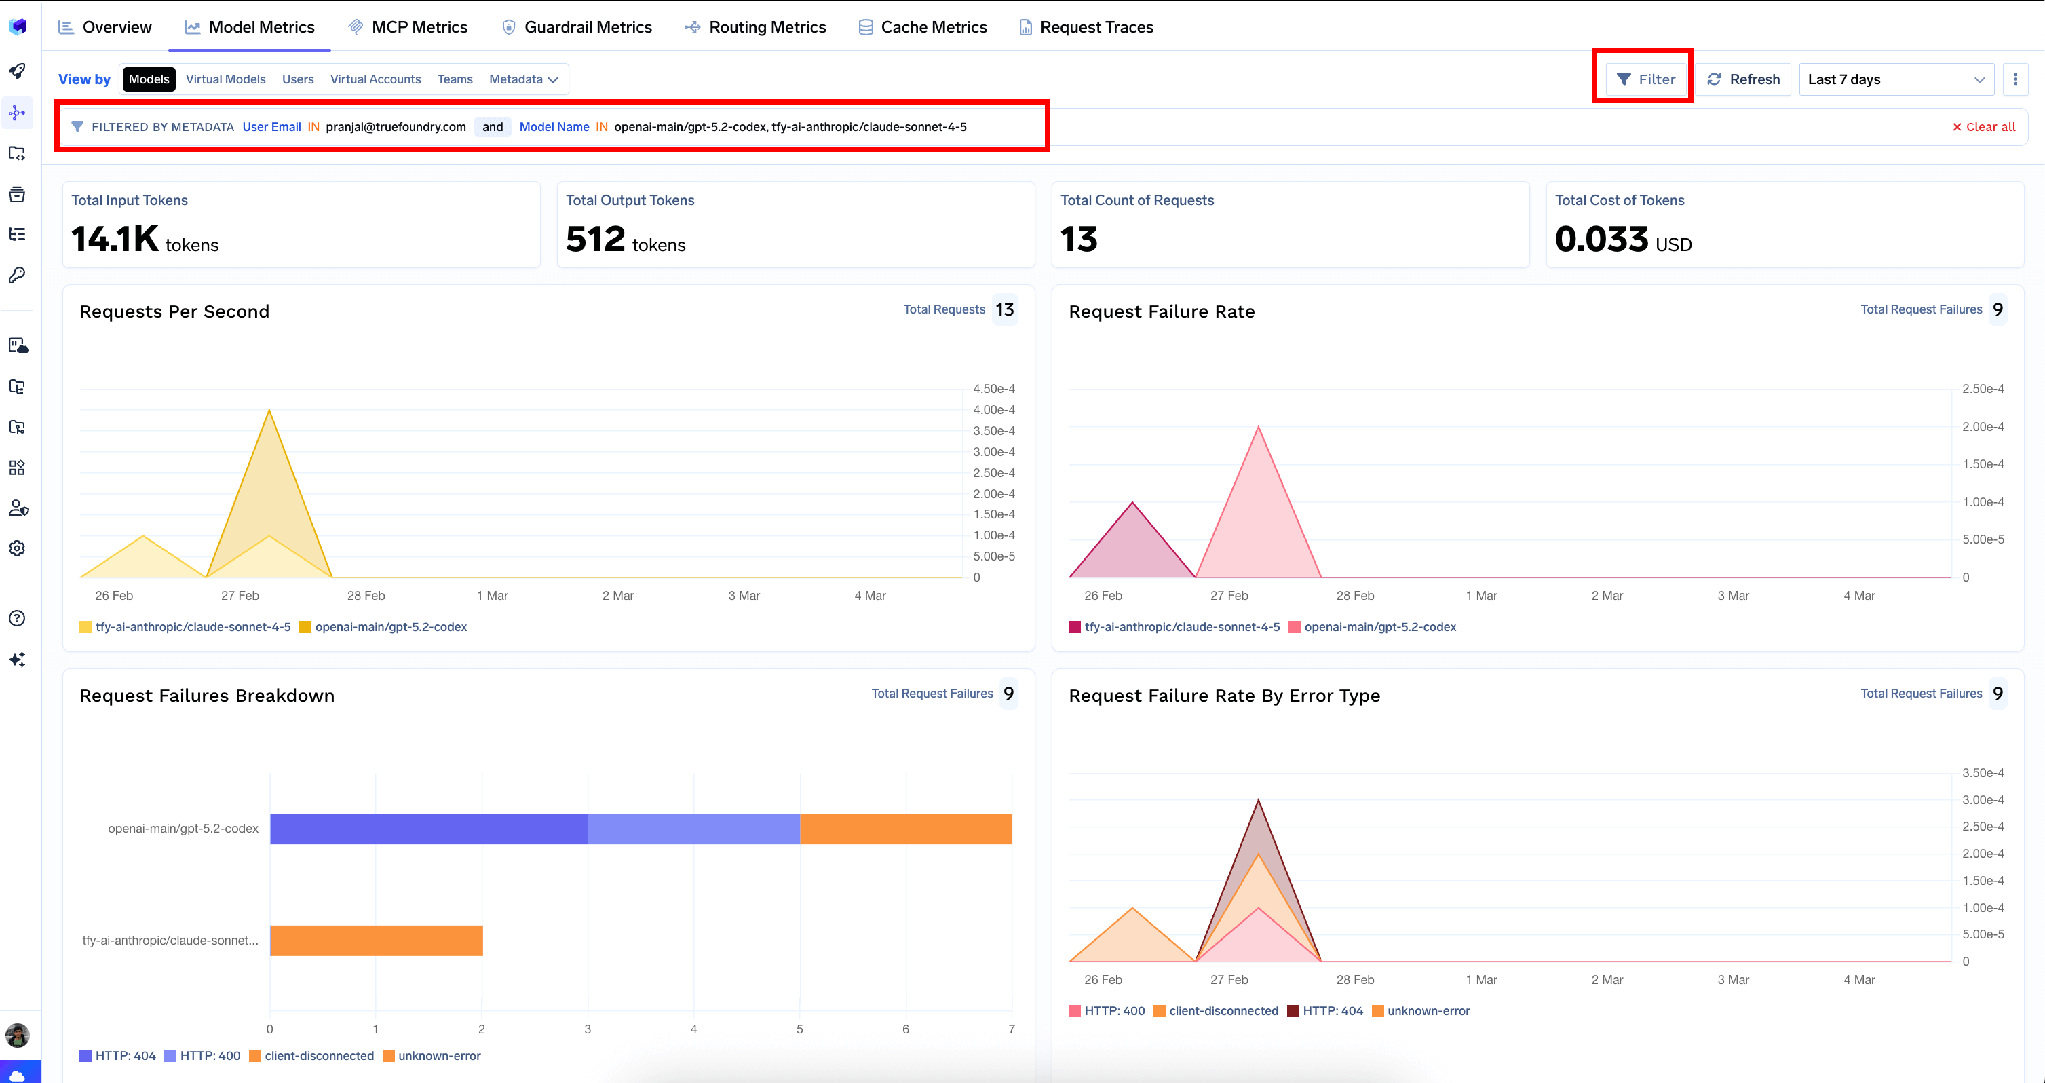
Metrics dashboard filtered to a specific user and model
Registered agents get one dashboard covering request counts, latency percentiles, error rates and usage over time — identical whether the agent runs on Bedrock, LangGraph or a custom service.
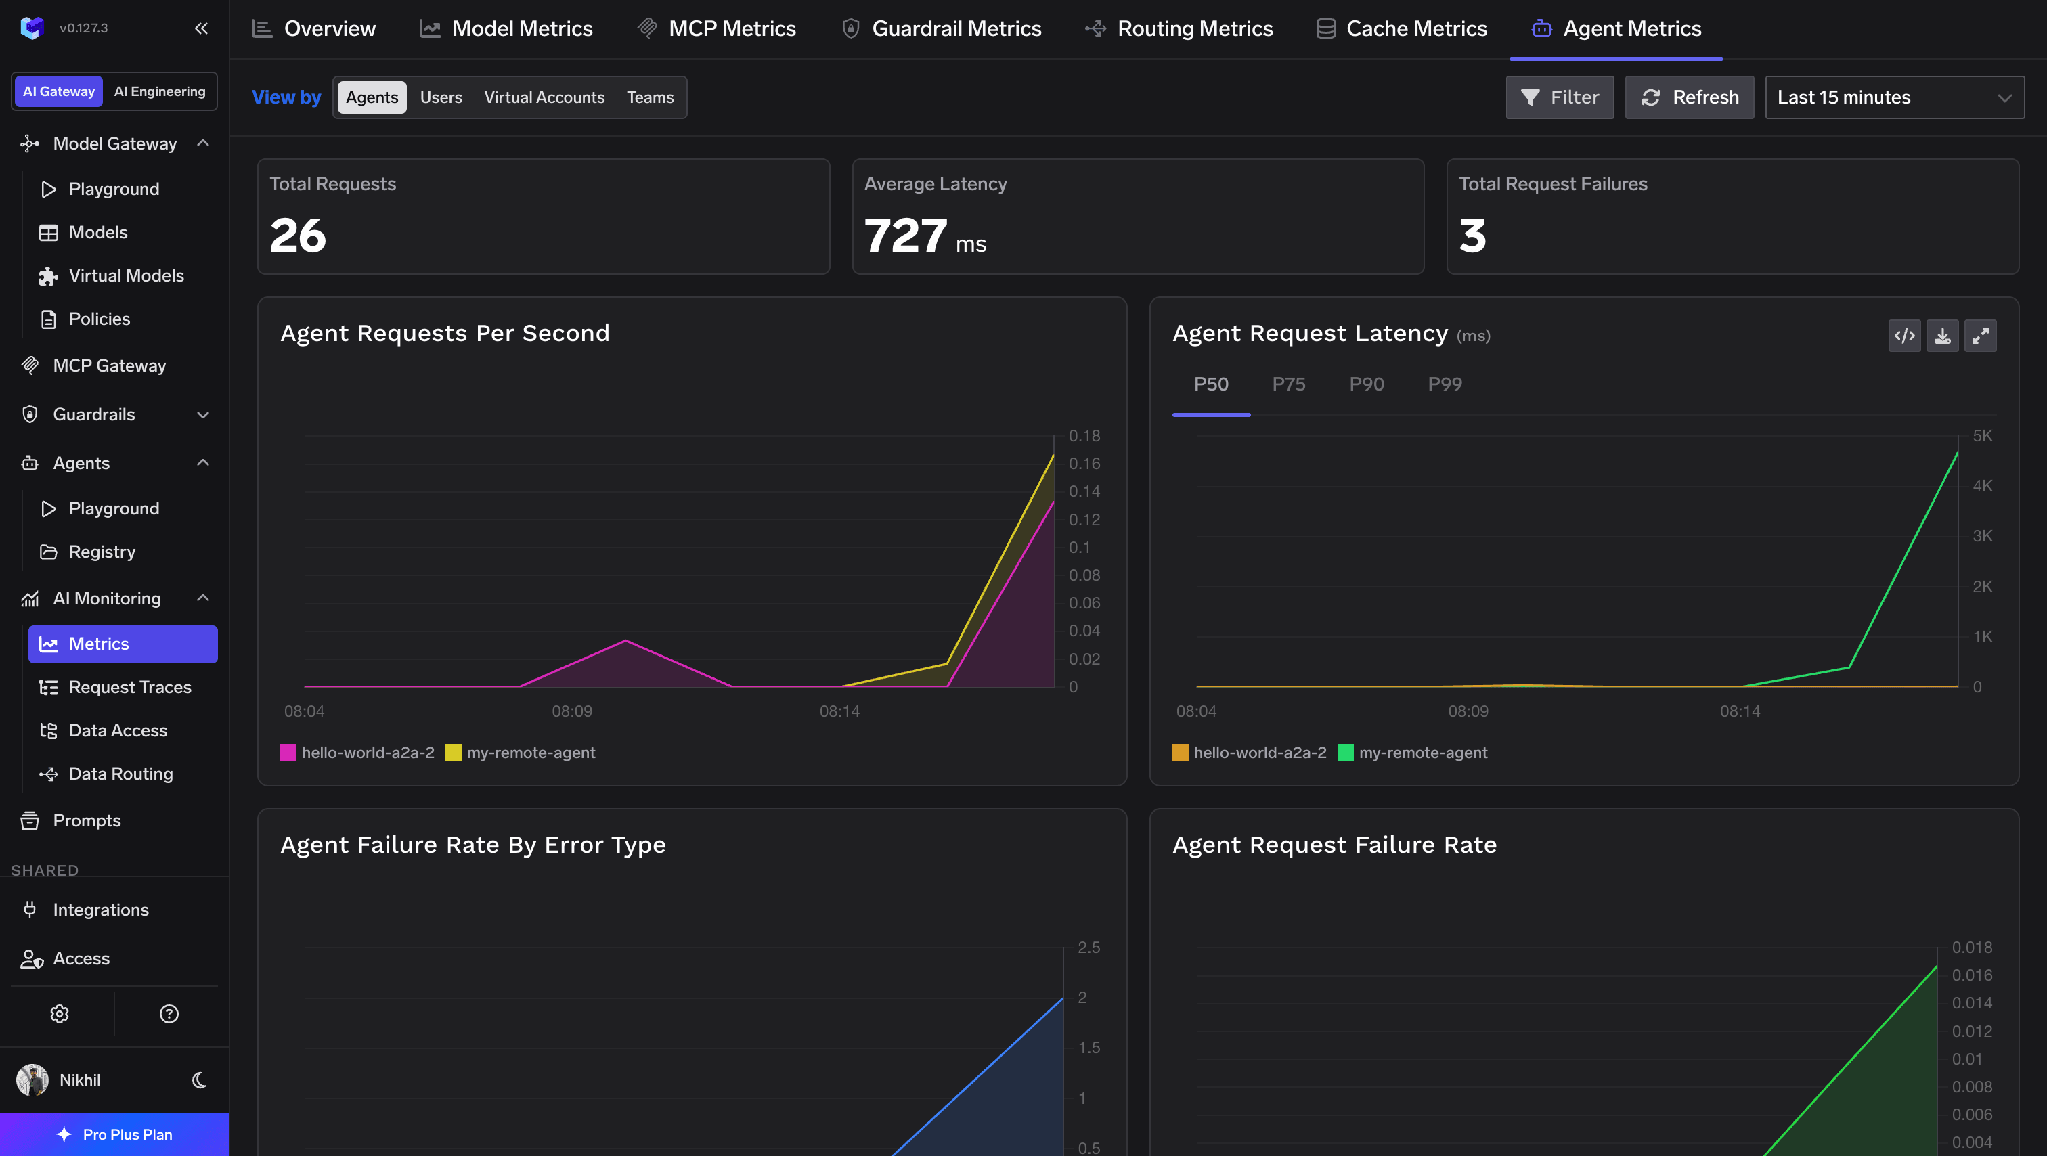
Agent Metrics dashboard with request volume, latency and failure rates per registered agent
The same data is queryable: the metrics API exposes an agentMetrics datasource returning distribution or timeseries results grouped by agentName, agentFramework or agentServerType, with percentile aggregations on latencyMs. In multi-agent systems, Request Traces records which agent made each call and which user it acted for — the attribution that makes a sub-agent’s tool call traceable back to a person.
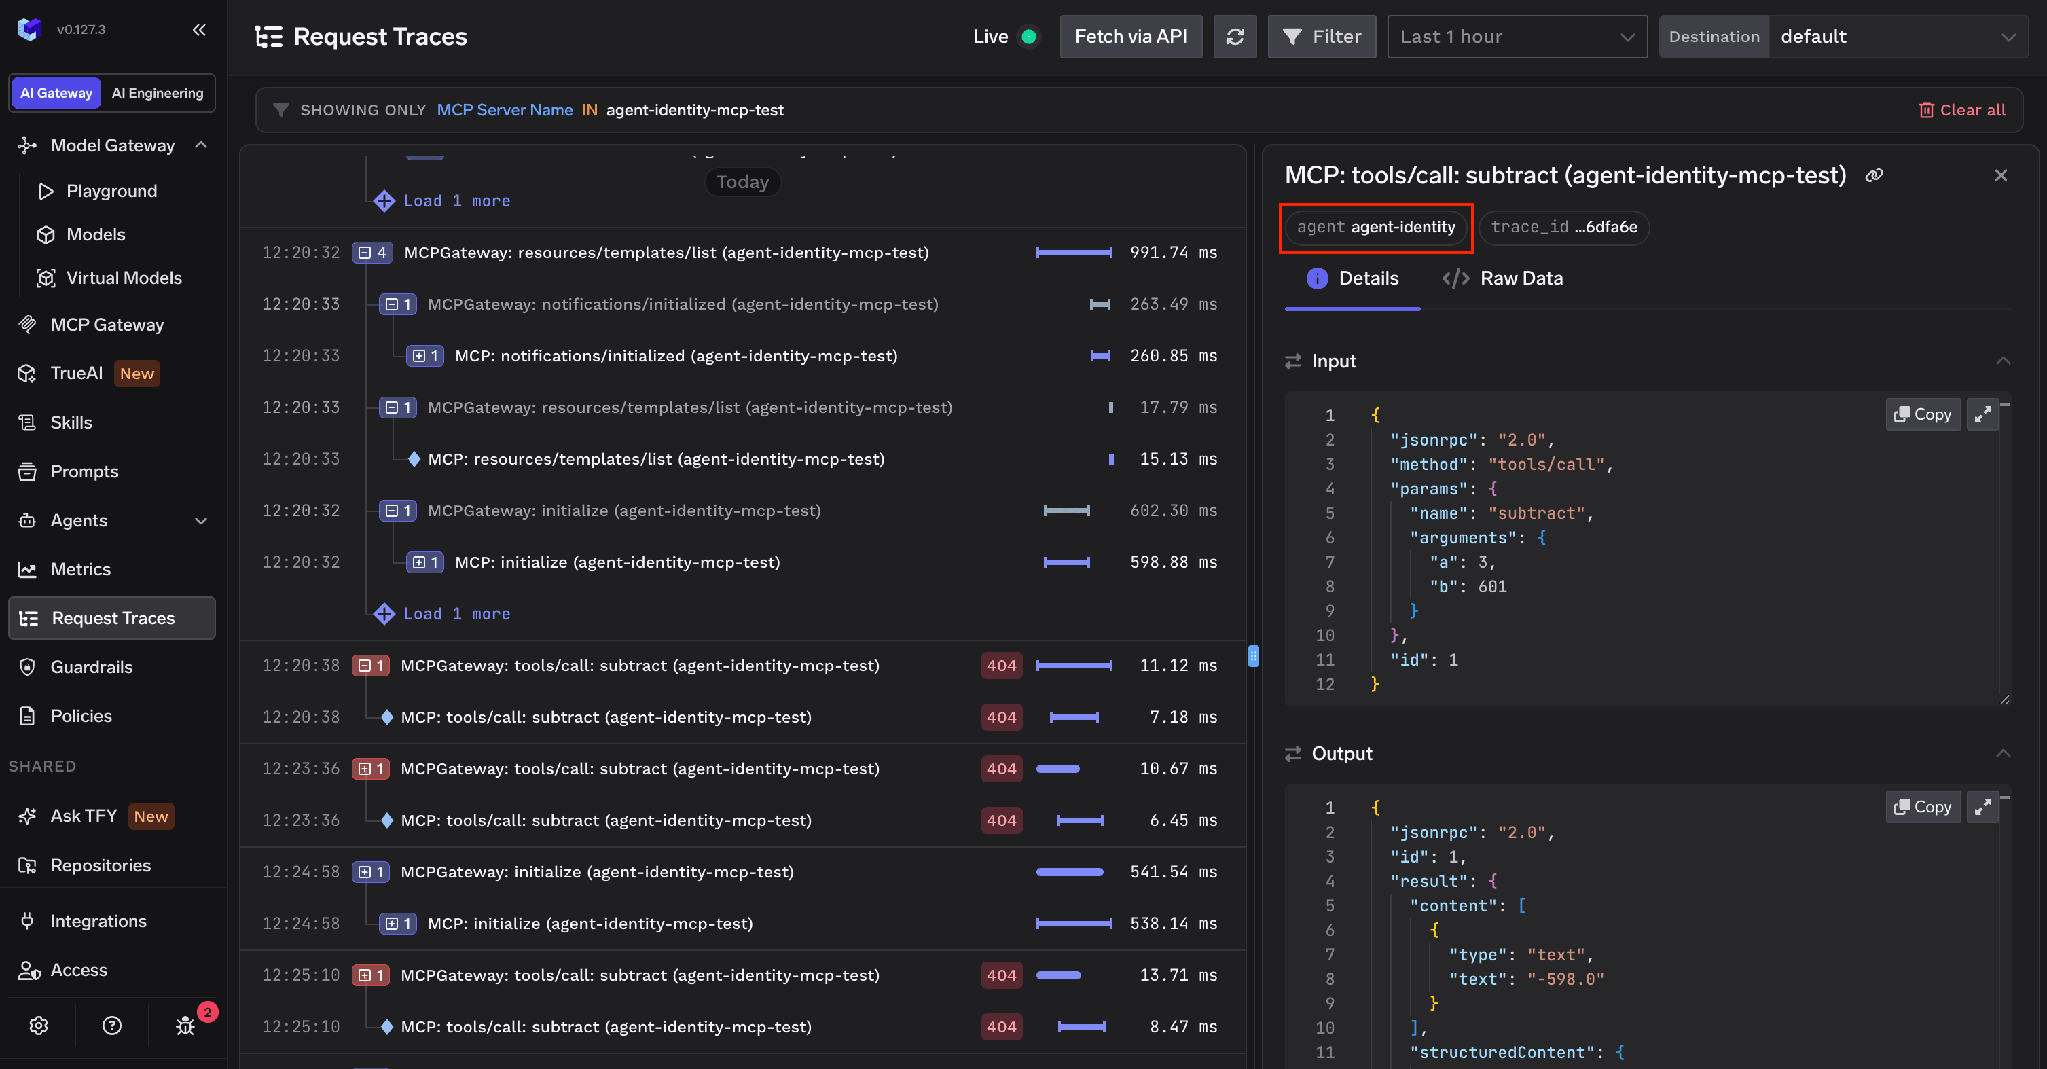
Request Traces for a remote A2A agent showing the JSONRPC request and response
One honest limit: a full actor-chain view stitching user → agent → sub-agent → tool into one rendered trace is coming soon, as are drift detection, anomaly alerts and one-click agent suspend. Today you get per-hop attribution on each trace rather than the chain drawn as one picture.
Latency and cost are measurable; answer quality is not, which is why feedback belongs on the trace rather than in a separate table. Every gateway response returns an x-tfy-feedback-target-id header. Post that to /api/svc/v1/gateway-feedback with a rating from 1 to 5 and an optional comment, and it appears alongside the span and in raw data under tfyGatewayFeedbacks, updatable or deletable by its returned ID. The target ID currently addresses the root span, so feedback lands on the request, not a sub-step.

Feedback shown against a trace span with a star rating
Wire that to a thumbs-up control in your product and outlier sessions get a quality label, turning “this run cost 40x” into “this run cost 40x and the user rated it 2.”
None of this requires moving off the stack you have. The gateway is OpenTelemetry-compliant, and traces and metrics export independently — both configured under AI Gateway → Controls → Settings → OTEL Config, over HTTP or gRPC, with proto or json encoding and arbitrary auth headers. Backends expecting delta-encoded metrics, such as Datadog and CloudWatch, need the Export Delta Metrics toggle plus a temporality environment variable on the gateway deployment. Prometheus can scrape /metrics on self-hosted gateways.

OpenTelemetry trace flow: traces stored by TrueFoundry and exported to an external backend
Export is additive, not a handoff: TrueFoundry keeps storing traces either way, so the in-product session and span views stay available while Grafana or Datadog gets the same data.
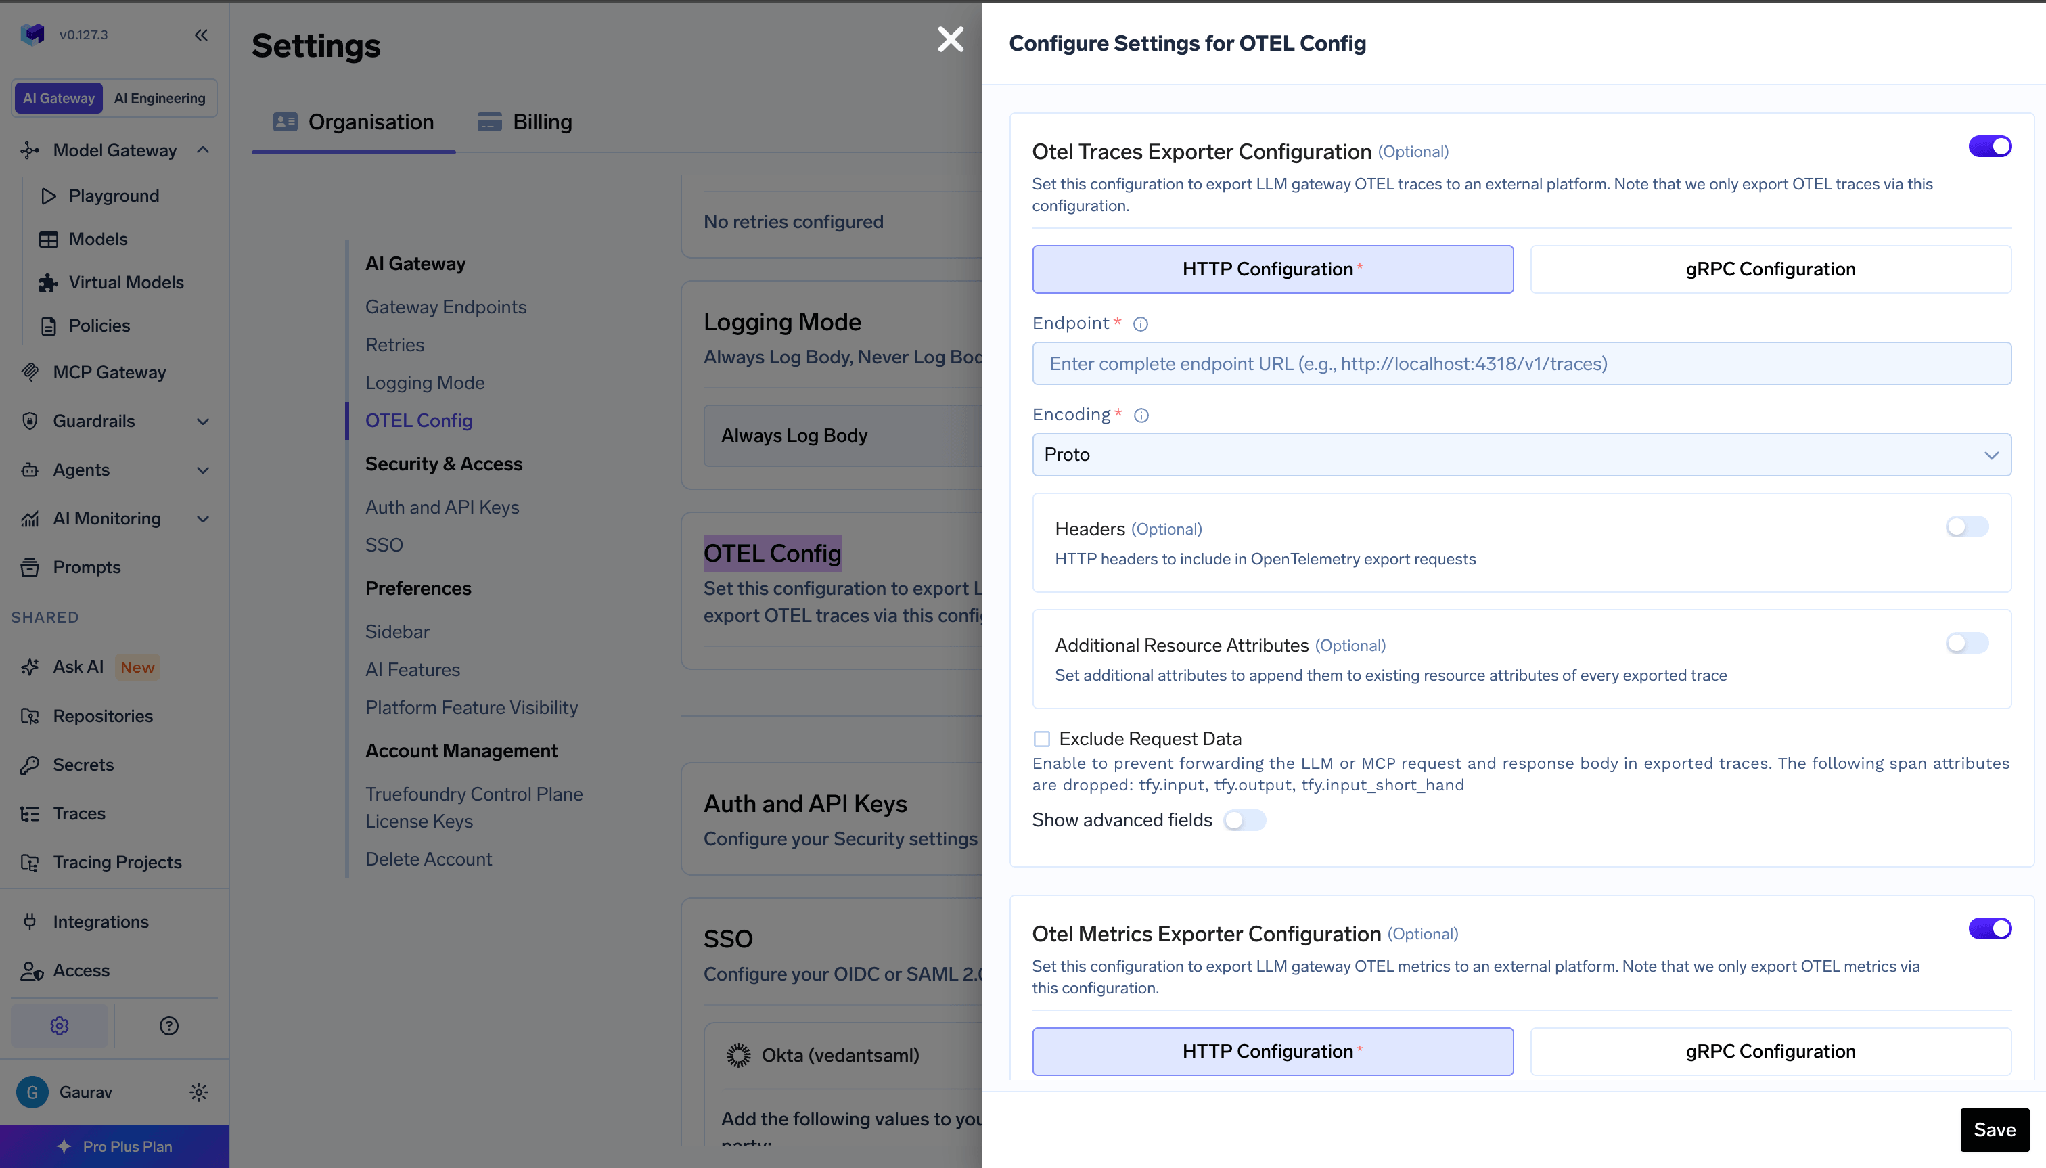
OTEL Config form for exporting spans, with HTTP or gRPC endpoint, encoding and headers
Support copilot, a week in production. Finance asks why the bill tripled.
Start at session level. Sort by cost. Median is a few cents; four sessions are over a dollar, all with single-digit turn counts — so this is not long conversations, it is individual turns doing too much.
Open one and read the timeline. Turn 3 is almost entirely tool-call coloured. Tool calls: 31. Errors: 0. Nothing failed, which is why no alert fired.
Expand agent steps for turn 3. The ordered list shows one document-fetch tool called repeatedly, and per-turn tokens climb sharply from turn 3 onward without coming back down — a large document entered context and stayed.
Confirm at the tool level. In MCP metrics, Tools view, that tool tops the request-count ranking by a wide margin and has the worst p90.
Fix, then verify. Whether the fix is a narrower tool, pagination, or a prompt change telling the agent it already has the file, verification is the same: filter sessions to that agent for the next day and check the cost distribution flattened. If you wired feedback, check whether the outliers were also the badly rated runs — they usually are.
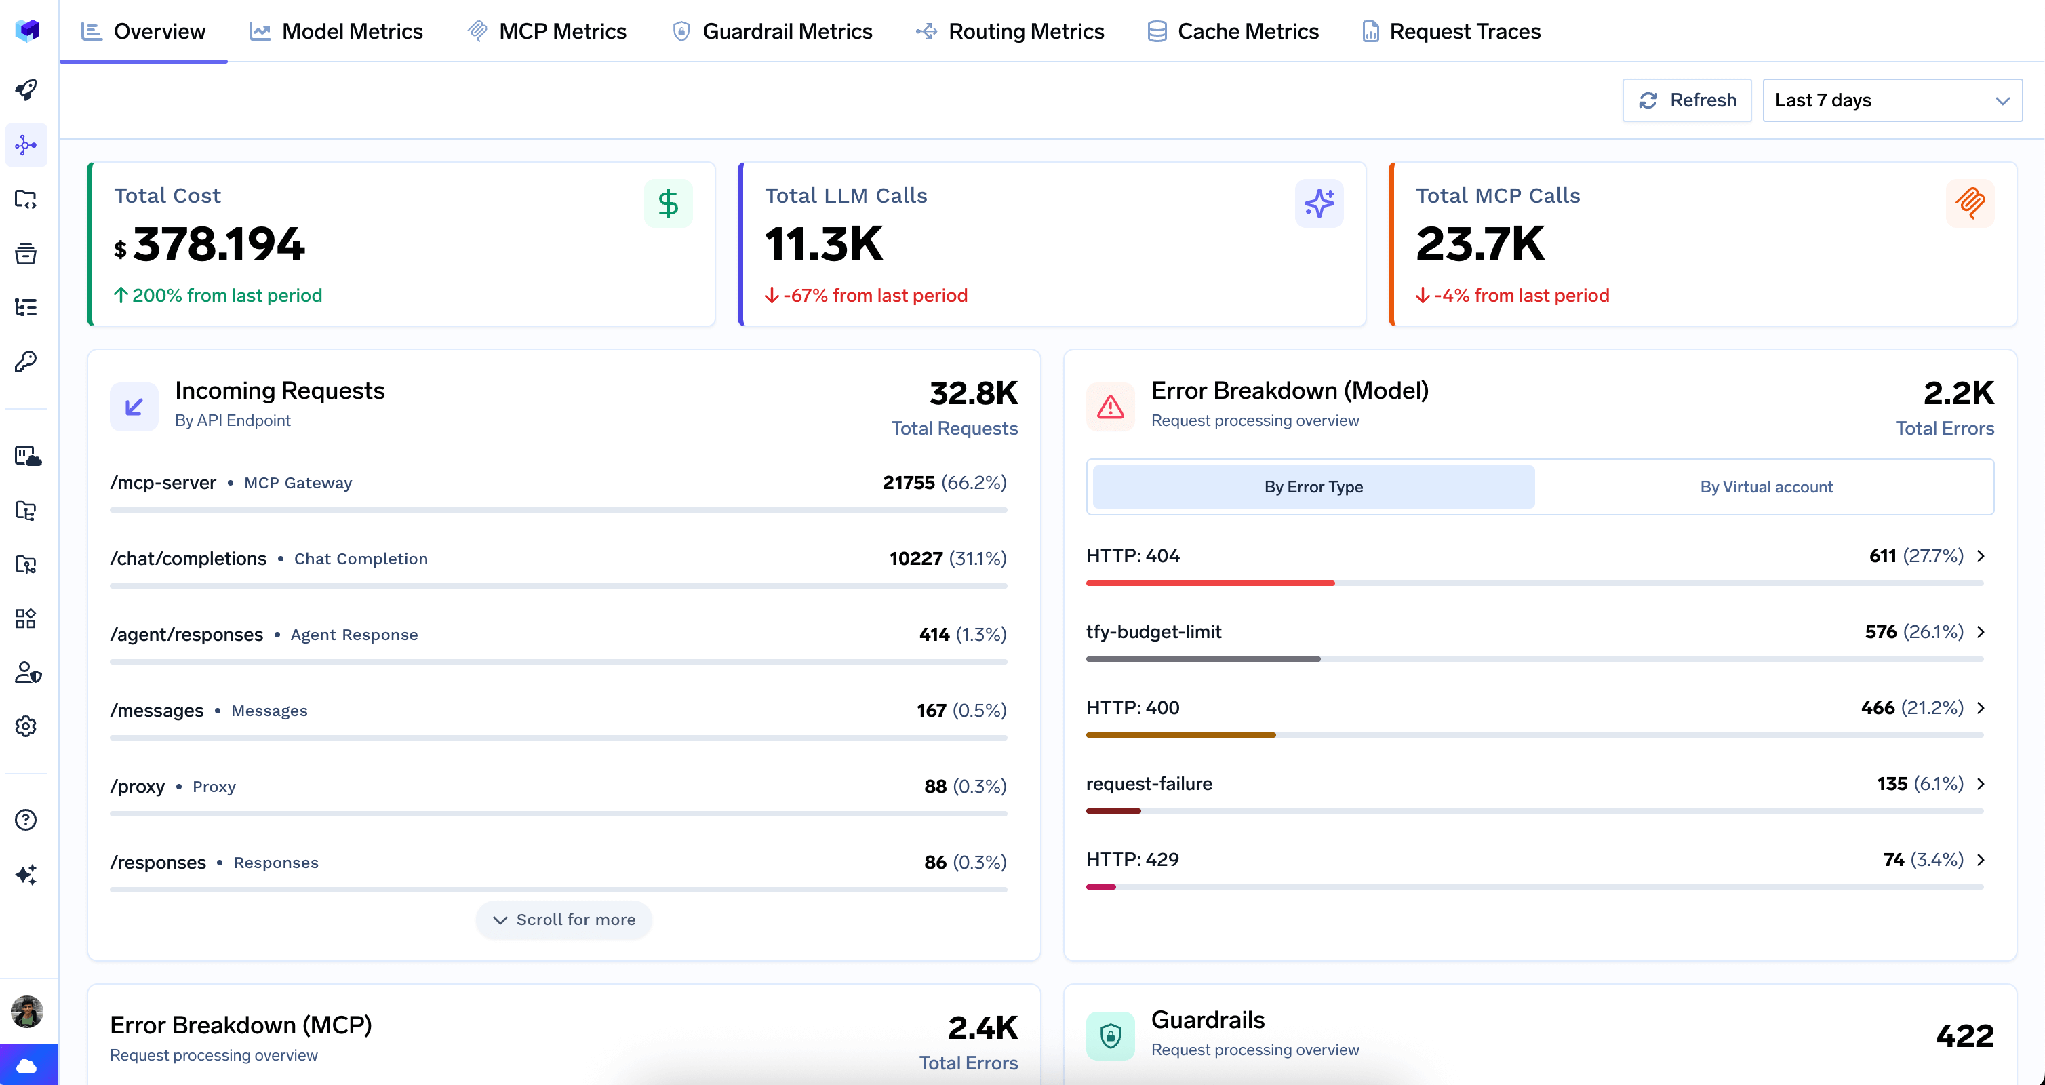
Metrics Dashboard overview with cost, LLM and MCP call counts and usage leaderboards
Five steps, no custom instrumentation, every one a question about the trajectory.
TrueFoundry AI Gateway bietet eine Latenz von ~3—4 ms, verarbeitet mehr als 350 RPS auf einer vCPU, skaliert problemlos horizontal und ist produktionsbereit, während LiteLM unter einer hohen Latenz leidet, mit moderaten RPS zu kämpfen hat, keine integrierte Skalierung hat und sich am besten für leichte Workloads oder Prototyp-Workloads eignet.


Recording an agent’s full execution trajectory — sessions, turns, model calls and tool calls, with arguments, results, tokens, cost and latency — so you can answer why it behaved as it did. It differs from application monitoring in the unit of observation: a request has a start and an end, while a trajectory is a nested sequence in which any level can loop.
LLM observability is a subset covering the model call: prompt, completion, tokens, latency, cost. Agent observability adds everything around it — which tools ran, in what order, with what arguments and results, and how many times a turn went around before stopping. Most real failures live in that structure, not in a single completion.
Not if model and tool traffic already routes through a gateway, since it records each hop as a side effect of serving it. Framework-level SDK instrumentation adds internal reasoning steps the gateway never sees, so the two are complementary, not alternatives.
Yes — VPC, on-prem, air-gapped, hybrid, or across multiple clouds, with no data leaving your domain.
Yes. It includes an MCP Gateway, an Agent Gateway, and an MCP & Agents Registry with tool-level access control. Agents on LangGraph, CrewAI, AutoGen, or a custom framework can all be governed centrally.
Ja. Das Gateway ist OpenTelemetry-kompatibel und lässt sich in Grafana, Datadog, Prometheus oder Ihren bevorzugten Stack integrieren. Es verfolgt jede Anfrage vom Prompt bis zur Ausführung von Tools und Modellen, sodass Sie eine einheitliche Protokollierung erhalten, ohne Ihre bestehenden Systeme entfernen zu müssen.



Die neuesten Nachrichten, Artikel und Ressourcen werden in Ihren Posteingang gesendet



.png)
.png)
.png)
.png)
.png)
.png)
.png)
.png)
.png)
.png)


