October 14, 2026
|
5 min read


Published: July 15, 202613分で読めます
.webp)
Blazingly fast way to build, track and deploy your models!
As large language models (LLMs) become central to modern AI applications, ensuring their reliability, performance, and safety in production is more critical than ever. LLM observability refers to the ability to monitor, trace, and debug LLM behavior, tracking prompts, latency, token usage, user sessions, and failure patterns. Without robust observability, teams risk hallucinations, cost overruns, and silent failures. In this article, let us understand how LLM observability works, the best LLM observability tools and more.
LLM Observability refers to the practice of monitoring, analyzing, and understanding the behavior and performance of Large Language Models (LLMs) in real-world applications. As LLMs are integrated into production systems like chatbots, AI agents, and search engines, observability becomes crucial for ensuring reliability, safety, and trust.
It goes beyond basic logging or metrics. LLM observability focuses on tracking inputs, outputs, prompt chains, latency, token usage, model versioning, and failure cases. It enables developers and ML teams to detect hallucinations, bias, toxic responses, prompt injection attacks, or unexpected behavior. It also helps identify when model outputs drift from expected norms, which is critical for maintaining consistency and compliance, especially in regulated industries.
With observability, teams can perform real-time debugging, trace the root cause of failures, monitor user interactions, and continuously improve prompts or fine-tuned models. Tools like TrueFoundry, LangSmith, Arize, WhyLabs, and PromptLayer are emerging to bring DevOps-style monitoring to LLM systems.
LLM observability acts as the “eyes and ears” of your GenAI stack. It enables safe scaling of AI applications by providing visibility and accountability, helping bridge the gap between experimentation and dependable production deployment.
For a deep dive into the basics of LLM observability, read our detailed guide: What is LLM Observability?
LLM Observability works by capturing detailed telemetry across every stage of LLM’s lifecycle. From prompt submission to final output, it offers visibility into how the system behaves in real-world conditions. This typically involves three main components. Prompt tracing, metrics collection, and behavior monitoring.
Prompt-Level Tracing: Each interaction with the LLM is logged with rich metadata, including the raw prompt, user context, model version, timestamp, and system response. Advanced tools trace multi-step workflows or agent chains, linking upstream and downstream operations using correlation IDs. This allows teams to debug issues like hallucinations, context loss, or performance bottlenecks by tracing the entire inference journey.
Performance & Token Metrics: Observability platforms track latency, token usage (input/output), throughput, and failure rates in real time. These metrics help identify slowdowns, token overuse, or abnormal behavior. Token-level tracking is critical for managing cost in APIs like OpenAI, where pricing is tied to token consumption.
Quality, Guardrails, and Anomaly Detection: Many tools monitor outputs for quality risks like bias, toxicity, or hallucination using statistical models or rules. They also detect violations of moderation policies or safety thresholds and generate alerts. Some platforms integrate embedding drift analysis to monitor shifts in semantic behavior over time.
These observability signals are typically visualized in dashboards and can trigger alerts, integrate with logging systems, or feed back into CI/CD pipelines. By providing transparency, debugging support, and cost insights, LLM observability tools ensure safe, efficient, and scalable GenAI operations.
Here’s a quick overview of the different LLM observability platforms:
Choosing the right observability tool is essential for scaling LLM applications with confidence. From tracing prompts to monitoring latency, today's platforms offer deep insights into every stage of model inference. In this section, we highlight the top tools that stand out in reliability, governance, and developer experience. Whether you're running on cloud or on-premise, these solutions help make LLMs production-ready.
.webp)
End-to-End Prompt and Output Tracing: TrueFoundry captures every stage of an LLM interaction, from prompt generation and model inference to post-processing—creating a full trace with correlation IDs and OpenTelemetry spans. This granular tracking enables developers to pinpoint where latency spikes or errors occur, whether in prompt handling, model response, or downstream processes. Traces are visualized in the UI for easy debugging and stored for compliance auditing, giving you transparency into every decision point in multi-step workflows.
.webp)
Real-Time Analytics: Built-in dashboards provide live insights into model latency, token throughput, error rates, rate-limit hits, and fallback events. Aggregated analytics, such as latency heatmaps and usage breakdowns, refresh in real time, enabling teams to quickly spot issues before they impact users. TrueFoundry supports alerting on thresholds like latency spikes or unusual model drift, ensuring proactive response and minimizing downtime.
.webp)
Fine-Grained Metadata and Cost Attribution: Every invocation is enriched with metadata such as model, user, team, environment, or custom tags, and includes token usage and cost details. This enables precise tracking of spend and usage trends across departments or features. Teams can slice dashboards and export reports for billing transparency and ROI analysis, empowering engineering, finance, and product teams with full visibility into who uses what, when, and at what cost.
Confident AI is the observability platform from the creators of DeepEval, the popular open-source LLM evaluation framework. Its core differentiator is running DeepEval's metrics (hallucination, faithfulness, bias, answer relevancy) directly on production traces, not just logging them.
It captures nested traces across LLM calls, tool use, and multi-agent handoffs, and tracks latency, cost, token usage, error rates, and response quality in real time, with alerts on anomalies. Production traces can also auto-curate into eval datasets for regression testing. Best fit for teams already using DeepEval that want evaluation and observability in one platform rather than stitched together.
.webp)
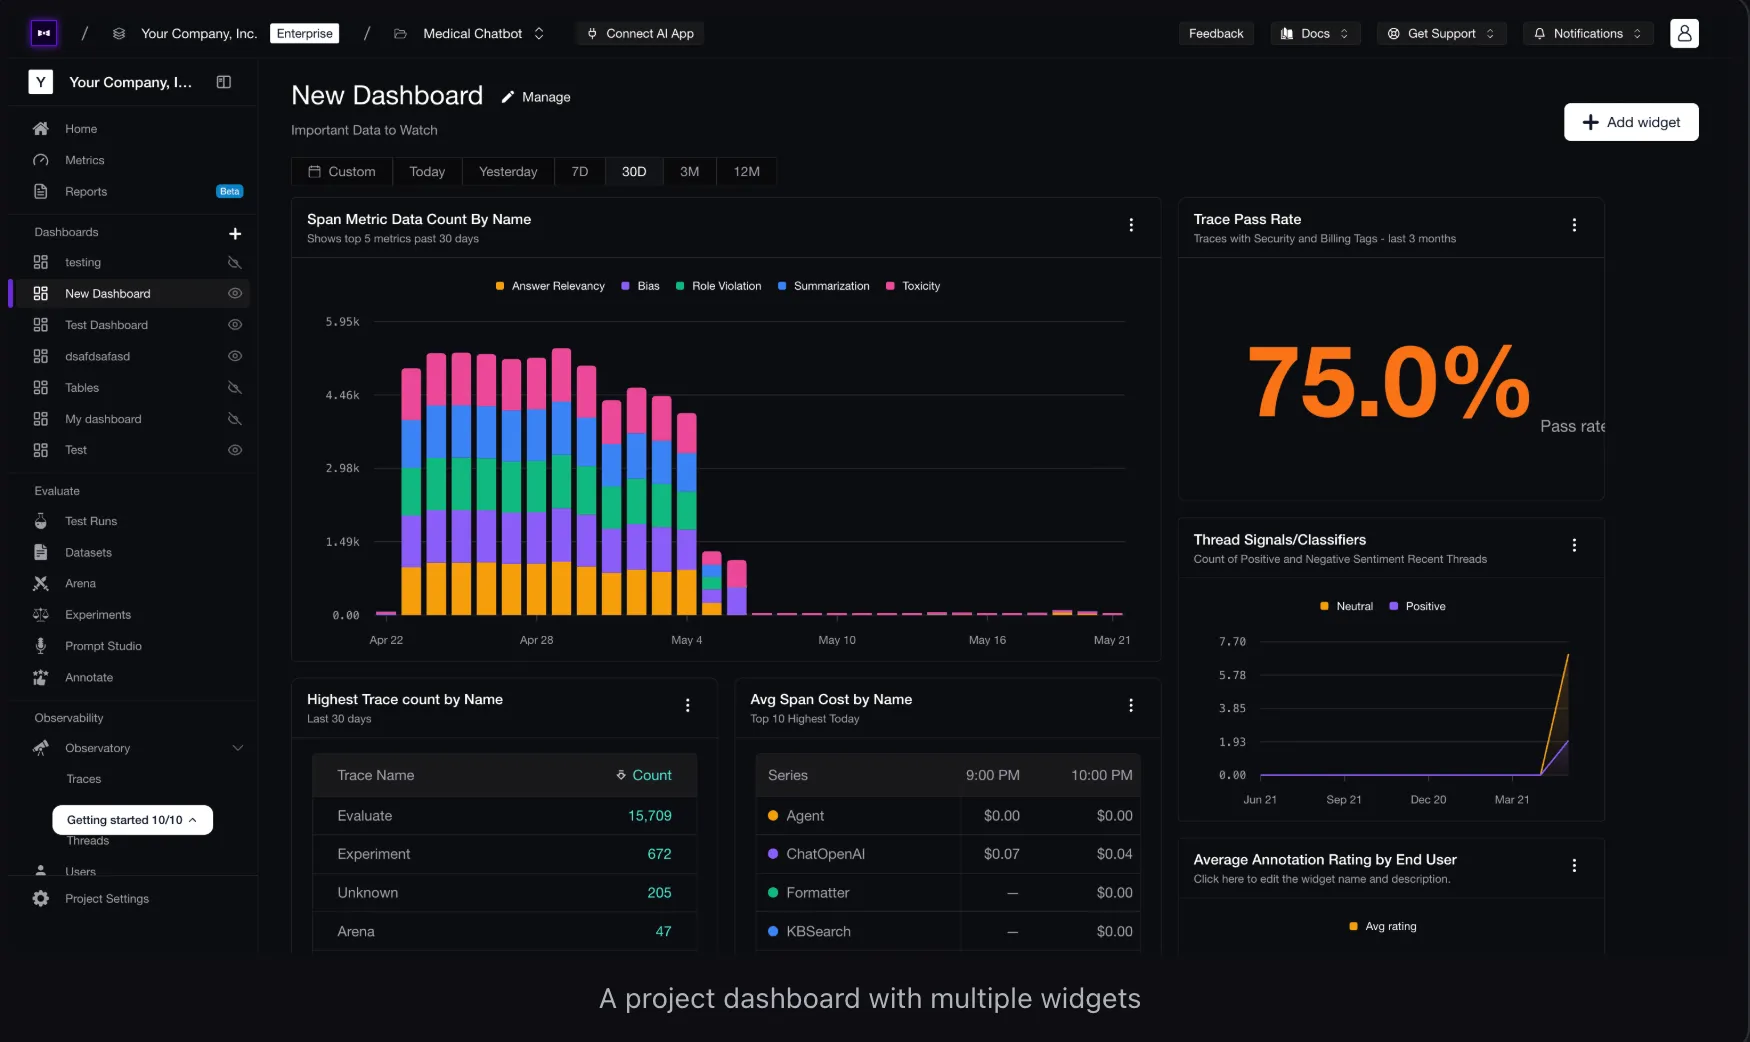
Langfuse is an open-source observability platform built specifically for LLM applications. It provides full prompt-response tracing, including input metadata, model outputs, latency, and token usage. Langfuse integrates seamlessly with LangChain, OpenAI-compatible APIs, and other LLM stacks, making it ideal for developers building multi-step or agentic workflows. It supports tracing across chains, enabling visualization of nested calls, tool usage, and reasoning paths in real time.
The platform logs detailed telemetry for each user session, which can be filtered by project, user, or model. Langfuse also offers support for versioning prompts and tracking changes over time, making it easier to debug regressions or iterate on prompt engineering. Teams can self-host Langfuse or use the managed cloud version, and observability data can be exported for external analytics or compliance reporting. Its intuitive UI and fine-grained control over logs make Langfuse a developer-friendly choice for teams that prioritize transparency and debugging in LLM workflows.
Teams evaluating observability depth and gateway-level capabilities often explore comparisons like langfuse vs portkey to understand differences in tracing, routing, and cost attribution before choosing a production-ready solution
.webp)
Helicone is a lightweight observability layer purpose-built for OpenAI-compatible APIs. It acts as a proxy that logs and monitors every LLM API request, capturing detailed data such as prompt content, token usage, latency, response time, and error codes. Designed for simplicity, Helicone requires minimal configuration, developers can integrate it by simply changing their API endpoint.
What makes Helicone appealing is its focus on cost visibility and team-level insights. It tracks usage across environments, supports virtual API keys, and lets teams break down costs per user, model, or route. The web dashboard offers real-time visibility into prompt-level logs, request volume, and performance trends, helping teams catch issues and manage budgets.
Helicone supports alerts on usage spikes or failures and integrates with external logging tools. It’s open-source and self-hostable, making it a flexible option for startups and dev teams that want fast LLM observability without managing heavy infrastructure or vendor lock-in.
Also explore: Top 5 Helicone Alternatives
.webp)
PromptLayer is a purpose-built observability and prompt management platform for LLM applications. It helps developers track, version, and evaluate every prompt-response pair in real-time, making it easier to debug model outputs and optimize prompt quality. With native support for OpenAI and LangChain, PromptLayer captures metadata like timestamps, latency, token usage, and success/failure status with minimal integration effort.
One of its core features is prompt version control. Developers can annotate changes, compare outputs, and monitor how prompt tweaks impact model performance over time. This is especially useful for teams running A/B tests or iterating rapidly on user-facing AI features. PromptLayer also supports tagging, grouping, and searching logs across users, models, and applications.
Its clean dashboard allows filtering by API key or environment, giving teams a clear view of production performance and development progress. Whether used for debugging, compliance, or experimentation, PromptLayer brings structure and visibility to the prompt engineering lifecycle.
.webp)
WhyLabs LangKit is a specialized observability and monitoring toolkit focused on detecting risks in LLM outputs such as hallucinations, bias, and toxic language. Designed for teams deploying generative AI at scale, LangKit integrates with model inference pipelines and continuously scans outputs for anomalies using statistical and rule-based techniques.
Unlike traditional tracing tools, LangKit emphasizes output quality and behavioral analysis. It monitors shifts in embeddings, semantic drift, and distributional anomalies that may indicate emerging issues with model reliability or data inputs. It also supports explainability by surfacing why certain generations are flagged, helping teams refine prompts, model choices, or guardrails.
LangKit works with self-hosted or managed inference stacks and supports integration with observability backends like WhyLabs Platform, OpenTelemetry, or custom dashboards. It’s particularly valuable in regulated environments or customer-facing applications, where poor LLM output can have real consequences. With LangKit, teams gain proactive quality assurance and early warning signals before failures escalate.
.webp)
Arize AI offers advanced observability and evaluation features tailored for production-grade LLM deployments. Originally built for ML model monitoring, Arize has extended its capabilities to support large language models, focusing on post-deployment analysis, data drift detection, and retrieval-augmented generation (RAG) health.
One of Arize’s key strengths is embedding drift monitoring—tracking changes in vector representations over time to flag semantic shifts in user queries or model behavior. It also supports LLM-specific evaluations such as hallucination detection, relevance scoring, and prompt-output alignment, helping teams benchmark model quality at scale. RAG pipelines benefit from visibility into retriever latency, content match rates, and knowledge gaps.
The platform integrates with OpenAI, Cohere, Hugging Face, and custom LLMs, providing centralized dashboards and alerts. With support for slicing by prompt type, user segments, and feedback loops, Arize enables fine-grained model analysis and continuous improvement. It's a strong choice for enterprises running critical LLM applications that require observability beyond basic token-level logs.
.webp)
Comet ML Observability extends its ML experimentation and tracking suite to include comprehensive support for LLM applications. Designed for research and production teams, Comet enables detailed tracking of prompts, responses, token counts, latency, and user-level interactions in LLM workflows. It supports both prebuilt and custom metrics, making it adaptable for diverse use cases like prompt tuning, model evaluation, and A/B testing.
Comet’s LLM observability tools allow teams to compare prompt variants, visualize performance over time, and annotate prompt runs for collaborative debugging. With tight integration into model training and inference pipelines, it unifies monitoring across model lifecycle stages, from fine-tuning to deployment. Teams can tag experiments, monitor guardrail violations, and set alerts for anomalous behaviors.
It also supports integration with OpenAI, Hugging Face, LangChain, and custom endpoints, making it suitable for both hosted and self-managed LLMs. For teams already using Comet for model development, this extension adds valuable transparency and governance to LLM usage.
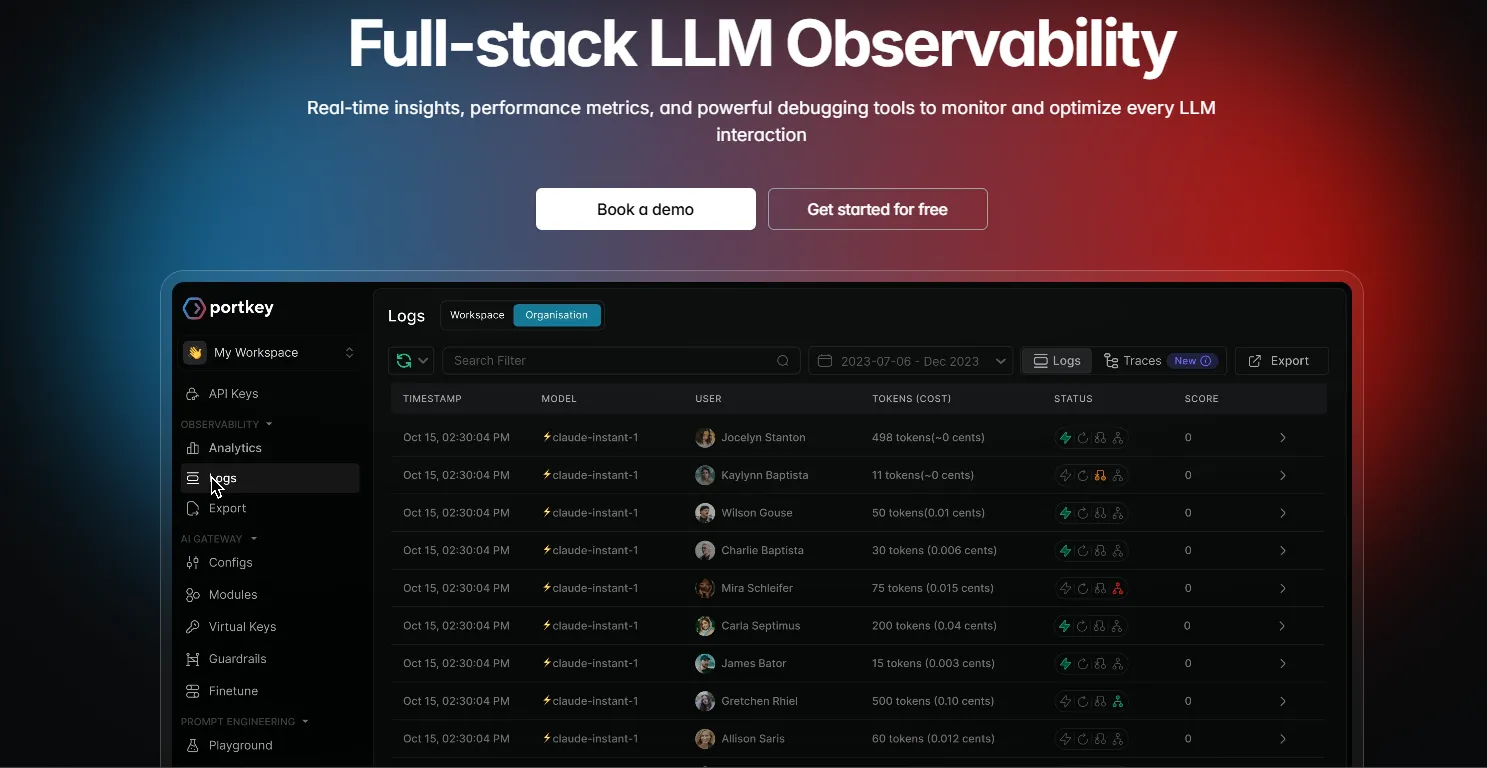
Portkey became widely known through its open-source LLM Gateway, which provides unified access to 100+ LLM providers through a single API. It later expanded into LLM observability, helping teams monitor and manage AI applications at scale.
The platform works as a proxy layer between your application and LLM providers, allowing teams to manage prompt libraries, routing rules, retries, temperature settings, and model configurations centrally. Portkey also supports response caching, load balancing, and fallback routing to improve reliability and reduce infrastructure costs.
For observability, Portkey captures request and response logs, token usage, latency, and model analytics. However, it mainly focuses on logging interactions rather than full workflow tracing. Its combination of gateway management and monitoring makes it a strong choice for high-volume, multi-model AI deployments.
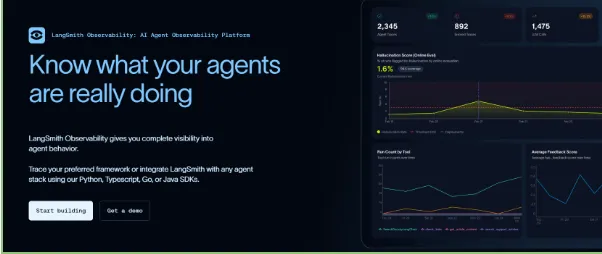
LangSmith is a commercial tracing and observability platform developed by LangChain, one of the fastest-growing LLM orchestration frameworks. Since launching in July 2023, it has grown rapidly alongside the LangChain ecosystem and its large developer community.
LangSmith is deeply integrated with LangChain, allowing developers to automatically capture traces from prompts, model outputs, tool calls, latency, and execution flows without major code changes. It also supports workflows outside LangChain, making it useful for debugging complex LLM applications and agent-based systems.
The platform includes evaluation tools that let teams manually review outputs or use LLM-based evaluators for automated scoring and benchmarking. LangSmith also offers analytics and limited cost monitoring, mainly for OpenAI usage. While it does not provide self-hosting in its standard offering, it remains a popular choice for teams focused on tracing and debugging LLM workflows.
Selecting the right LLM observability tool can make the difference between confidently scaling AI systems and flying blind with unpredictable model behavior. As LLMs become deeply embedded in customer-facing, high-stakes applications, observability needs to go beyond basic logs and metrics. Here are the key criteria to evaluate when choosing the right solution:
Prompt-Level Tracing and Telemetry
At the core of LLM observability is the ability to trace each prompt from start to finish. A good tool should record prompt content, input metadata, model responses, token usage (input and output), latency, and downstream system impact. This visibility helps diagnose failures, optimize cost, and monitor quality.
Support for Multiple LLM Providers and Models
Since modern applications may use different models (OpenAI, Anthropic, Mistral, self-hosted via vLLM, etc.), the observability platform should integrate seamlessly with all providers. It should provide unified views and support the OpenAI-compatible API format for easy adoption.
Real-Time Monitoring and Alerting
Look for systems that support real-time dashboards, latency heatmaps, and token consumption metrics. More importantly, they should allow alerting on unusual behavior like a spike in error rates, excessive latency, or prompt failures. This enables faster response and resolution during production incidents.
Guardrail Violation and Policy Auditing
An enterprise-grade tool should track guardrail violations, instances where inputs or outputs breach moderation or safety policies. This is essential for maintaining compliance and aligning model behavior with organizational standards.
Cost Attribution and Budget Enforcement
Advanced observability platforms provide granular cost tracking down to the user, model, or prompt level. Strong LLM cost tracking solution capabilities allow engineering and finance teams to monitor usage in real time, enforce budgets, and prevent silent cost overruns in production. Some allow integration with billing systems or enforce usage limits through alerts and automated controls. This helps engineering and finance teams stay aligned.
Role-Based Access and Team-Level Views
For large organizations, the ability to filter data by user, team, or project is essential. Observability tools should support RBAC and allow scoped access so that teams only see relevant traces and logs.
Integration with Dev Tools and Data Lakes
Choose platforms that offer APIs, export functionality, and support for data sinks like ClickHouse, BigQuery, or OpenTelemetry. This ensures observability data can be extended into analytics, compliance audits, or model fine-tuning workflows.
A well-rounded observability tool not only helps you monitor performance but also improves model governance, debugging speed, and cost control. Prioritize flexibility, security, and real-time insights to future-proof your LLM stack.
To know more about how cost attribution and budgeting work, read our in-depth guide on: AI Cost Observability: Tracking and Controlling LLM Spend in Production
As LLM-powered applications move from experimentation to production, observability becomes essential for reliability, safety, and scalability. Unlike traditional software systems, LLMs generate probabilistic outputs, meaning the same input can produce different responses depending on context, prompt design, or model state. Without visibility into how these systems behave, debugging and optimization become extremely difficult.
One of the biggest reasons LLM observability matters is hallucination detection. Models can confidently generate inaccurate or misleading responses, especially in customer-facing applications. Observability tools help teams trace prompts, inspect outputs, and identify where hallucinations occur so they can improve prompts, retrieval pipelines, or guardrails.
Cost management is another major concern. Since many LLM APIs charge based on token consumption, even small inefficiencies can lead to large-scale cost overruns. Observability platforms track token usage, latency, and throughput in real time, allowing teams to optimize prompts and reduce unnecessary API spend.
LLM observability also improves reliability and user experience. By monitoring latency spikes, failed requests, or degraded output quality, teams can respond to incidents faster and maintain application performance. This is especially important for AI agents, copilots, and RAG pipelines that rely on multiple model calls and external tools.
Security and compliance are equally important. Observability helps detect prompt injection attacks, toxic outputs, policy violations, and unauthorized data exposure. For enterprises operating in regulated industries like healthcare or finance, this visibility is critical for governance and auditability.
Ultimately, observability transforms LLM systems from black boxes into manageable, production-ready infrastructure. It enables teams to build safer, more efficient, and more trustworthy AI applications at scale.
TrueFoundry は、ディープトレーシング、リアルタイム分析、ガバナンス、コスト可視化を単一の運用可能なスタックに統合することで、エンタープライズグレードのLLMオブザーバビリティ向けに最も包括的なプラットフォームの一つとして際立っています。
TrueFoundryの最大の強みの一つは、そのエンドツーエンドのトレーシングアーキテクチャです。プロンプト、応答、レイテンシ、モデルメタデータ、ツール呼び出し、フォールバックイベント、ダウンストリームの依存関係など、すべてのLLMインタラクションがワークフロー全体で捕捉されます。これにより、チームは各推論ステップを完全に可視化し、複雑なAIシステムのデバッグが可能になります。
このプラットフォームは、以下の項目を追跡する高度なリアルタイム監視ダッシュボードも提供しています。
これらの洞察は、ユーザーに影響を与えたり、インフラコストを増加させたりする前に、チームがボトルネックを迅速に特定するのに役立ちます。
もう一つの大きな強みは、きめ細かなコスト配分です。TrueFoundryは、組織がトークンの使用量と支出を以下によって追跡することを可能にします。
このレベルの可視性は、複数の部門で大規模なGenAIワークロードを実行している企業にとって非常に価値があります。
多くの軽量なオブザーバビリティツールとは異なり、TrueFoundryは本番AI運用向けに設計されています。以下をサポートします。
このため、機密データや規制対象データを扱う組織にとって特に魅力的です。
TrueFoundryは、OpenAI互換API、LangChainワークフロー、RAGパイプライン、カスタム推論スタックなど、最新のLLMエコシステムともシームレスに統合します。チームはインフラを再構築することなく、オブザーバビリティを導入できます。
ガバナンス、信頼性、コスト効率を維持しながらAIを責任を持ってスケールさせたい企業にとって、TrueFoundryは2026年に入手可能なLLMオブザーバビリティソリューションの中で最も完成度の高いものの1つを提供します。
LLMが現代のアプリケーションの基盤となるにつれて、オブザーバビリティはもはやオプションではなく、不可欠なものとなっています。適切なツール、例えば TrueFoundry LLMオブザーバビリティ は、チームがプロンプトの動作を追跡し、コストを管理し、障害を検出し、責任あるAIデプロイメントを大規模に確保するのに役立ちます。レイテンシの最適化、ハルシネーションの防止、トークン使用量の分析など、これらのツールは自信を持って運用するために必要な可視性を提供します。
TrueFoundry、Langfuse、Arizeのようなプラットフォームは、本番環境レベルの機能で業界をリードしており、その他にも迅速な統合のための軽量なオプションを提供しています。最終的に、最適なツールは、スタック、ガバナンスのニーズ、運用規模によって異なります。今日オブザーバビリティに投資することで、明日より安全でスマートなLLMシステムが保証されます。
企業向けAIワークロードに最適なLLMオブザーバビリティプラットフォームであるTrueFoundryで、本番環境のトレースを完全に可視化し、コストを最適化しましょう。 デモを予約する 今日、モデルの信頼性、安全性、効率性を確保するために。
TrueFoundry AI Gateway delivers ~3–4 ms latency, handles 350+ RPS on 1 vCPU, scales horizontally with ease, and is production-ready, while LiteLLM suffers from high latency, struggles beyond moderate RPS, lacks built-in scaling, and is best for light or prototype workloads.





.png)
.png)
.png)
.png)
.png)
.png)