


April 17, 2025
|
5 min read

Published: March 16, 2026

Blazingly fast way to build, track and deploy your models!
In an era where LLMs power critical applications, visibility into their inner workings is non-negotiable. LLM observability is the practice of capturing and analyzing inference-level data, including token usage, prompt performance, error rates, latency, and cost metrics, and correlating it with user interactions. This goes beyond traditional model monitoring, which largely tracks infrastructure metrics like CPU usage and response times. TrueFoundry’s AI Gateway embeds a comprehensive observability layer with prompt versioning, structured logging, real-time analytics dashboards, and anomaly alerts to surface actionable insights, optimize performance, and control costs at every stage of your LLM pipeline.
LLM observability is the end-to-end practice of instrumenting, collecting, and analyzing every inference event in a language model pipeline. It combines two core layers:
Interactive Analytics
A centralized dashboard displays real-time metrics on token usage, request volume, and cost. You can view cumulative input and output tokens, total requests, and token costs alongside latency percentiles (P50, P90, P99) for each model. Charts reveal requests per second, error rates, user-level consumption, and model-specific cost breakdowns. Filters let you isolate calls affected by rate limiting, fallbacks, or load balancing and inspect which rules applied.
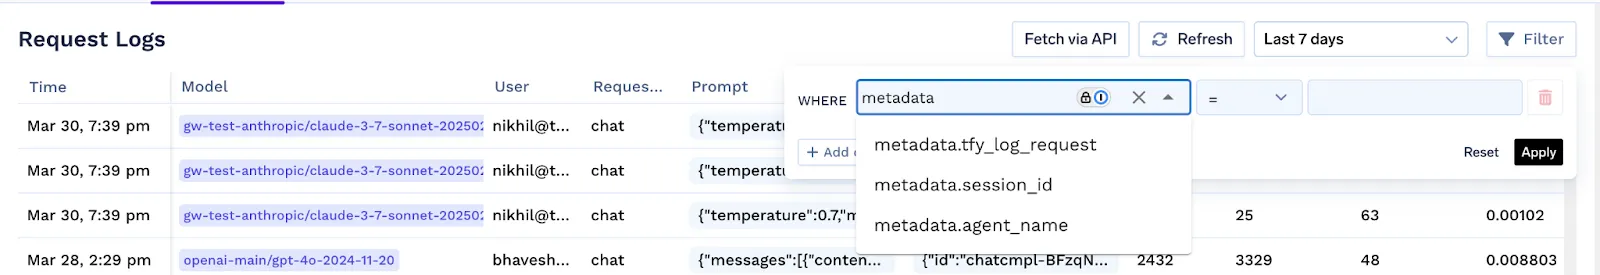
Metadata-Driven Context
Each request can carry custom tags such as environment (dev, staging, prod), feature name, user ID, team, or any business context via an X-TFY-METADATA header. Metadata enables:
Log Export
For in-depth analysis or archiving, TrueFoundry supports structured JSON exports of logs and traces on request, enabling offline investigation of performance, cost, and usage patterns
Together, these capabilities give teams full visibility into model behavior, cost drivers, and potential issues, ensuring reliable and optimized LLM deployments.
| Criteria | What should you evaluate ? | Priority | TrueFoundry |
|---|---|---|---|
| Latency | Adds <10ms p95 overhead for time-to-first-token? | Must Have | ✅ Supported |
| Data Residency | Keeps logs within your region (EU/US)? | Depends on use case | ✅ Supported |
| Latency-Based Routing | Automatically reroutes based on real-time latency/failures? | Must Have | ✅ Supported |
| Key Rotation & Revocation | Rotate or revoke keys without downtime? | Must Have | ✅ Supported |
| Key Rotation & Revocation | Rotate or revoke keys without downtime? | Must Have | ✅ Supported |
| Key Rotation & Revocation | Rotate or revoke keys without downtime? | Must Have | ✅ Supported |
| Key Rotation & Revocation | Rotate or revoke keys without downtime? | Must Have | ✅ Supported |
| Key Rotation & Revocation | Rotate or revoke keys without downtime? | Must Have | ✅ Supported |
Traditional model observability focuses primarily on infrastructure health and basic request metrics. You monitor system-level indicators, such as CPU and GPU utilization, memory consumption, disk I/O, network throughput, overall request latency, and error rates. These metrics indicate whether your model-serving platform is operational and where compute or networking bottlenecks may occur. Alerts trigger on threshold breaches like high CPU load or elevated 5xx error rates, enabling operations teams to provision resources or investigate service outages.
LLM observability, in contrast, dives deeper into the semantics and economics of each inference. Large language models handle variable-length inputs and generate content token by token, so understanding their behavior requires content-aware instrumentation:
Token Metrics versus Fixed Throughput
Traditional models count requests per second; LLMs track input and output tokens. Observability captures cumulative token volumes, token costs, and per-model token usage. This allows you to attribute spending to specific users or features and detect runaway prompts before costs escalate.
Prompt-Response Logging versus Black-Box Predictions
Standard ML observability logs only request metadata, such as endpoint hit and status code. LLM observability records full prompt-response pairs along with contextual metadata like environment, feature, and user ID. This makes it possible to trace hallucinations or quality regressions back to particular prompt templates or user cohorts.
Latency Percentiles versus Averages
Traditional setups often report average latency. LLM dashboards surface P50, P90, and P99 latency percentiles per model, since token-by-token generation can introduce long-tail delays that average metrics obscure.
Configuration-Driven Effects
With LLMs, controls such as rate limiting, load balancing, and fallback rules affect behavior. Observability flags requests impacted by these rules – for example, calls that were rate-limited, rerouted, or fell back to another provider – enabling teams to fine-tune policies.
Real-Time Analytics versus Post-Mortem Logs
While traditional observability relies on periodic log analysis, LLM observability platforms like TrueFoundry’s AI Gateway provide interactive dashboards for real-time filtering and trend exploration, allowing you to slice metrics by metadata tags on the fly.
In summary, traditional observability answers the question, “Is the serving infrastructure healthy?” LLM observability explains, “How, when, and why is each token generated, and what does that mean for cost, performance, and output quality?”
Implementing robust observability for LLMs is essential to maintain performance, control costs, and ensure high-quality outputs. These core pillars work together to give teams complete visibility into every inference event. By understanding and applying them, you can monitor, diagnose, and optimize your LLM deployments effectively.
1. Interactive Analytics
A unified dashboard delivers real-time insights into every aspect of your LLM workload. You can track cumulative and per-model input and output token volumes, total request counts, and token-based costs. Detailed latency percentiles, P50, P90, and P99, reveal performance characteristics. Charts for requests per second and error rates help you spot anomalies. Filters let you drill down into calls affected by rate limits, load balancing rules, or fallbacks for targeted troubleshooting.
2. Metadata-Driven Context
By attaching custom metadata to each request, such as environment (dev, staging, prod), feature name, user ID, or team, you gain the ability to slice and dice your metrics. Metadata powers granular usage monitoring across cohorts, drives conditional controls for rate limiting and model selection, and enables precise log filtering for audits and compliance. You pass metadata via a single X-TFY-METADATA header in OpenAI or LangChain SDKs, REST requests, or cURL calls.
3. Comprehensive Logging
Every inference is logged in a structured format that includes full prompt-response pairs, token counts, latency details, error codes, and attached metadata. This level of detail lets you conduct root-cause analysis on hallucinations, quality regressions, or performance anomalies. You can compare prompt versions, monitor how template changes affect output quality, and trace issues back to specific user cohorts or features.
4. Log Export and Audit
For deeper offline analysis or archiving, TrueFoundry supports structured JSON exports of logs and traces. Admins simply request exports via support with a specified time frame. Exported data enables custom analytics, compliance reporting, or long-term storage.
Together, these pillars deliver full transparency into cost drivers, performance profiles, and output quality, ensuring your LLM deployments remain reliable, efficient, and cost-effective.
Here are the 4 best LLM observability tools, with a brief overview of each:
TrueFoundry’s AI Gateway delivers a unified, enterprise-grade observability and governance solution for LLMs with the following capabilities:
Real-Time Metrics
.webp)
Interactive dashboards showing cumulative and per-model input/output token counts, total request volume, cost breakdowns by model and user, and detailed latency percentiles (P50, P90, P99). Request-per-second heatmaps, error-rate trends, and configurable anomaly alerts to surface spikes in failures or latency
Metadata-Driven Insights
{
"tfy_log_request": "true", //Whether to add a log/trace for this request or now
"environment": "staging", // THe environment - dev, staging or prod?
"feature": "countdown-bot" //Which feature initiated the request?
}
Tag requests with business context (environment, feature, user, team) via a single X-TFY-METADATA header. Slice dashboards and logs by metadata to compare environments, isolate feature usage, and audit user or team activity.
Policy Controls as Code
Define YAML-driven rate-limiting rules (for example, “1000 GPT-4 calls/day for dev”), load-balancing weights across providers, and fallback chains when errors occur
Version-controlled policy definitions managed via GitOps workflows, enabling pull-request reviews, CI validation, and rollbacks
Comprehensive Logging & Tracing
Store structured JSON logs of full prompt-response pairs, token-level breakdowns, latency, error codes, and applied policy IDs. Correlate across distributed traces to debug multi-step workflows or RAG pipelines
Export & Compliance:
On-demand export of logs and traces in JSON for offline analysis, long-term archival, or regulatory audits. Built-in RBAC and audit trails ensure only authorized users can view or export sensitive data
These features make TrueFoundry a standout choice for teams needing end-to-end visibility, fine-grained cost control, policy-as-code governance, and robust auditability in their LLM deployments.
LangSmith specializes in deep tracing and debugging for LangChain–based applications. It automatically captures each step of your chains, logging prompt inputs, intermediate outputs, and final responses. Developers get an interactive trace visualizer to compare prompt templates over time, identify performance regressions, and drill into function calls. LangSmith also records runtime metrics such as token usage and latency per chain step, and lets you attach custom metadata for feature tracking. With built-in experiment management, you can tag runs, compare output quality across model versions, and roll back to proven configurations. Its focus on developer ergonomics and chain transparency makes it ideal for rapid iteration and debugging.
Helicone offers an API-centric observability platform tailored for generative AI. It records every API call to OpenAI, Anthropic, or other endpoints, capturing full prompt texts, responses, token usage, and timing details. Helicone’s dashboard highlights cost per call, most-used prompt templates, and error distributions, helping you pinpoint expensive or failure-prone patterns. Built-in traffic-shaping visualizations reveal how rate limits and quotas impact throughput, and you can configure alerts on cost spikes or elevated error rates. With its lightweight SDK integrations, Helicone provides quick insights into spend and performance, making it a great choice for teams focused on API cost control and prompt optimization.
Lunary focuses on simplicity and developer experience for LLM observability. It auto-instruments OpenAI and Anthropic SDK calls, logging prompt journeys, token metrics, and response times with minimal configuration. Its dashboard presents versioned prompt templates and regression detection for output quality, alerting you when changes introduce unexpected results. Lunary also offers an annotations API to tag experiments or A/B tests, enabling clear comparisons across runs. While lightweight, it supports conditional controls for rate limiting and fallback routing. Lunary’s emphasis on ease of setup and core observability features makes it ideal for small teams or prototypes that need fast feedback on model behavior without complex integrations.
Variable Token Usage: LLMs generate outputs token by token, so each request may consume vastly different token counts. Monitoring and attributing costs becomes complex when token volumes fluctuate wildly across prompts and users. Without fine-grained token tracking, teams risk unexpected billing spikes or unnoticed inefficient prompts.
High Data Volume: Capturing full prompt-response pairs, token metrics, latency details, and metadata for every inference can generate millions of log entries daily. Storing, indexing, and querying this volume of structured data requires scalable storage solutions and optimized query engines to avoid performance bottlenecks in your observability pipeline.
Contextual Complexity: LLM behavior depends heavily on prompt phrasing, temperature settings, and model version. Correlating changes in output quality or latency with specific prompt edits or configuration tweaks demands robust trace linking and versioning. Teams must implement consistent metadata tagging and prompt version control to untangle the web of influencing factors.
Multi-Provider Correlation: Many deployments use multiple LLM providers for load balancing or cost optimization. Aggregating metrics across OpenAI, Azure, Anthropic, and other endpoints into a unified view requires normalizing disparate APIs, response formats, and cost structures. Failure to unify these streams leads to fragmented insights and blind spots in cross-provider performance comparisons.
Real-Time Alerting vs. Noise: Setting meaningful alert thresholds for error rates, latency spikes, or cost anomalies is challenging in an environment where natural fluctuations are common. Too-sensitive alerts lead to alert fatigue, while thresholds set too high may delay detection of critical issues. Teams need adaptive alerting strategies that learn normal usage patterns and adjust thresholds dynamically.
Compliance and Privacy: Storing full conversation logs can conflict with data privacy regulations or internal security policies. Balancing the need for observability data with requirements for data minimization, encryption, and access controls requires careful policy definition and tooling support for selective log redaction or anonymization.
Addressing these challenges demands a robust observability framework that scales with usage, enforces consistent metadata practices, normalizes multi-provider data, and offers intelligent alerting to surface only the most critical issues.
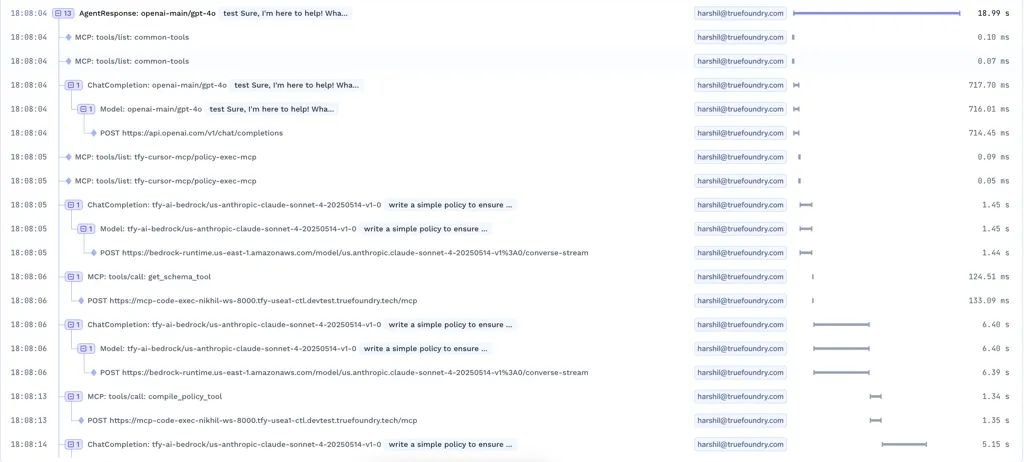
In real systems, an LLM request is rarely a single call to a model. It’s a chain of steps.
User input becomes a prompt. That prompt pulls in context. The model responds. The response triggers a tool. The tool result feeds back into the model. Only then does the user see an answer. Each stage involves repeated LLM inferencing, which is why tracing must capture every intermediate decision rather than only the final output.
Good tracing makes this visible.
Teams need to see:
Without this, debugging turns into guesswork. With it, teams can follow exactly what happened and where things went sideways.
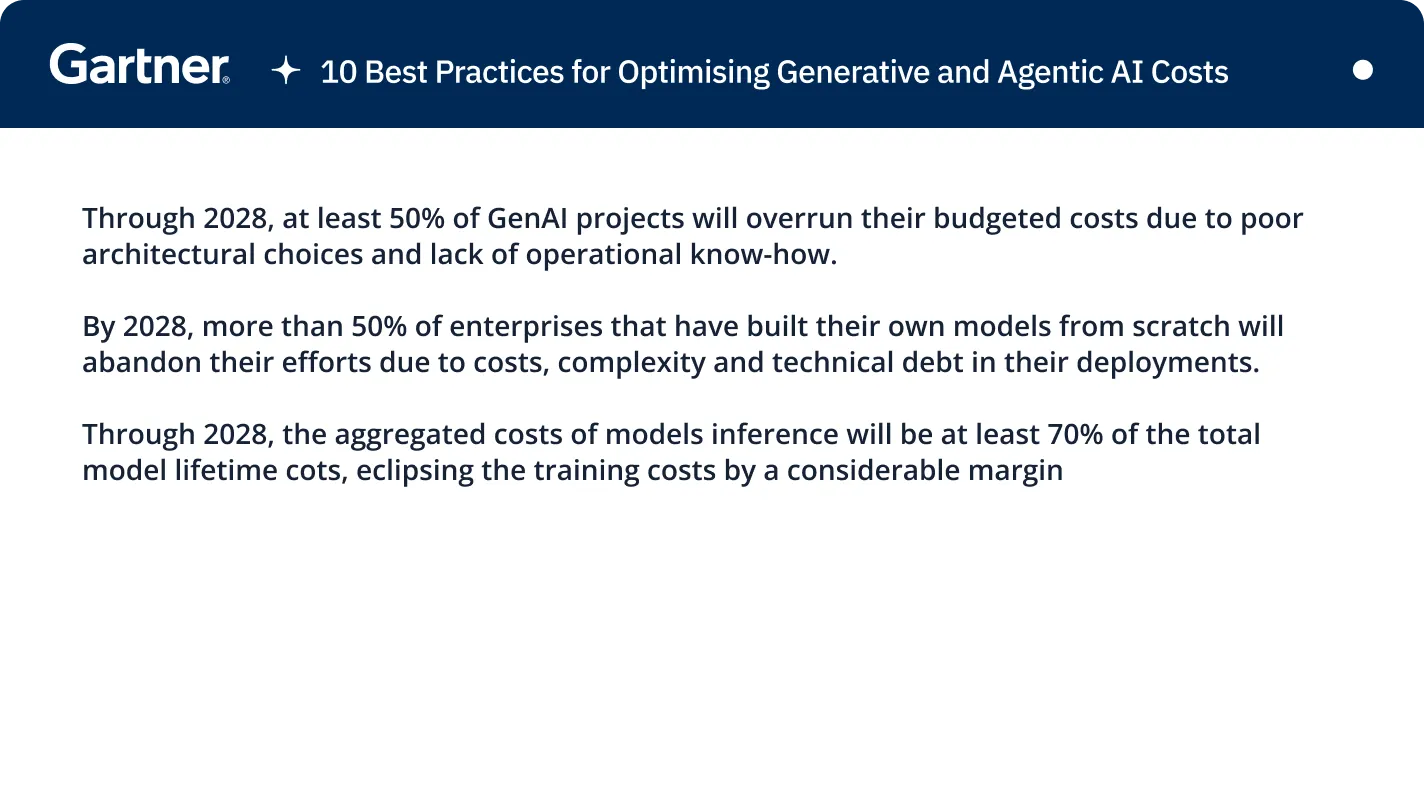
For many teams, cost is the first real alarm bell. LLM costs don’t grow like infrastructure costs. They grow with tokens, verbosity, retries, and hidden intermediate steps. A small prompt change or a misbehaving agent can quietly double-spend.
This is why token-level visibility matters.
Teams need to understand:
When token data is tied to traces, cost stops being a surprise and starts being something you can manage.
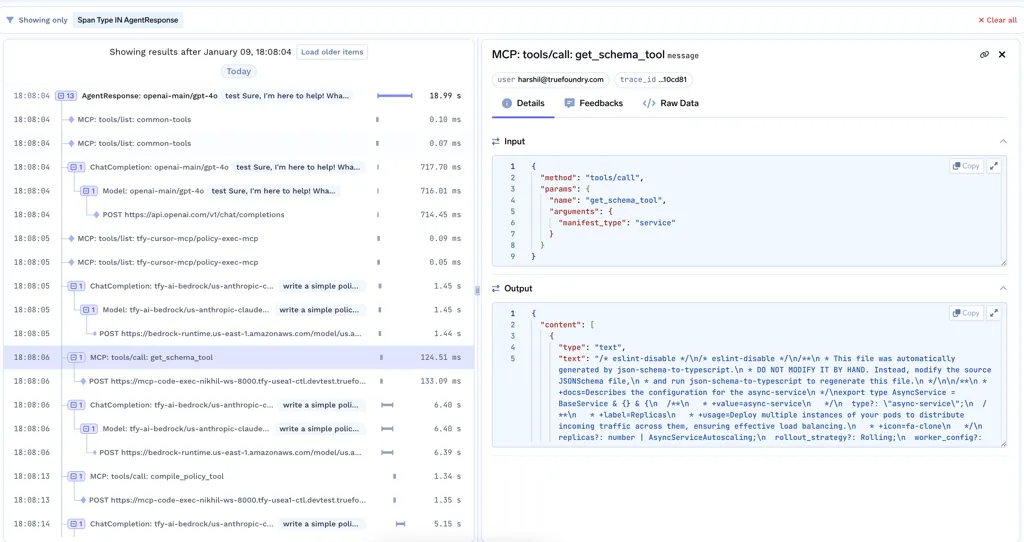
Once LLMs start calling tools, things get more powerful - and more fragile. Agents can search databases, call APIs, or trigger workflows. With MCP, these tools are discovered and invoked dynamically, which makes systems more flexible but also harder to reason about.
In production, teams need clear answers to basic questions:
Without observability at the LLM observability tool level, teams lose trust quickly. With it, they can audit behavior, debug failures, and safely scale agent-based systems.
The goal isn’t better dashboards. It’s confidence. In practice, this is where LLMOps becomes critical, because observability data must continuously feed deployment decisions, cost controls, and model governance. When teams can see traces, token usage, and tool behavior clearly, they can catch issues earlier, control costs, and improve quality based on real production data.
This creates a loop: observe what happens in production, learn from it, improve the system, and repeat. Platforms like TrueFoundry’s AI Gateway help teams do this by bringing tracing, metrics, and governance together in one place, so LLM systems can be treated like the critical infrastructure they are.
Implementing LLM observability transforms opaque inference pipelines into transparent, manageable systems. By combining interactive analytics, metadata-driven context, dynamic policy controls, comprehensive logging, and seamless log export, teams gain the insights needed to monitor performance, control costs, and maintain output quality. While challenges like variable token usage, data volume, and multi-provider correlation demand scalable architectures and disciplined metadata practices, a unified observability solution ensures you can detect anomalies early, troubleshoot effectively, and iterate on prompts with confidence. In today’s AI-driven landscape, robust LLM observability is not optional but essential for delivering reliable, cost-efficient applications at scale.
Book a demo to see how TrueFoundry can help you improve LLM observability.
Observability in AI refers to the ability to understand a system's internal state by examining its telemetry and outputs. By analyzing traces, metrics, and logs, teams can diagnose performance issues in real time. This ensures that complex deployments remain transparent, reliable, and closely aligned with intended business goals.
The five pillars of LLM observability include interactive analytics, metadata-driven context, comprehensive logging, evaluations, and log exports. These elements provide visibility into token consumption, costs, and response quality. Together, they allow engineering teams to effectively monitor, troubleshoot, and optimize their LLM applications.
Popular platforms for gaining deep model insights include LangSmith, Helicone, and Arize Phoenix. For organizations prioritizing data sovereignty, TrueFoundry offers a powerful way to implement LLM observability within their own infrastructure. These tools help developers debug reasoning chains, track costs, and maintain high output quality of responses.
Traditional monitoring tracks known metrics like latency or error rates to maintain infrastructure health. LLM observability uses semantic tracing to explain why specific issues occur. While monitoring simply flags that a system has failed, observability provides the deep data and context necessary to find and fix the root cause.
TrueFoundry is unique because it unifies application-level tracing with infrastructure monitoring inside your own secure VPC. It maintains sub-10ms latency while handling high traffic across multiple providers. This integration ensures that LLM observability efforts remain cost-effective and secure while providing granular insights into every single model interaction.
TrueFoundry AI Gateway delivers ~3–4 ms latency, handles 350+ RPS on 1 vCPU, scales horizontally with ease, and is production-ready, while LiteLLM suffers from high latency, struggles beyond moderate RPS, lacks built-in scaling, and is best for light or prototype workloads.


The latest news, articles, and resources sent to your inbox


.webp)


.webp)
.webp)
.webp)


