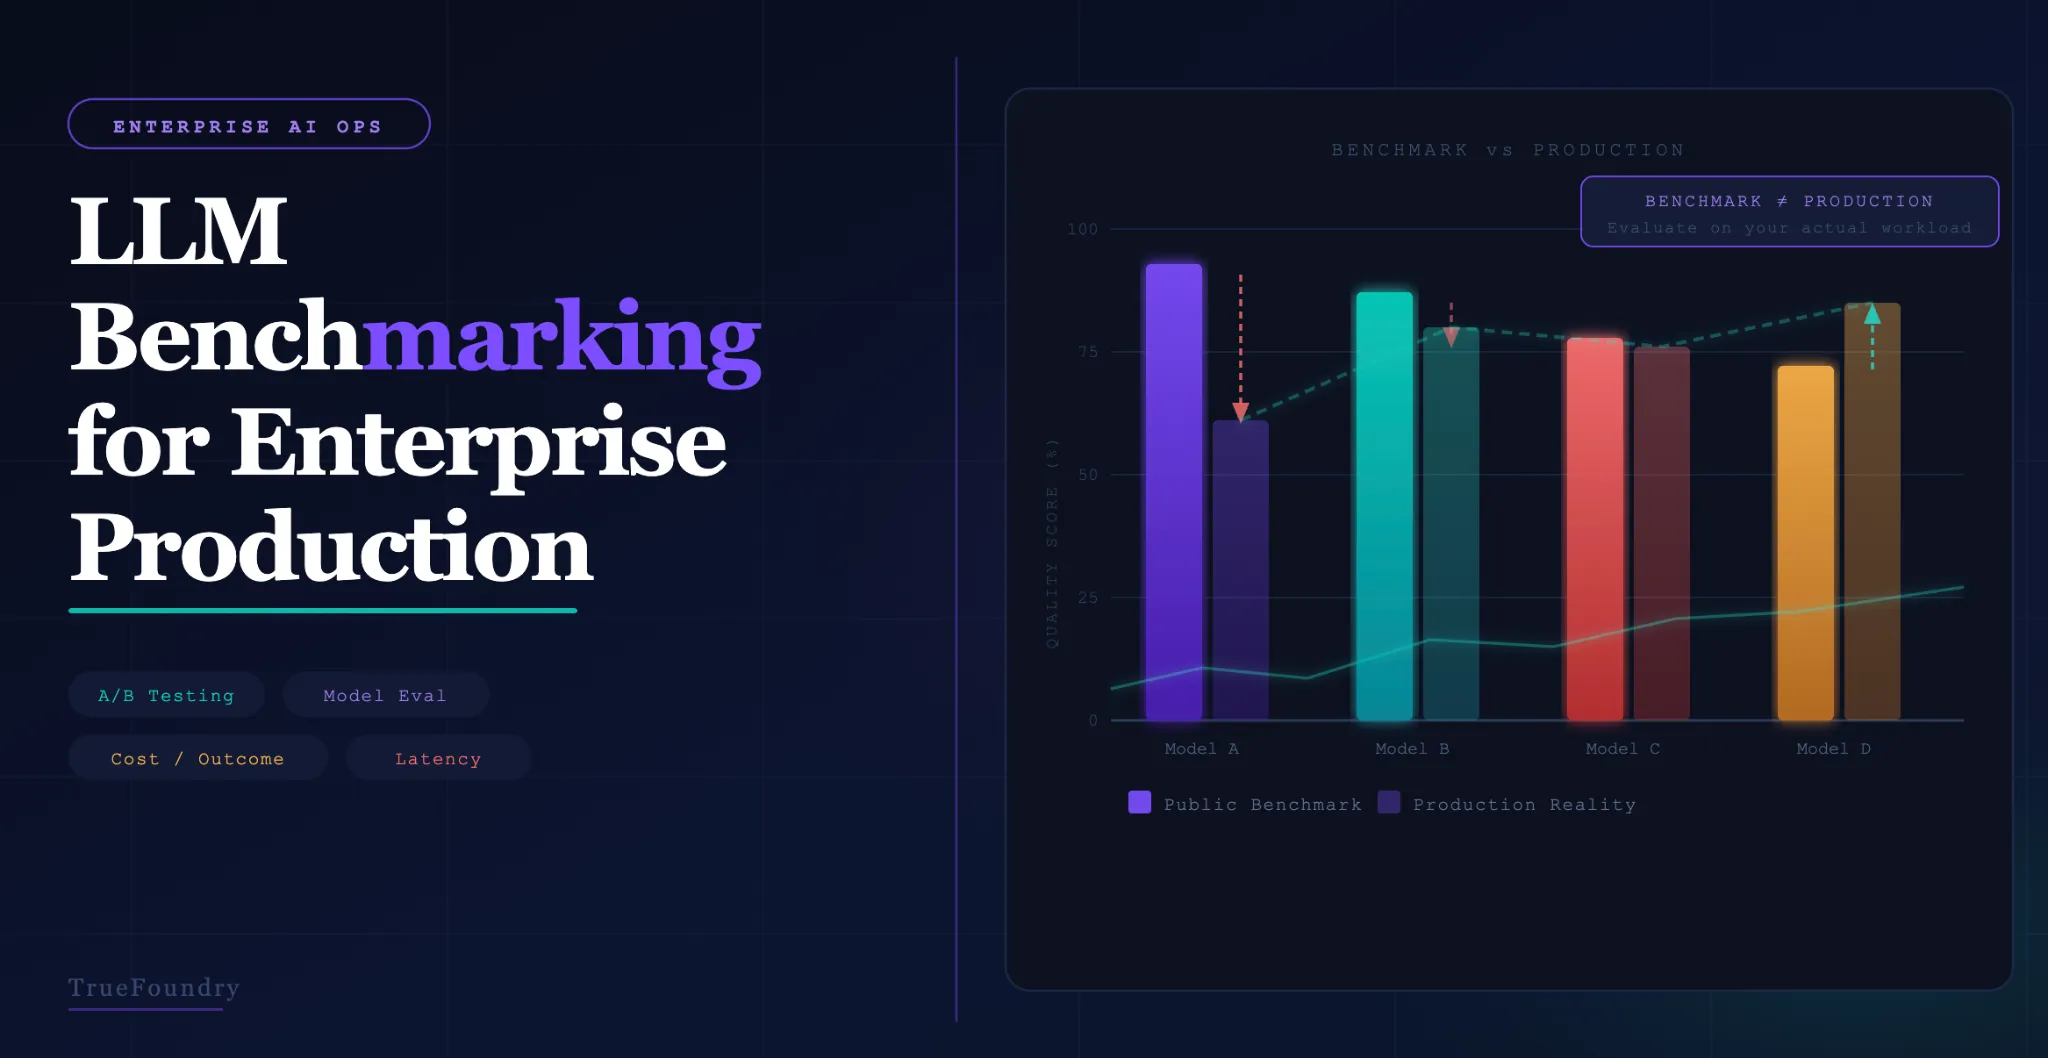
Public LLM benchmarks measure what AI researchers care about: graduate-level reasoning, code generation on canonical problems, multilingual translation quality. Useful for capability framing in the abstract. Frequently misleading when used to make enterprise procurement decisions, because the benchmark measures a distribution of tasks that probably shares almost nothing with your specific workload. A model that ranks first on MMLU can produce worse results than a cheaper model on your document-summarization workload, simply because your documents have different characteristics than the benchmark's test set.
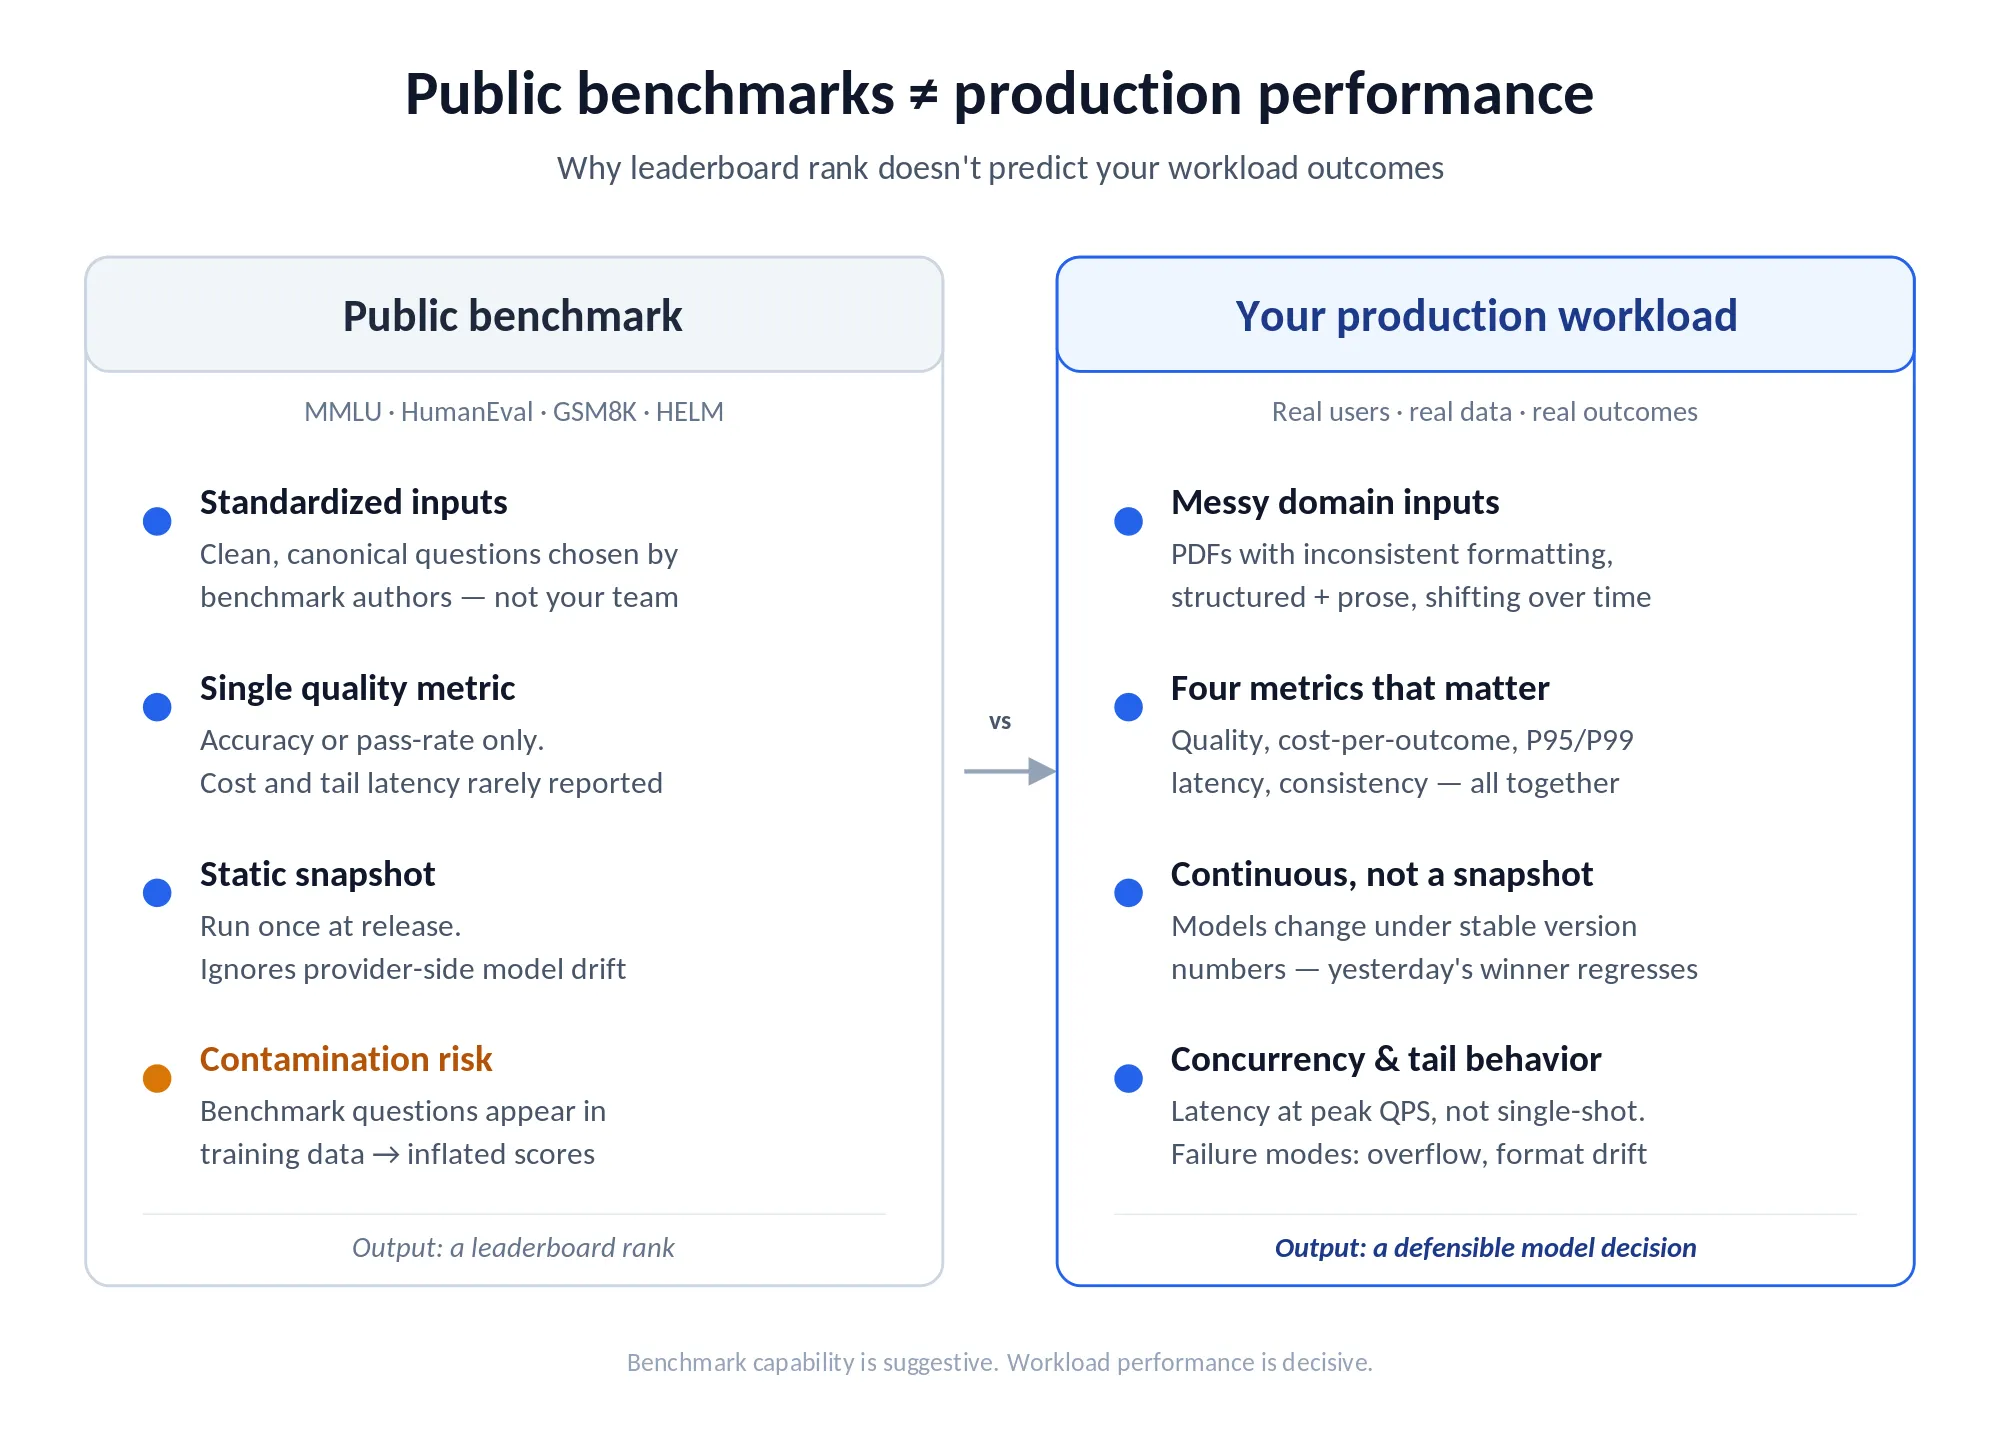
The gap between public benchmark performance and production performance isn't a minor calibration issue. It's structural. Benchmarks use standardized, clean data. Production data is messy. Domain-specific. Following distributions benchmark designers didn't anticipate. Benchmarks measure accuracy on canonical tasks. Production systems have to satisfy organizational requirements for output format, tone, and consistency that no public benchmark captures. And benchmarks are static snapshots, while production performance changes as model providers update their models and your data distribution evolves.
This guide covers how to build an enterprise LLM evaluation framework that generates meaningful signal for model-selection and optimization decisions. It covers the four benchmark dimensions that predict production performance, how to construct a test dataset that reflects your actual workload, how to run A/B tests in production without disrupting users, and how to automate model switching so the gateway routes to the best model per request without engineering intervention. TrueFoundry's AI Gateway makes traffic-splitting A/B tests in production straightforward to configure and monitor.
Stop guessing which model performs best for your use case. Benchmark it in production.
TrueFoundry's AI Gateway handles production traffic splitting, outcome logging, and automatic rollback for live model A/B tests. Book a demo to see how to run your first benchmark in under 30 minutes.
Why Public Benchmarks Are Unreliable for Enterprise Production Decisions
Public benchmark scores are the most frequently cited, and most frequently misused, data in enterprise LLM procurement. They show up in vendor decks, board memos, and procurement spreadsheets. Treated as ground truth. Understanding why they generally fail to predict production performance is the prerequisite for investing engineering time in benchmark-driven model selection.
Benchmark contamination inflates scores. Large language models train on enormous quantities of internet text, which increasingly includes benchmark questions and answers. Models that have seen benchmark content during training score higher than their genuine capability on novel data would predict. The extent of contamination is rarely disclosed and is hard to measure externally. Treating published scores as ground truth overstates the gap between top-ranked models and tells you very little about how they'll handle your inputs.
Academic tasks don't match enterprise workloads. MMLU measures performance on graduate-level knowledge questions across 57 subjects. HumanEval measures code generation on canonical programming problems. Neither measures what enterprise teams actually deploy models for: structured-data extraction from PDFs with inconsistent formatting, generating consistent JSON output from natural-language instructions, summarizing domain-specific technical content without hallucinating terminology, maintaining conversation context across a 20-turn customer-service interaction.
Cost-efficiency is invisible in accuracy-focused benchmarks. A model that scores 95% on a benchmark but averages 4,000 tokens to complete your typical task can have worse cost-per-outcome than a model scoring 88% that averages 1,800 tokens per task. Cost-per-outcome, what it actually costs to produce an acceptable output for your use case, is almost never reported in public benchmarks. It's also frequently the most important metric for enterprise budget planning.
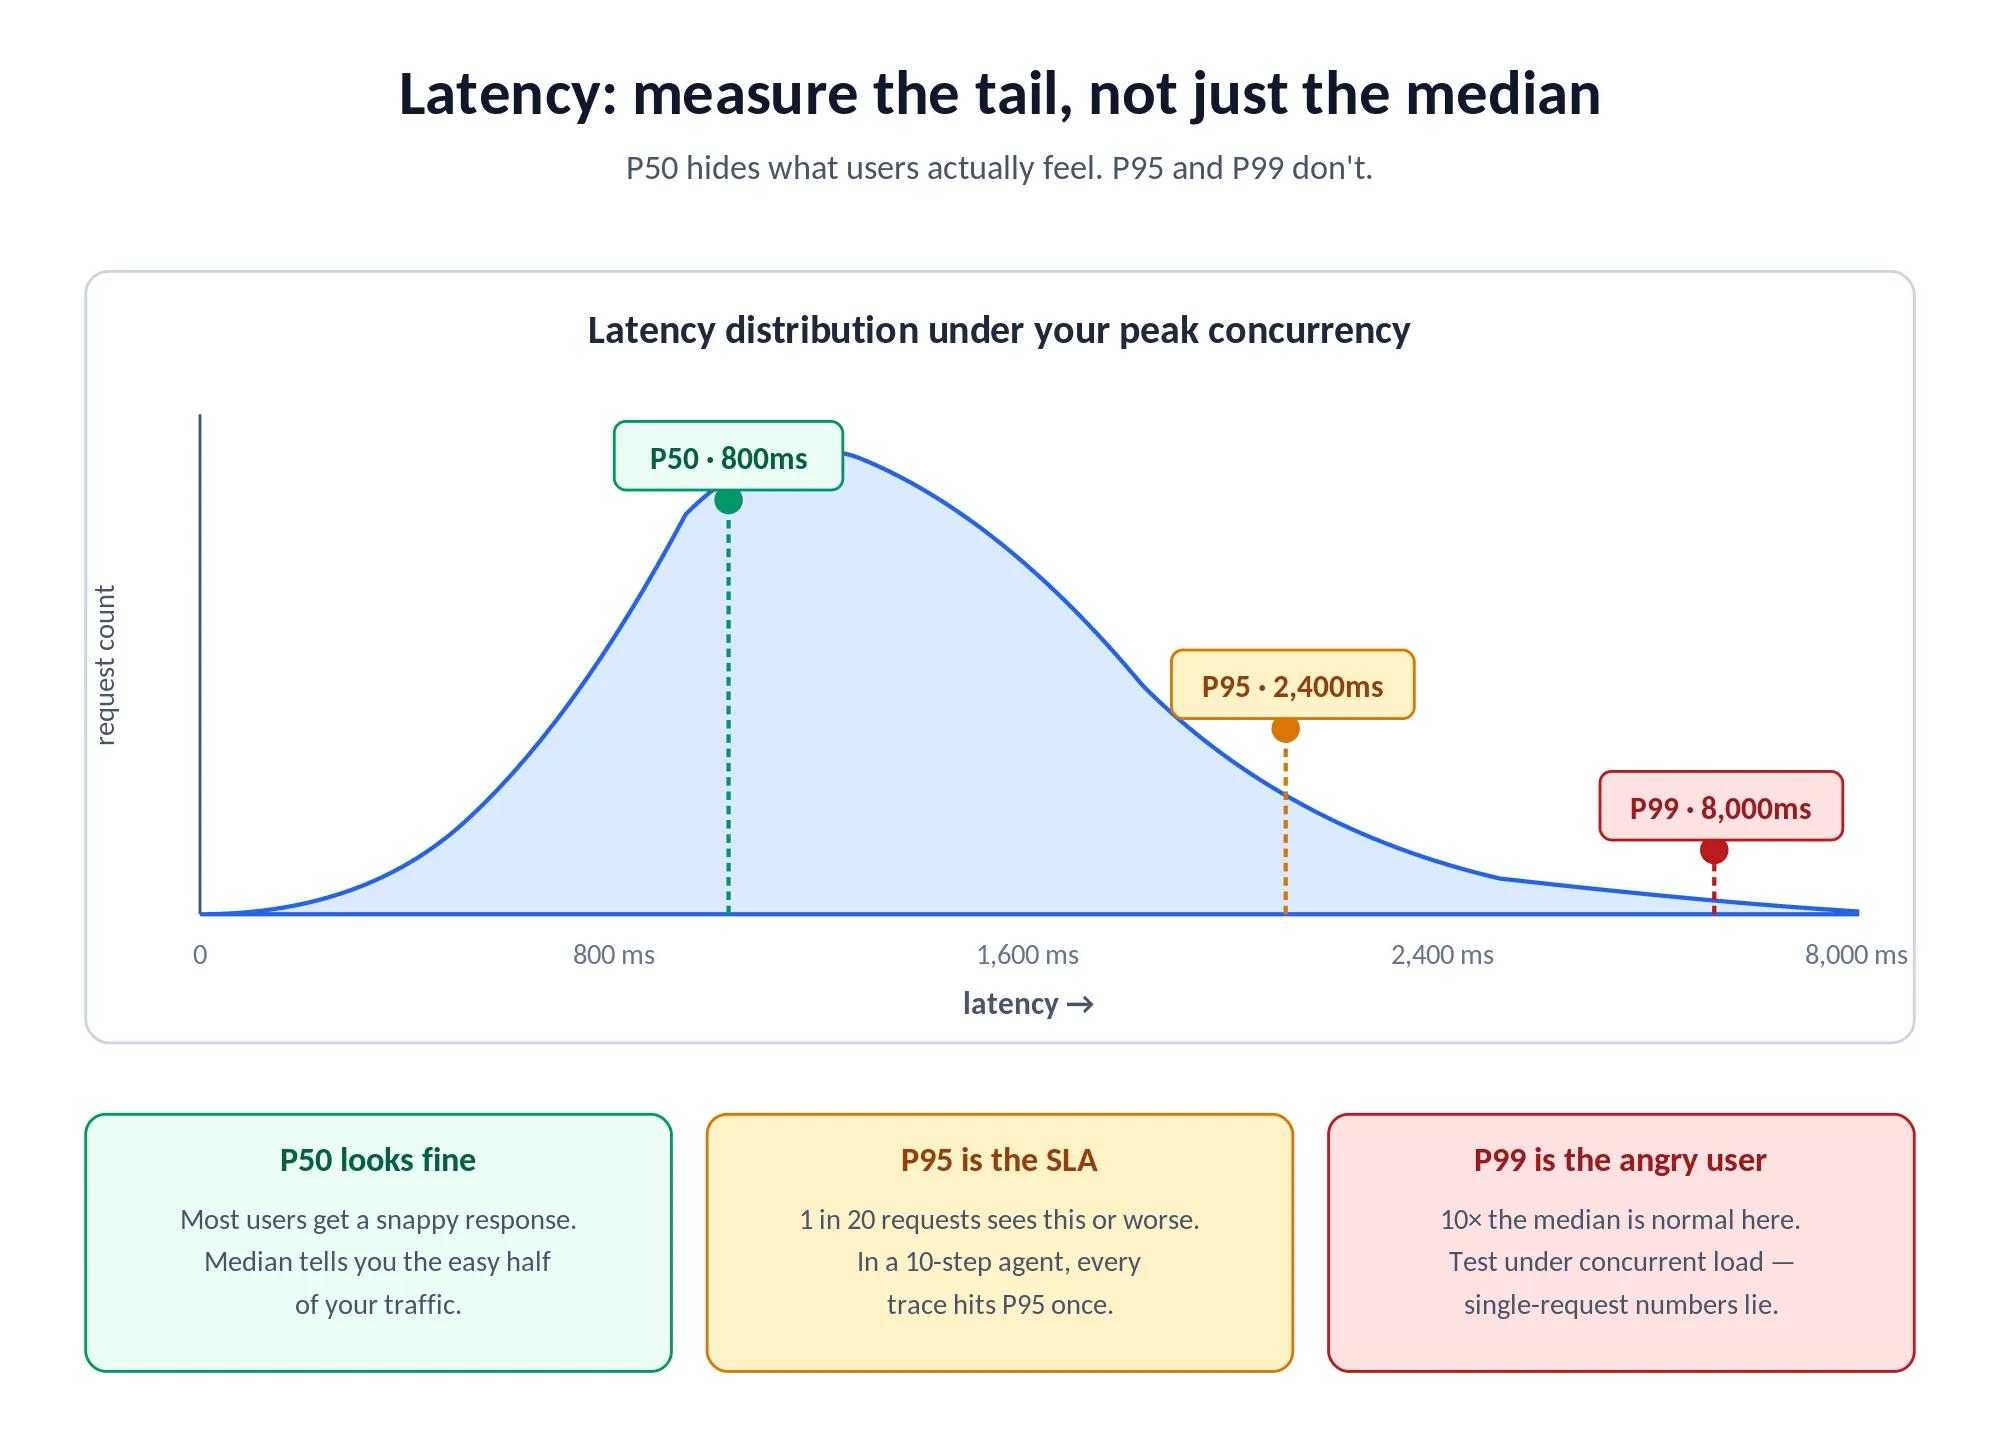
Benchmark latency numbers don't apply to your environment. Published latency figures for model APIs are measured under specific conditions: request size, concurrency level, and infrastructure that may differ significantly from yours. A model that shows 800ms median latency in benchmark conditions can deliver 2,400ms P95 latency under your production concurrent volume. That's a meaningfully different user experience.
Models change under stable version numbers. Providers update model behavior without always issuing new version numbers or prominently communicating changes. A model that performed well on your internal benchmark three months ago may behave differently today if the provider has updated its fine-tuning, system-prompt handling, or output filtering. Production benchmarking has to be continuous, not a one-time exercise at model-selection time.
The Four Dimensions of Enterprise LLM Benchmarking
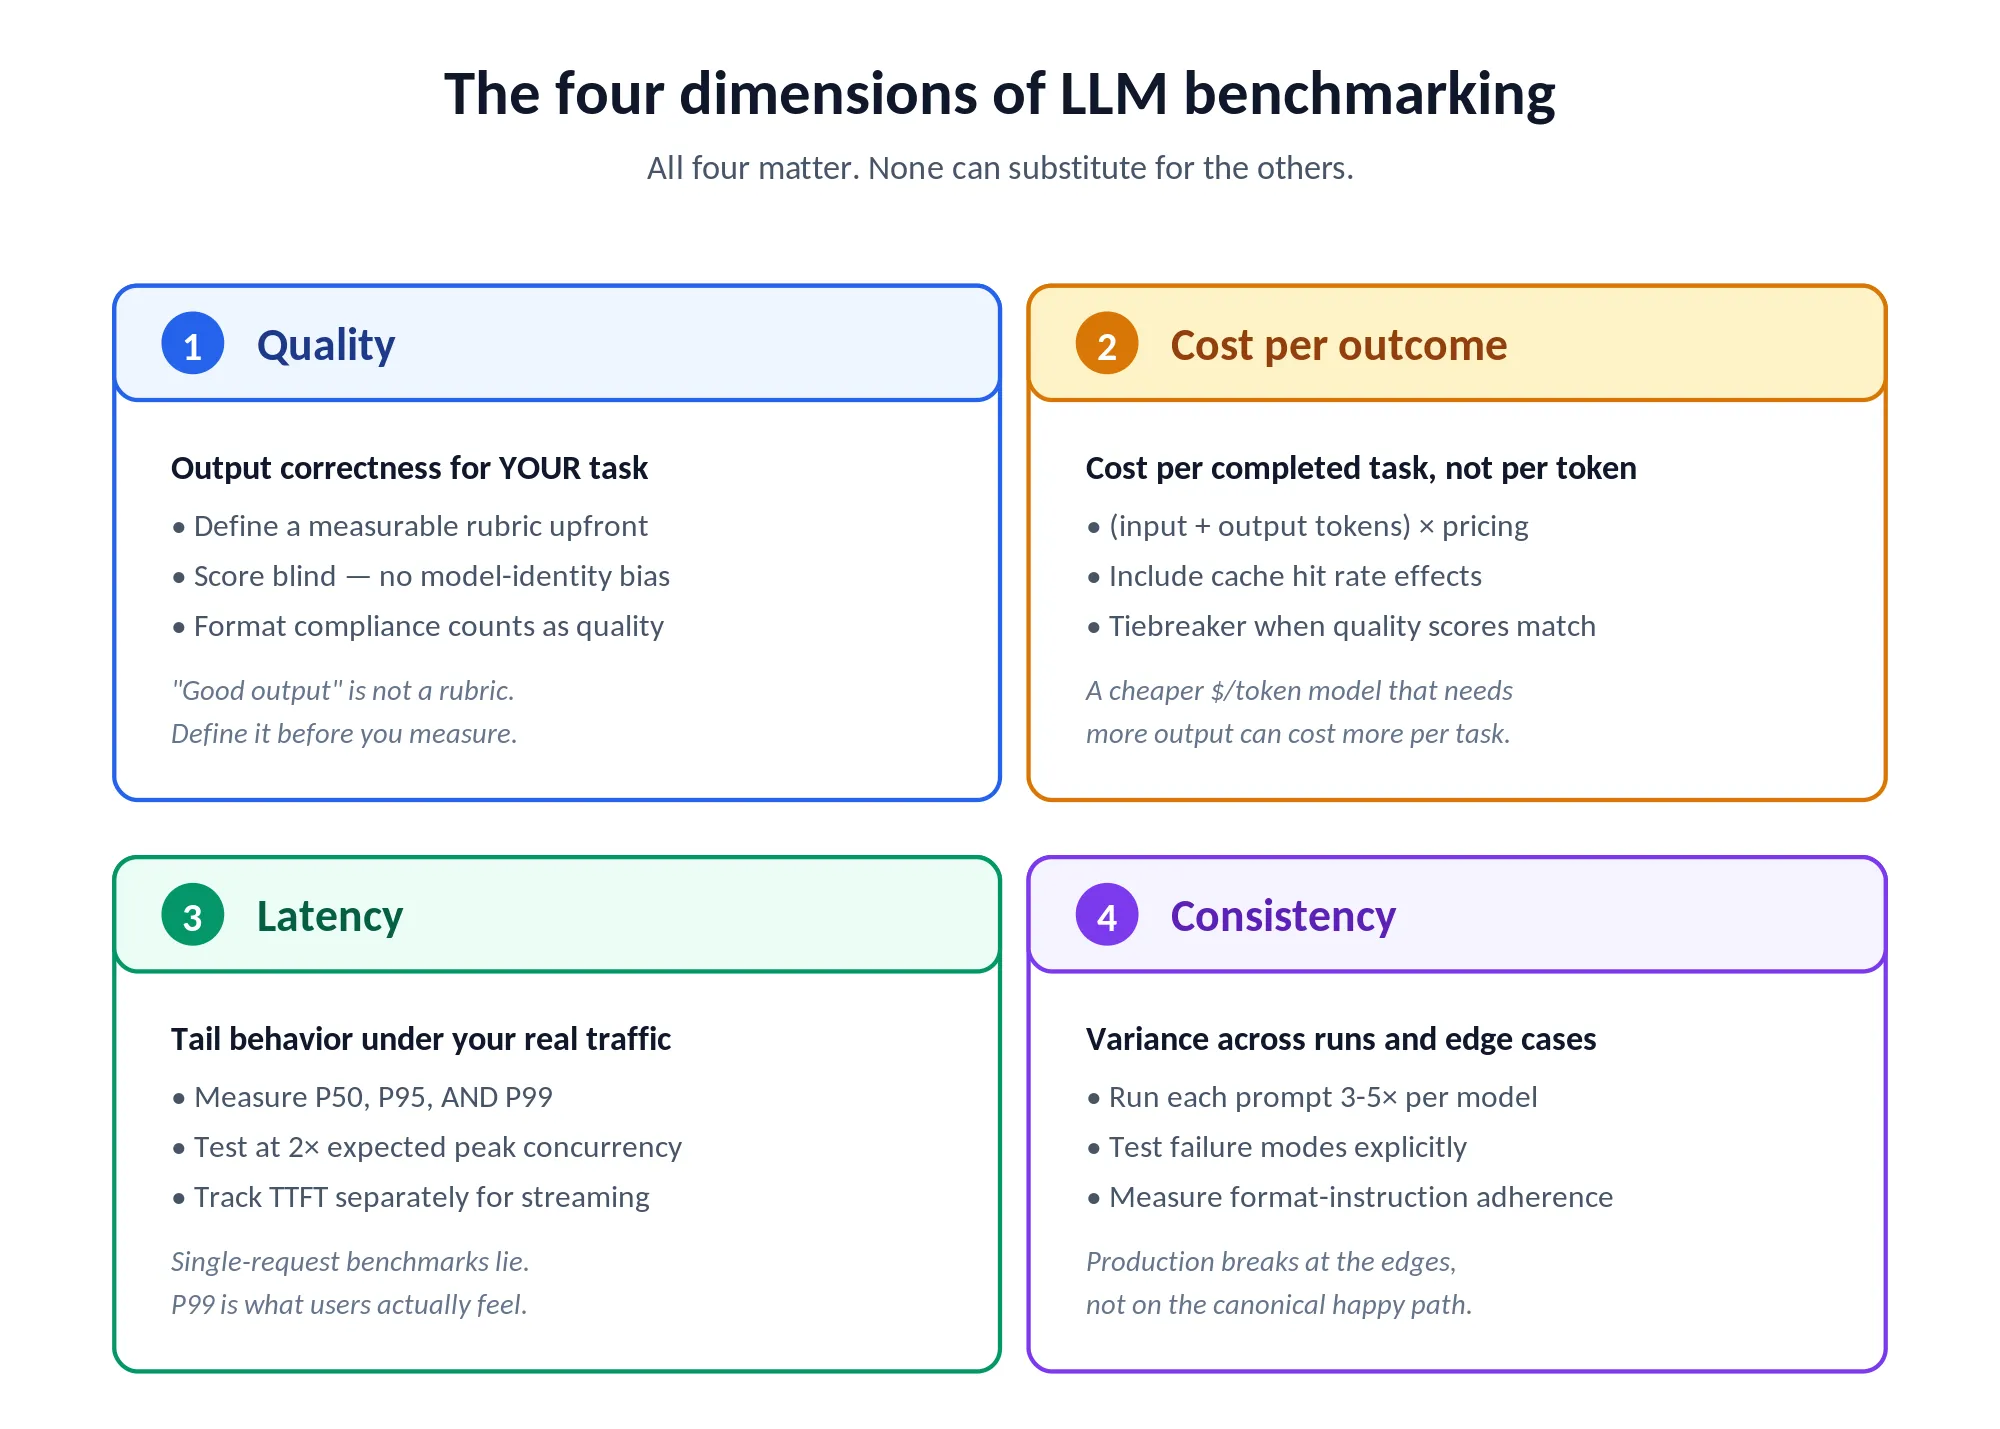
A useful enterprise LLM benchmark covers four distinct dimensions. They aren't independent. A model that excels on quality while failing on cost-per-outcome can still be the wrong choice if the cost differential isn't justified by the quality improvement. All four have to be measured. And traded off explicitly.
Dimension 1: Output Quality for Your Specific Task
Define task-specific quality criteria before running any evaluations. Quality criteria have to be measurable, either by human evaluators using a defined rubric, by an automated judge model with specified criteria, or by objective metrics where they exist (code: test pass rate; structured extraction: field accuracy; classification: precision and recall against a labeled set). Vague criteria like “good output” produce evaluations that aren't reproducible and can't justify a vendor decision.
Build a scoring rubric that can be applied consistently across all models under evaluation. For document summarization, a rubric might cover factual accuracy (does the summary contain claims unsupported by the source?), coverage (does it include all key points?), appropriate length (within the target word-count range?), and format compliance (does it follow the required output structure?). Each criterion should score independently so models can be compared per dimension, not just on overall.
Run quality evaluation blind. Evaluators or judge models shouldn't know which model produced which output. Model-identity bias is real: evaluators who know they're reading GPT-4 output score it higher on average than identical text without that label. Blind evaluation gives you scores that reflect actual quality rather than reputation effects.
Dimension 2: Cost Per Outcome
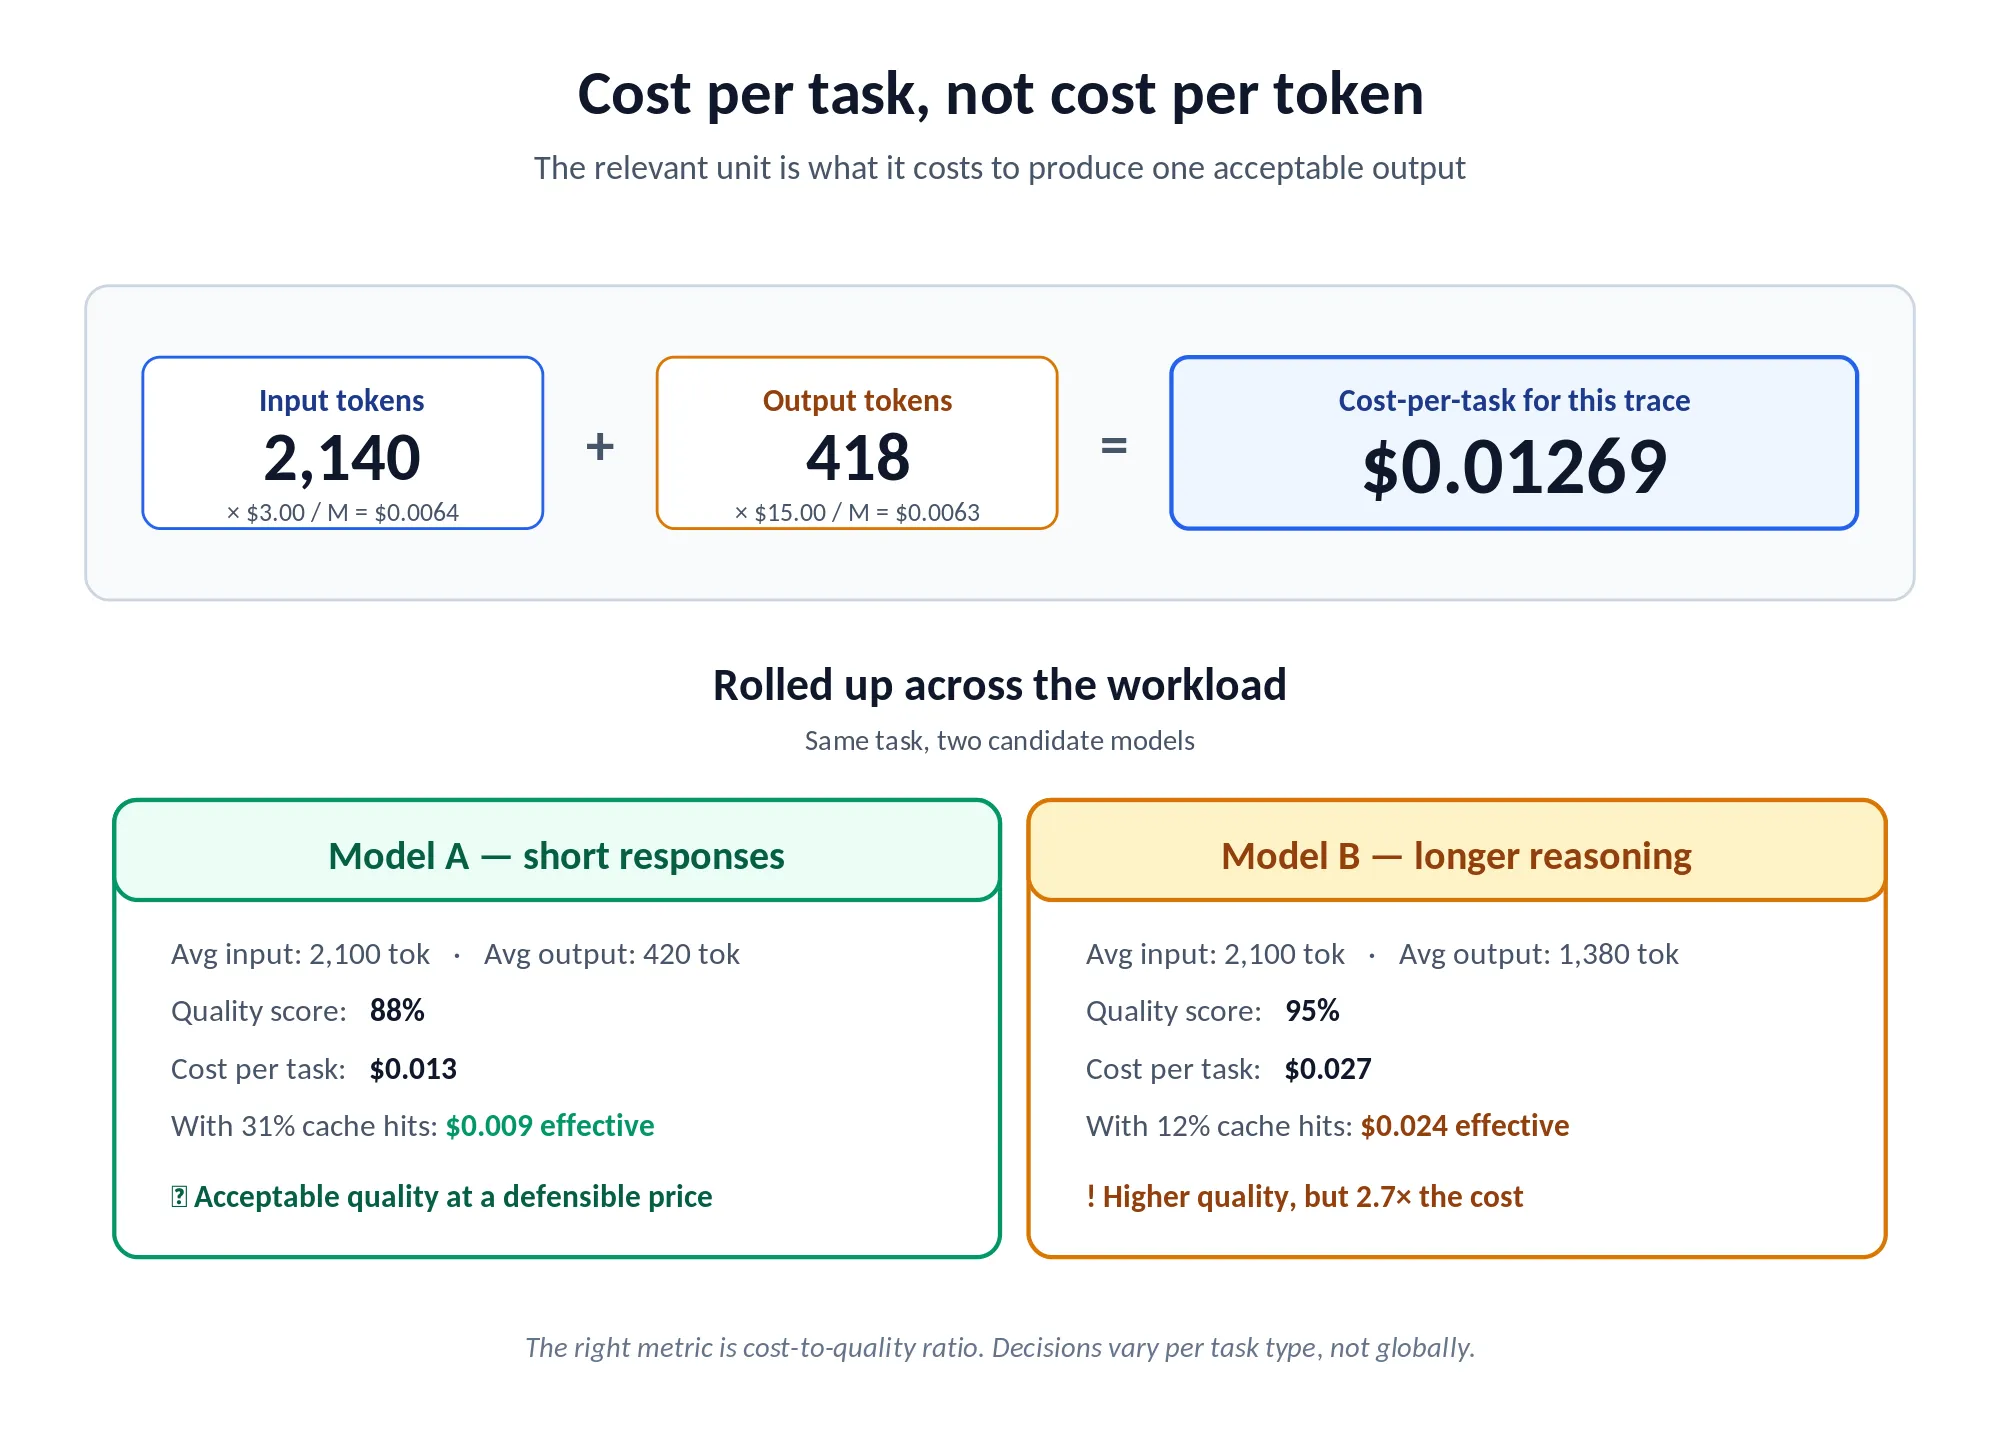
Cost per 1,000 tokens is a misleading standalone metric. The relevant unit is cost per completed task. The total cost (input tokens + output tokens, at the model's pricing) to produce an acceptable output for your typical use case. A premium model priced at, say, $3 per million input tokens and $15 per million output tokens might be more or less cost-efficient than a nominally cheaper model that needs longer responses to hit equivalent quality. The math depends entirely on your task length distribution. Always pull current per-token rates from each provider's pricing page on the day you run the comparison; the numbers shift quarterly.
Compute cost per completed task by measuring the average prompt length (input tokens) and average response length (output tokens) for your test dataset on each model, then multiplying by per-token prices. When quality scores are close, cost-per-task is the tiebreaker. When quality differences are real, the cost-to-quality ratio (extra cost per percentage point of quality improvement) determines whether the premium model is worth the price.
Include cache effects in cost-per-outcome. TrueFoundry's semantic cache returns previously generated responses for semantically similar requests, scored by cosine similarity over an embedding of the last user message. Cache hits return zero model cost, so the effective per-request spend depends on your hit rate. If 35% of your requests hit cache, cost-per-outcome is materially different from the per-token math, and ignoring this can flip a model comparison.
Dimension 3: Latency Under Your Actual Traffic Pattern
Measure latency at P50, P95, and P99, not just median. Enterprise applications need to know the worst case users will see, not just the typical experience. A model with excellent P50 but 8-second P99 makes interactive use unacceptable even if the median looks fine. TrueFoundry's metrics dashboard exposes P50, P75, P90, and P99 selectors on Request Latency, Time To First Token (TTFT), Inter Token Latency (ITL), and Time Per Output Token (TPOT). All four metrics are surfaced because each one tells you something different.
Load-test under your expected concurrent request volume, not under single-request conditions. Most models look great in isolation and degrade significantly under the concurrent loads that production applications generate. TrueFoundry ships an LLM Benchmarking Tool in the Application Catalog that lets you configure peak concurrency, ramp-up rate, prompt size distribution, and max output tokens. It plots requests per second, response time, TTFT, and inter-token latency. Run it against any OpenAI-compatible endpoint, including TF-deployed models, external providers via API key, or any model behind your AI Gateway. Test at roughly 2× your expected peak concurrency to give yourself a meaningful capacity margin.
Track TTFT separately from total generation time for streaming use cases. Applications that stream model output to users experience TTFT as “perceived latency”, the time before anything appears on screen. A model with longer total generation but lower TTFT can deliver a better experience than a technically faster model with a slow first token. TPOT (total time divided by output tokens) is the single number that captures full generation speed and is what TrueFoundry's latency-based routing uses to pick the fastest target.
Dimension 4: Consistency and Reliability
Run every prompt in your test dataset three to five times across multiple sessions to measure output variance. Some models produce dramatically different outputs for the same input across runs: different factual claims, different output structures, different coverage of the required points. High variance creates downstream problems for parsing, structured-data extraction, and user-experience consistency.
Test failure-mode behavior explicitly. What does the model return when input exceeds its context window? What happens when content policy triggers on a borderline input? Does it follow explicit format instructions reliably, or does it sometimes drop into free-form responses when structured output was required? These failure modes are mostly absent from public benchmarks, but they're where production systems break.
Building a Representative Benchmark Dataset for Your Enterprise
The benchmark dataset is the most consequential component of an enterprise LLM evaluation. A well-designed dataset produces reliable predictions of production performance. A poorly designed one produces misleading results that lead to wrong selections. Dataset design deserves as much engineering investment as the evaluation methodology itself.
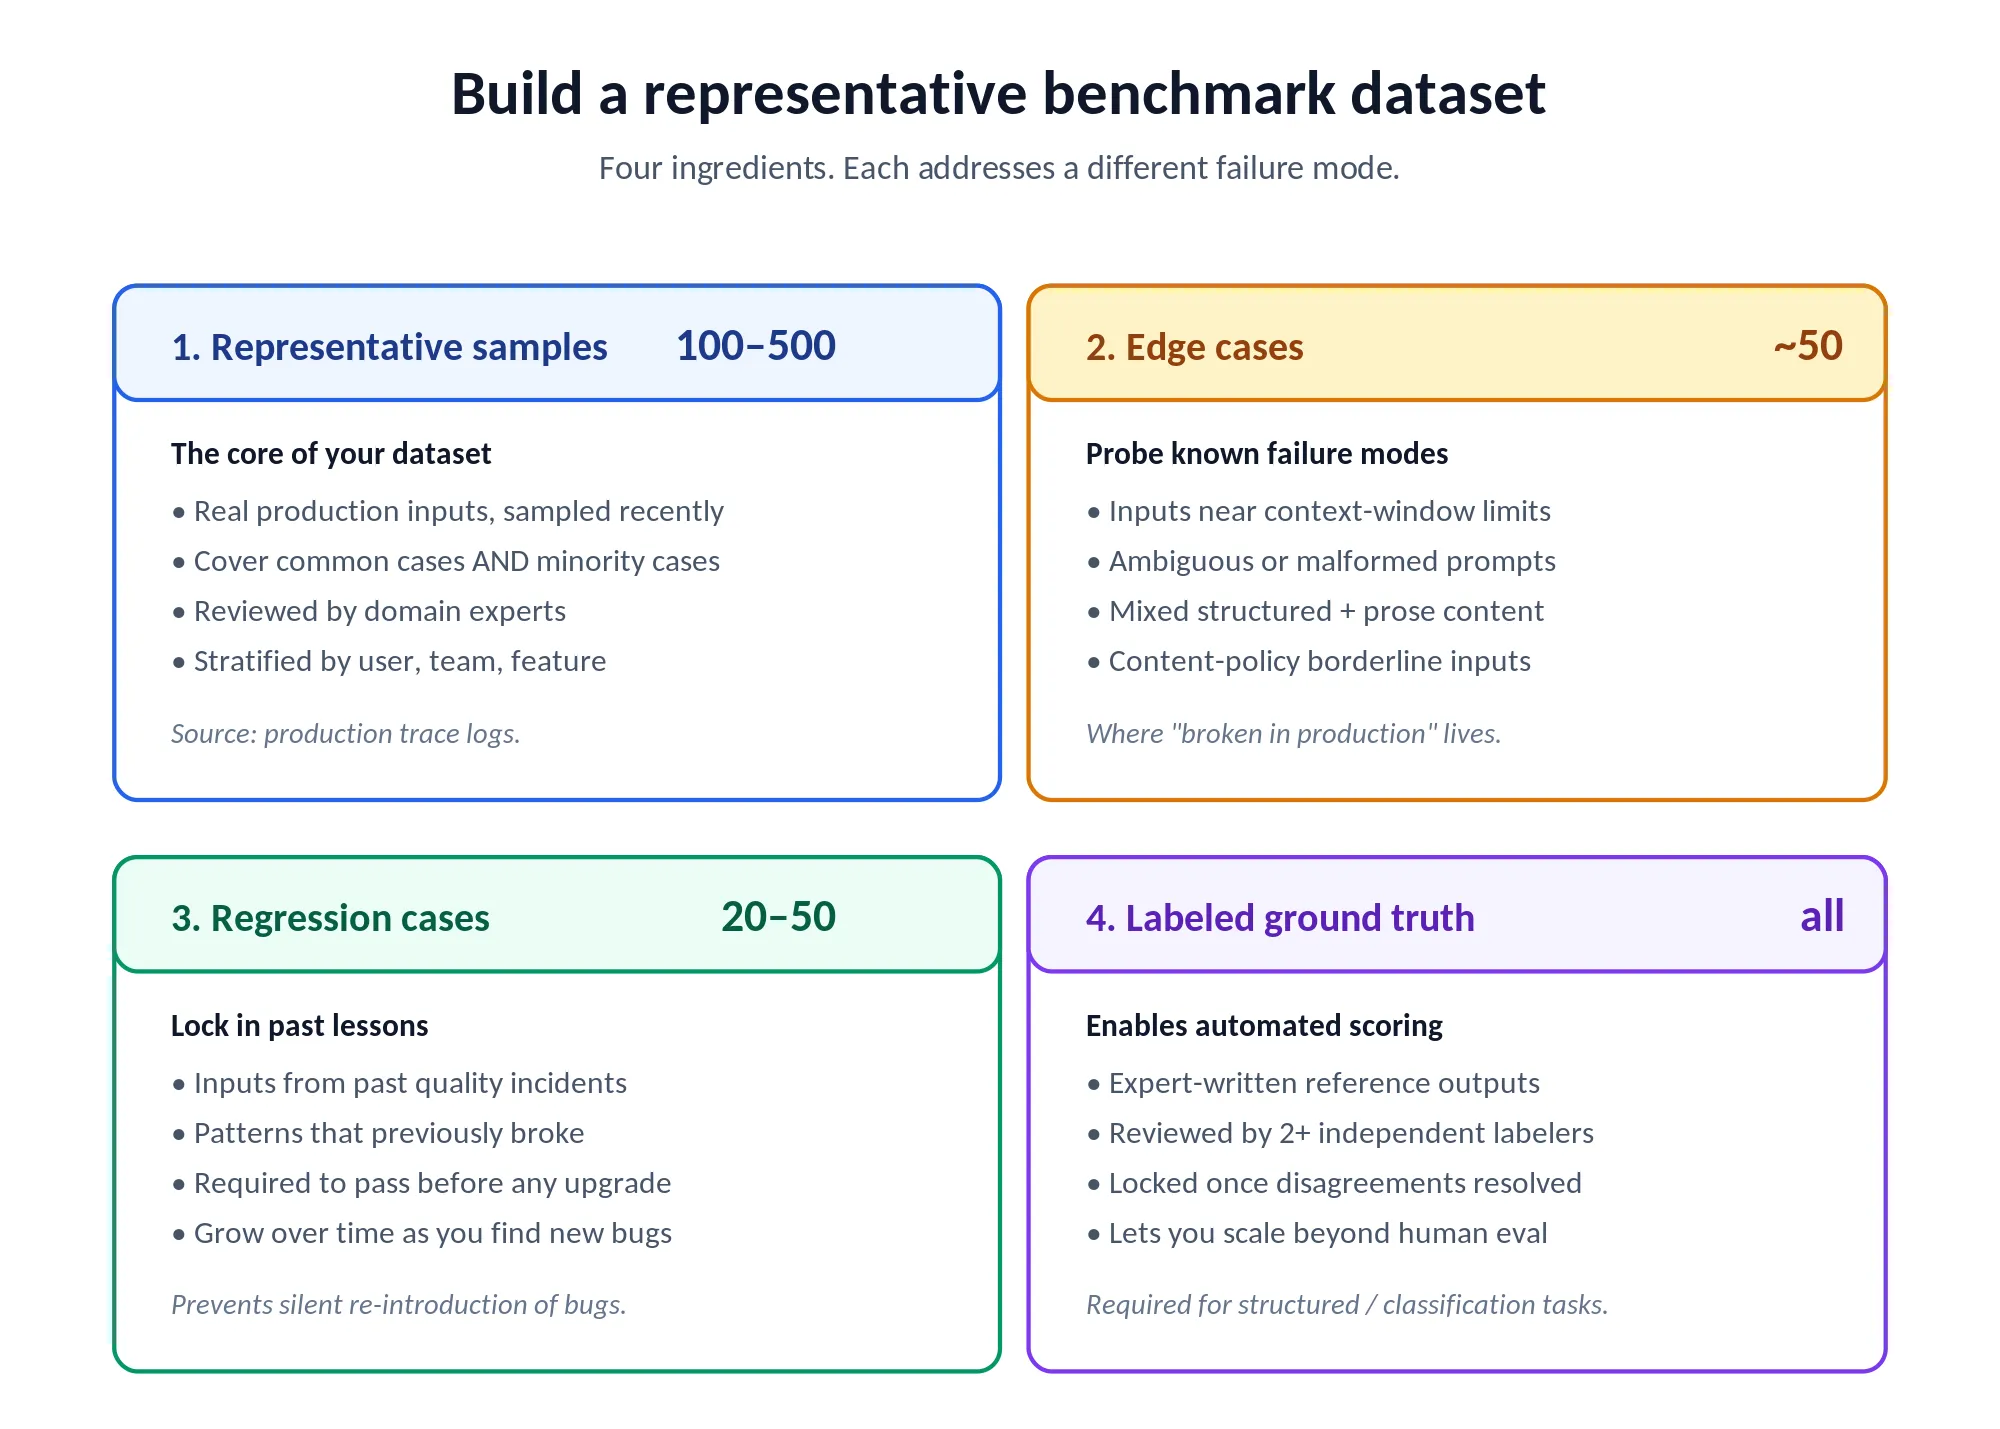
Representative samples form the core of the dataset. Collect 100 to 500 real examples from your production workload, manually reviewed by subject-matter experts to confirm they represent the actual distribution of inputs your system handles. Cover the full distribution: common cases, edge cases, the minority of inputs that are technically difficult or where quality requirements are most stringent. Samples should be drawn from recent production data to reflect current distributions, not historical data that may no longer be representative. If you've enabled tracing on your AI Gateway, the Query Spans API (via the TrueFoundry SDK) is probably the cleanest way to pull a stratified sample, filtering by user, team, virtual account, or any custom metadata key you've attached.
Edge cases probe known model failure modes. Design specific test inputs to surface them. For document processing: very long documents near context-window limits, documents with inconsistent formatting, documents with tables or structured data mixed with prose. For code generation: requests with ambiguous specifications, requests in uncommon frameworks, requests that require reasoning about security implications. For customer-facing applications: inputs with grammatical errors, inputs in non-standard language, content-policy borderline cases. The edge-case set is where the gap between “95% on benchmark” and “broken in production” lives.
Regression cases prevent capability regressions. Maintain a set of 20 to 50 examples drawn from past incidents: cases where your current model produced incorrect output, cases where a previous model upgrade caused quality regressions, cases where specific input patterns consistently caused problems. Any new model under evaluation has to pass the regression set before it's considered for production. This makes upgrades safer because you can't silently reintroduce previously solved problems.
Labeled ground truth enables automated scoring. For use cases where automated scoring is feasible (structured extraction, classification, code generation), include ground-truth labels created by human experts for every test case. Automated scoring against ground truth scales better than human evaluation for large test sets. Labels should be reviewed by at least two independent evaluators to resolve disagreements before being locked in as the evaluation standard.
Running Production A/B Tests: The Most Reliable Benchmark
Offline benchmarking on a test dataset is a necessary first step. The most reliable signal generally comes from production traffic. Real users generate a distribution of inputs that's reportedly more varied and more challenging than any manually curated test set. Production A/B testing, routing a percentage of live traffic to a new model while comparing outcomes against the current model, is what makes a model decision defensible.
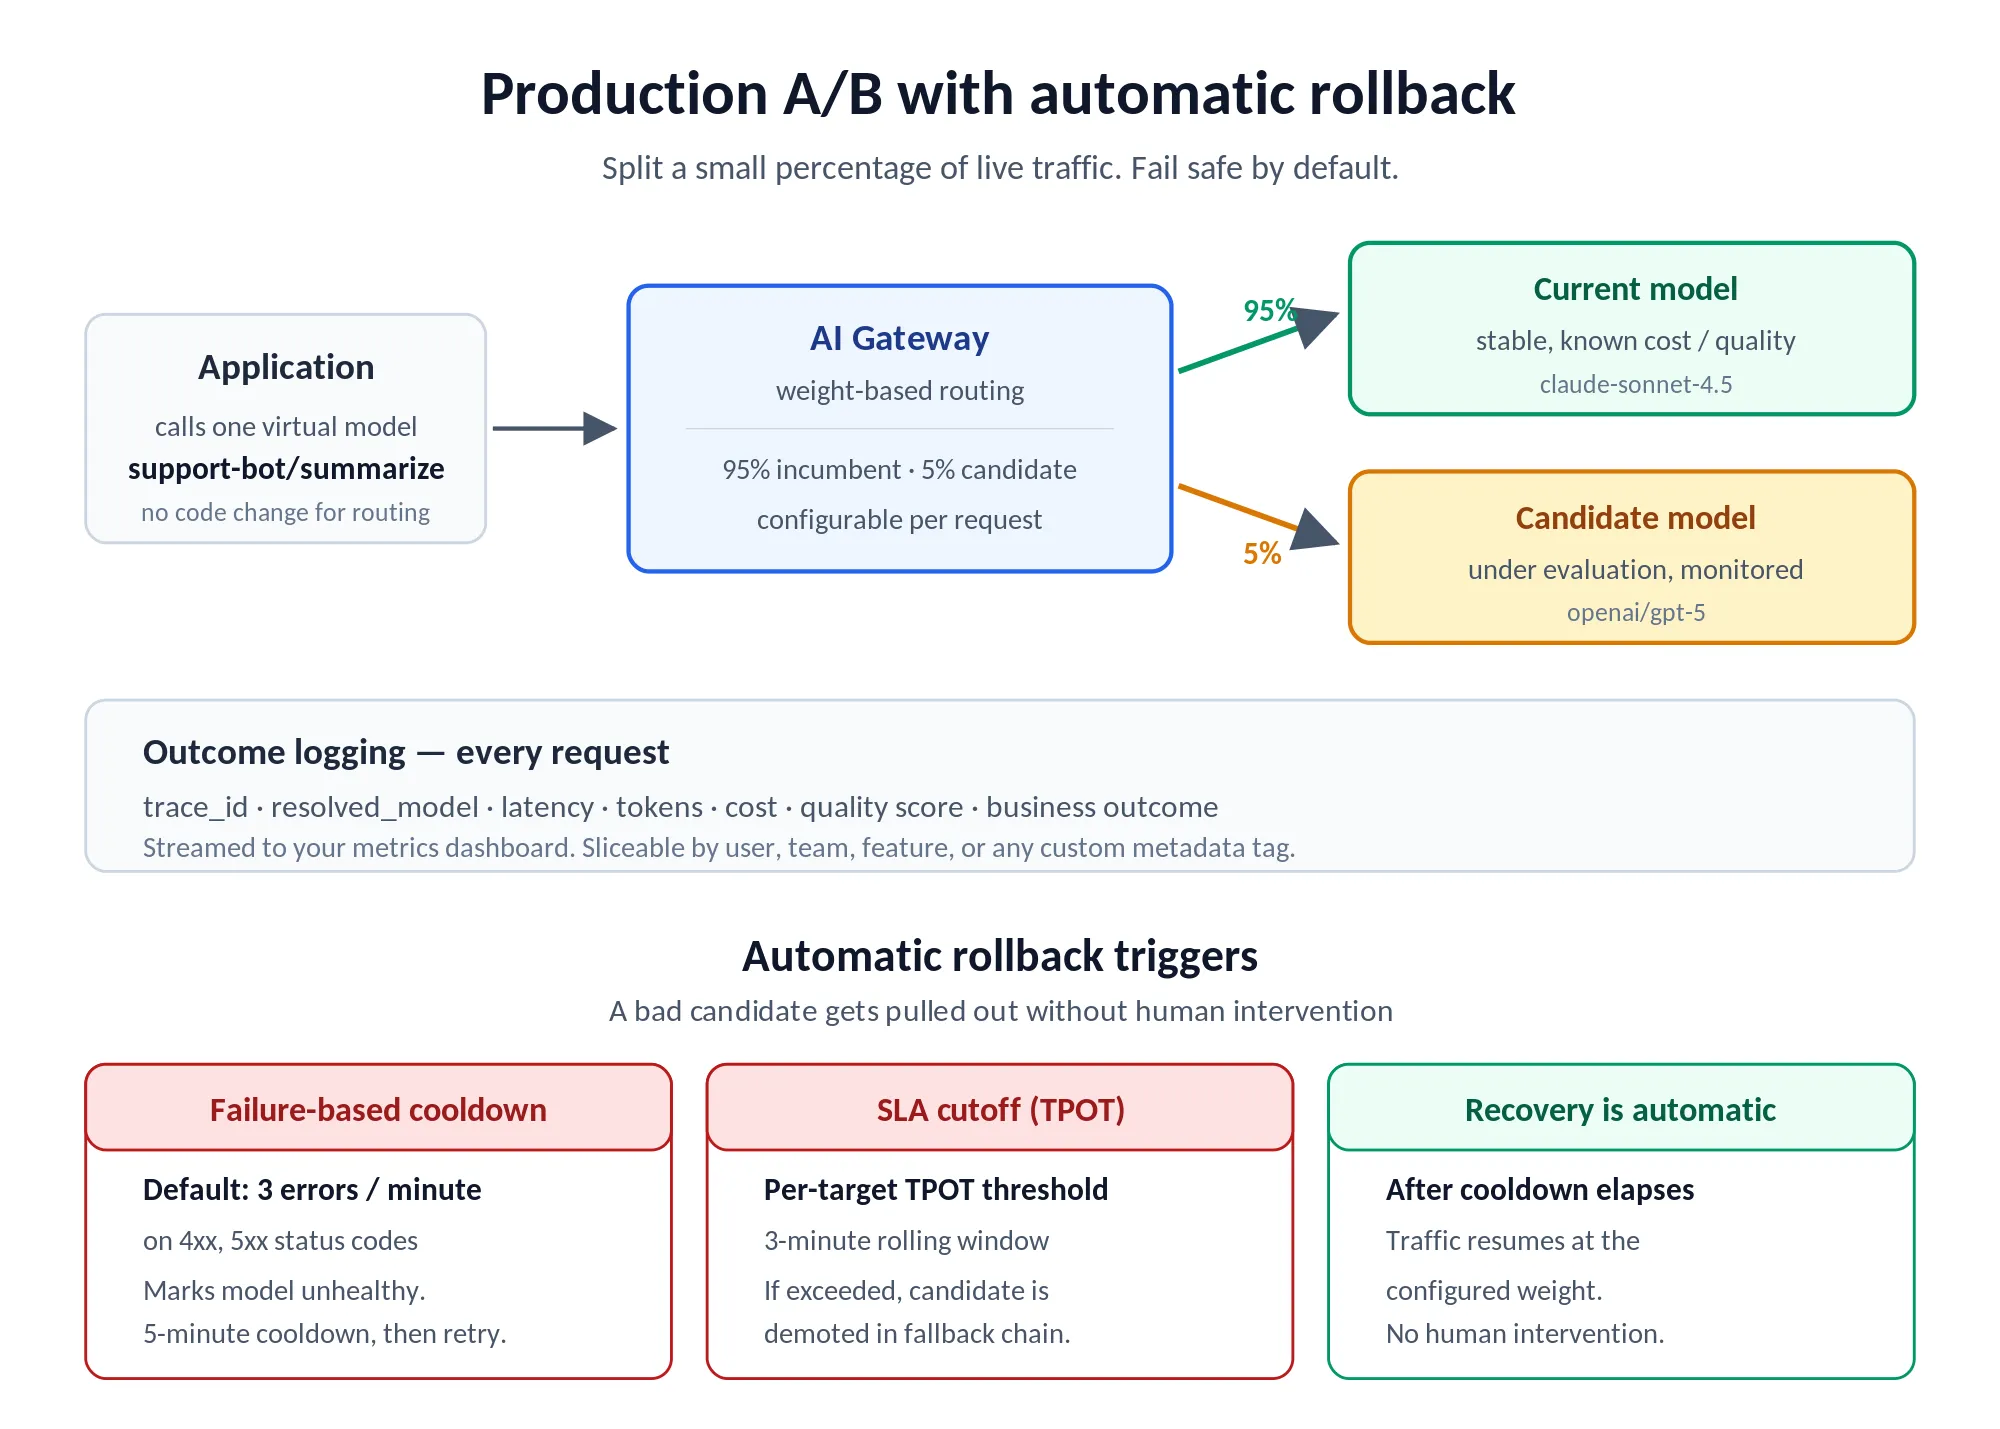
Start with 1-5% of production traffic. Route a small percentage of live requests to the candidate model while the rest stays on the current one. Monitor output quality, latency, cost, and error rate over a minimum of two weeks, long enough to capture the full distribution of your production inputs, including weekly patterns and edge cases that only appear occasionally. In TrueFoundry, this is a single field on a Virtual Model configuration: weight: 5 on the candidate, weight: 95 on the incumbent.
Define success criteria before the test starts. Articulate the specific conditions under which the new model will be accepted for full production deployment. Example: the new model has to achieve at least 97% of the current model's quality score at no more than 110% of the current model's cost-per-task, with P95 latency no worse than the current model. Pre-defined criteria prevent post-hoc rationalization where teams accept a worse-performing model because some other metrics happen to look good.
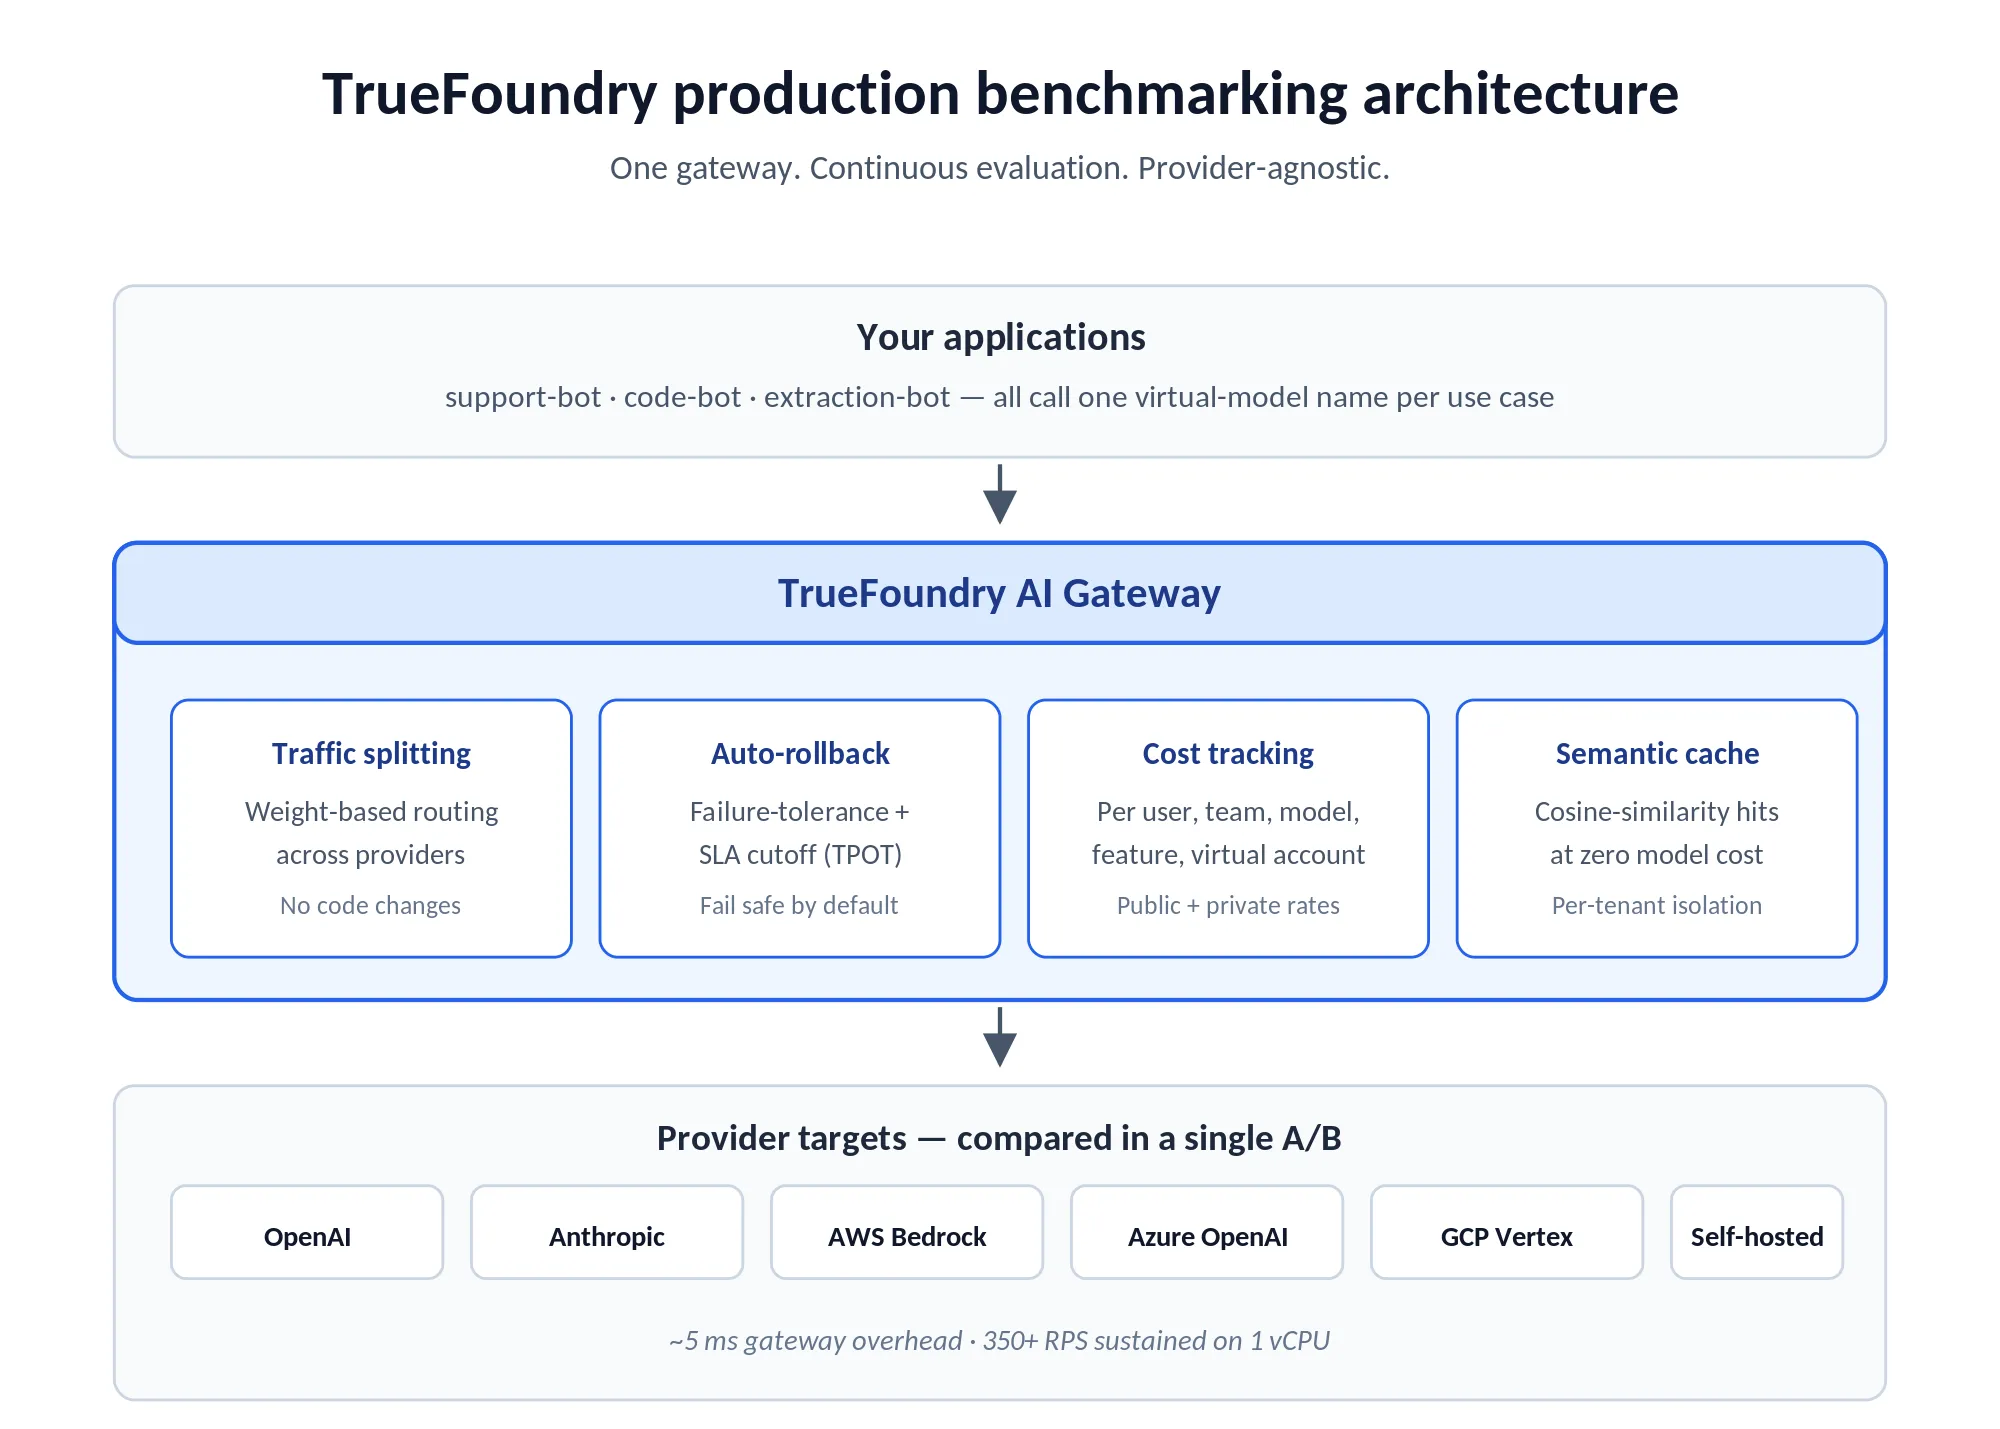
Use the AI Gateway routing layer for traffic splitting. Configure the gateway to split traffic between models by percentage without modifying any application code. The application sends a standard request to a virtual model name (something like support-bot/summarize), and the gateway decides which real model to use based on the configured split. This eliminates the engineering overhead of deploying model-specific code branches for evaluation. TrueFoundry's load-balancing config is declarative YAML, editable in the UI or pushed via the tfy CLI for GitOps workflows.
Set automatic rollback triggers. Configure conditions that automatically pull the candidate out of rotation: error-rate threshold, latency ceiling, quality-score floor. TrueFoundry's failure-tolerance config (allowed_failures_per_minute, cooldown_period_minutes, failure_status_codes) is set per-model, and a target that breaches the threshold gets marked unhealthy and excluded from routing for the duration of the cooldown. The load-balancing blog shows a typical config with three failures per minute triggering a five-minute cooldown on [429, 500, 502, 503, 504]. For latency, priority-based routing supports an SLA cutoff on TPOT: configure time_per_output_token_ms per target, and the gateway monitors a 3-minute rolling window with up to 10 samples (minimum 3) to decide whether the candidate is meeting your latency bar. Production A/B tests fail safe. The worst case is a small percentage of traffic served by a bad model before automatic recovery kicks in.
Log outcome metrics that go beyond technical signals. In addition to latency and error rate, log business outcome signals where measurable: did the user accept or reject the model's output? Did the agent task complete successfully? Did the customer-service interaction resolve in-session? These downstream metrics are more meaningful for model selection than technical quality alone, and they need application-level instrumentation to collect. TrueFoundry's custom metadata (sent via the X-TFY-METADATA header) lets you tag each request with feature, environment, customer ID, or whatever dimension your business cares about, and break down the metrics dashboard along that dimension later.
Automating Model Selection: Beyond Manual A/B Tests
The endpoint of a mature enterprise LLM evaluation program is removing model selection from the critical path of engineering decisions entirely. Instead of running manual A/B tests every time a new model ships, the gateway applies configured selection criteria automatically. Each request goes to whatever model probably produces the best outcome given current performance data.
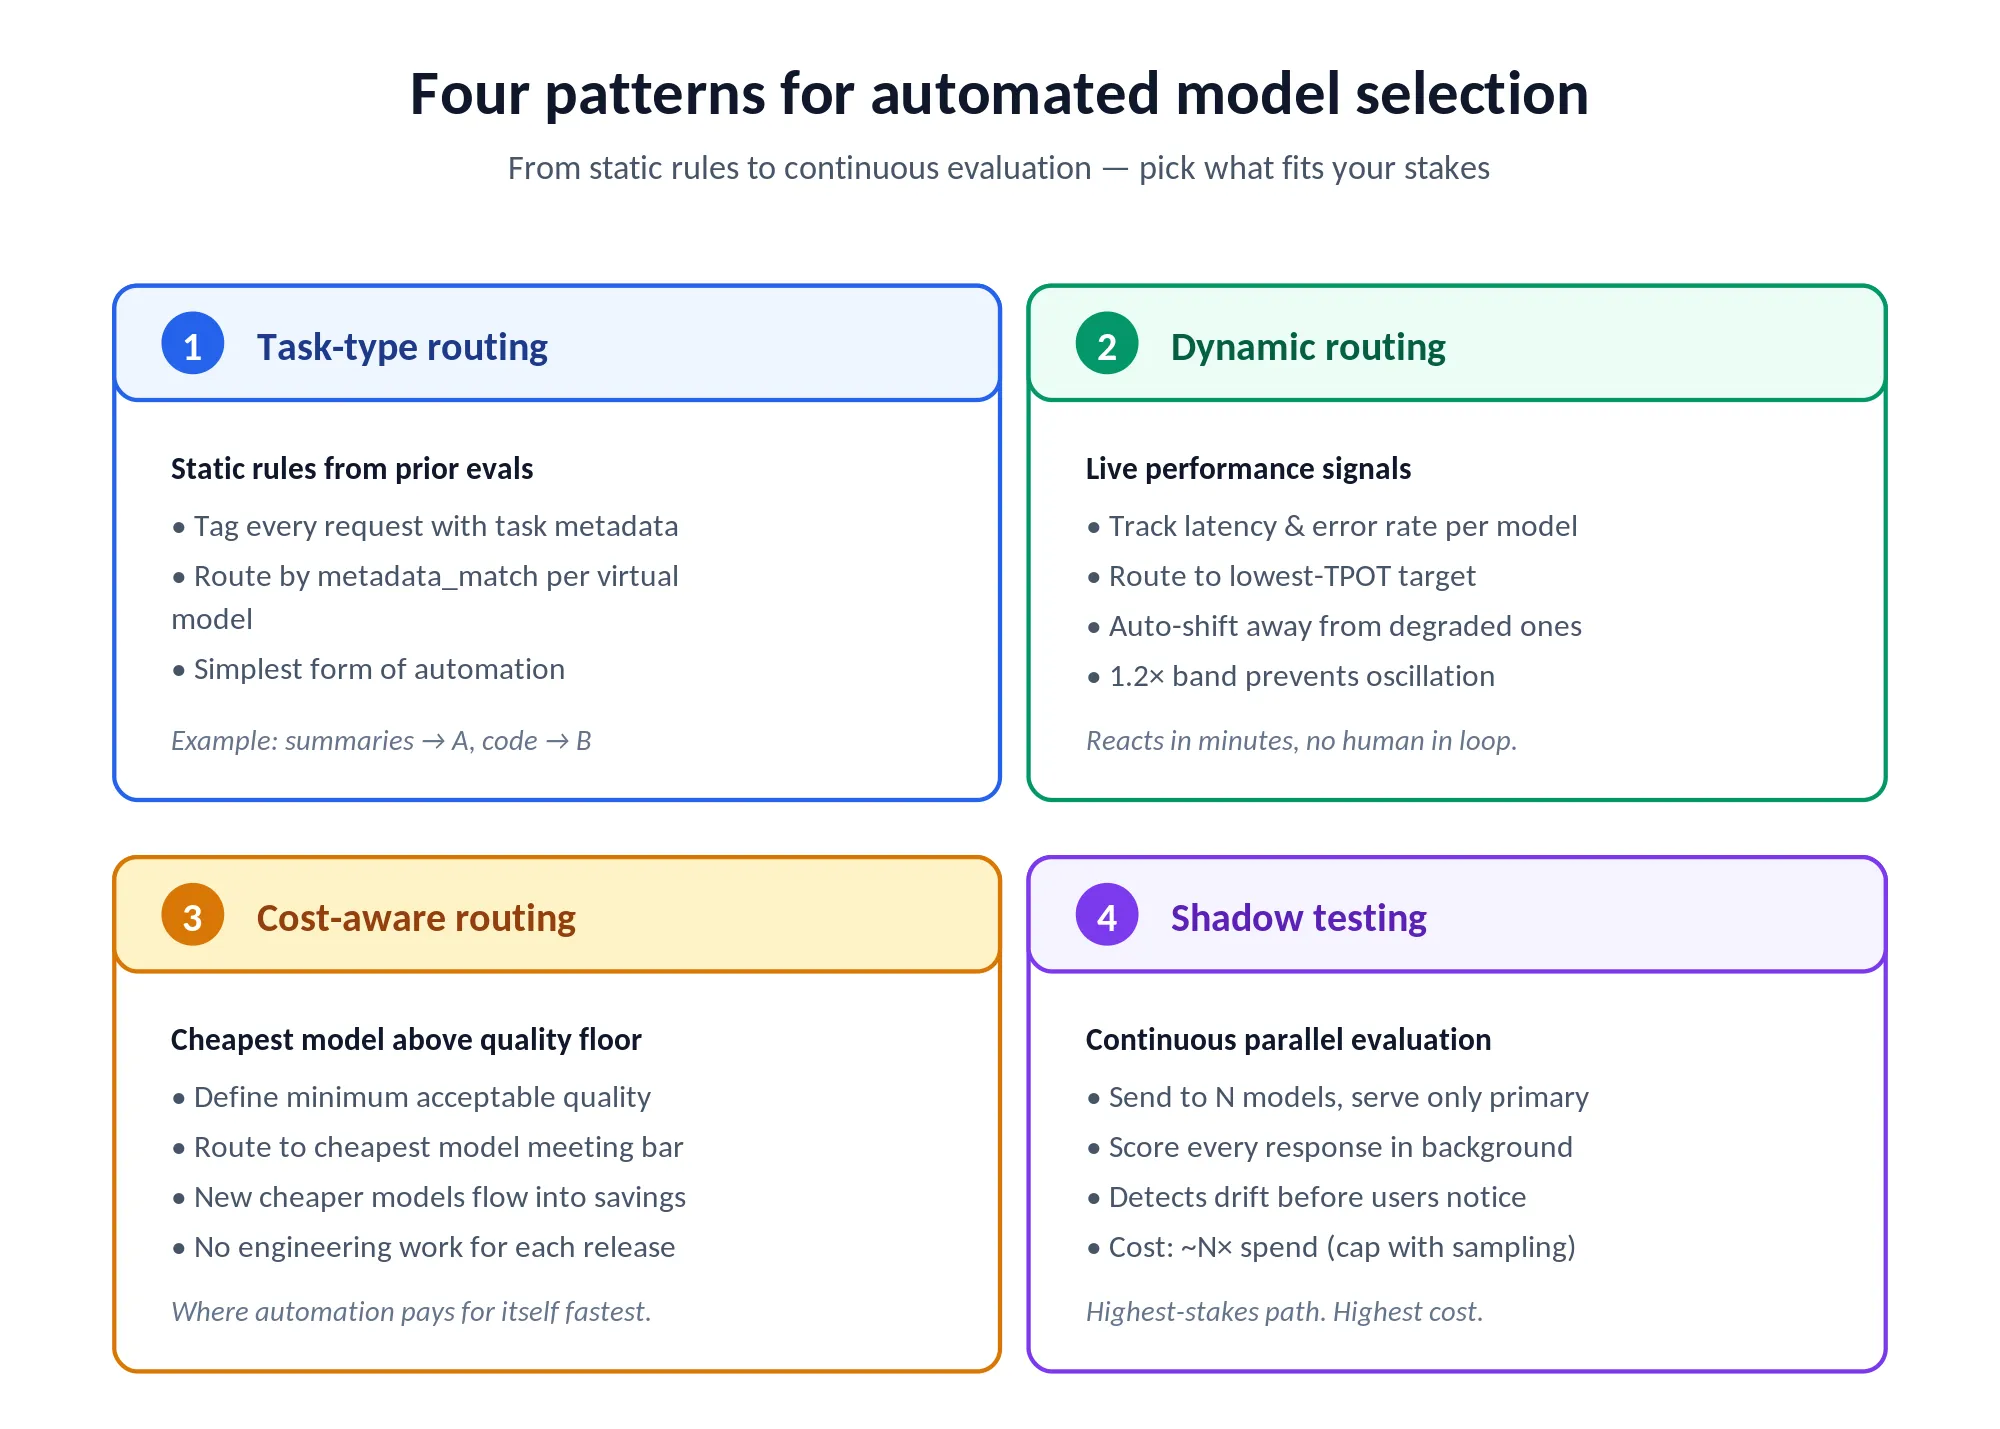
Task-type routing based on evaluation results. Once evaluations have established that Model A is better for document summarization and Model B is better for code generation, configure the gateway to route by task-type tag attached to each request. This is static routing based on prior evaluation, the simplest form of automated model selection. In TrueFoundry's virtual models, this is a metadata_match block on each target: send {task: "summarize"} requests to one provider, {task: "code_gen"} to another, with metadata populated by your application via the X-TFY-METADATA header.
Dynamic routing based on real-time performance signals. More sophisticated routing uses the gateway's live latency and error-rate data to route away from models that are currently degraded. When a provider's API is experiencing elevated latency, the gateway shifts traffic to the next-best model for that task type without waiting for a human to notice. TrueFoundry's latency-based routing routes to the lowest TPOT in the last 20 minutes (or last 100 requests, whichever is fewer), with a 1.2× band so models within that range are treated as equally fast and traffic doesn't oscillate over minor differences.
Cost-aware routing with quality floors. Configure rules that send requests to the cheapest model meeting a defined quality threshold. For tasks where any model above a floor is acceptable, the gateway captures cost savings as cheaper models meet the bar without engineering work. This is where automated routing pays for itself most quickly: every newer, cheaper model that hits your quality floor flows directly into savings.
Continuous evaluation with shadow testing. Shadow testing routes every production request to multiple models simultaneously, serves the response from the primary, and evaluates outputs of all candidates. This creates a continuous evaluation stream that detects model performance changes in real time, before they cause user-visible degradations. The cost overhead is roughly N× the model spend if you shadow against N models, which is meaningful but often less than the cost of deploying a regressing model to production. You can manage that overhead by shadowing only a fraction of traffic, or by shadowing only against smaller, cheaper models being evaluated as cost-down candidates.
How TrueFoundry Solves Enterprise LLM Benchmarking and Model Selection
TrueFoundry's AI Gateway is built to make production model evaluation a continuous capability for enterprise platform teams, not a one-off project. The pieces below are documented in the live AI Gateway docs and have been verified against the deployed product.
Traffic splitting without code changes.Virtual Models handle production traffic splitting between any number of real targets by percentage. Engineering teams configure the split in the UI YAML editor or via tfy apply -f loadbalancer-config.yaml for GitOps. Application code is unchanged: it calls one virtual-model name like support-bot/summarize, and the gateway decides which real provider handles each request. Splits can be adjusted in real time, from 1% to 10% to 50%, as confidence in the candidate grows.
Automatic rollback triggers built in. Two complementary mechanisms govern when a target is taken out of rotation. Failure-tolerance config (configurable per model via allowed_failures_per_minute, cooldown_period_minutes, and a list of failure_status_codes) marks a target unhealthy once the error rate breaches the threshold, then automatically restores it after the cooldown elapses. SLA cutoff (priority-based routing only) lets you set a TPOT threshold per target; the gateway watches a 3-minute rolling window and demotes a target that breaches it. Production A/B tests fail safe without requiring human monitoring during off-hours.
Cost-per-outcome tracking across models.Cost tracking supports both Public Cost (auto-populated from provider rates) and Private Cost (custom contracts, fine-tuned models). The Metrics dashboard breaks costs down by user, model, team, or virtual account, with a “View by metadata” pivot that lets you slice spend by any custom tag your application attached. CSV export and an HTTP API for raw and aggregated metrics make it easy to push the data into your finance or business-intelligence stack.
Semantic caching that survives routing changes.セマンティックキャッシュ 意味的に類似したリクエストに対して、以前に生成された応答を返します。これは、最後のユーザーメッセージの埋め込みに対するコサイン類似度と、設定可能なしきい値(推奨開始値は0.9)を使用します。他のリクエストパラメータ(モデル、以前のメッセージ、温度など)は個別にハッシュ化され、完全に一致する必要があるため、キャッシュヒットは厳密にスコープされます。キャッシュエントリは、デフォルトでユーザー/仮想アカウントごとに分離されており、マルチテナントアプリケーション向けにオプションでカスタムネームスペースを設定できます。キャッシュヒットは、ルーティングレイヤーが他にどのターゲットを選択していたとしても関係なく、モデルコストゼロでミリ秒単位で応答を返します。
単一の評価で広範なプロバイダーを網羅。 TrueFoundryは、OpenAI、Anthropic(直接およびAWS Bedrock経由)、Azure OpenAI、AWS Bedrock、AWS SageMaker、GCP Vertex AI、Cohere、Together AI、Mistral、Groq、Cerebras、xAI、Databricks、セルフホスト型モデル、その他(全リストは AI Gateway概要ページ)で確認できます。チームは、各プロバイダーごとに個別の統合作業を行うことなく、単一のA/BテストでAWS Bedrock Claude Sonnet 4.5とAzure OpenAIの同等モデルを比較できます。ゲートウェイの公称オーバーヘッドは「通常5ms未満」であり、1 vCPUで350+ RPSの持続スループットを実現するため、本番環境の規模でもゲートウェイがクリティカルパスから外れます。
Run your first production model A/B test in under 30 minutes with TrueFoundry.
TrueFoundry's AI Gateway handles traffic splitting, cost-per-outcome tracking, and automatic rollback for live model evaluations. Book a demo to see the setup.
TrueFoundry AI Gateway delivers ~3–4 ms latency, handles 350+ RPS on 1 vCPU, scales horizontally with ease, and is production-ready, while LiteLLM suffers from high latency, struggles beyond moderate RPS, lacks built-in scaling, and is best for light or prototype workloads.






.png)

.png)
.png)
.png)

.png)
.png)
.png)
.png)
.png)
.png)
.png)