November 11, 2026
|
5 min read


Blazingly fast way to build, track and deploy your models!
Tracking OpenRouter usage starts from one design decision: OpenRouter always records metadata (timestamps, model, provider, token counts, latency, cost) and records prompt and completion content only when an organisation admin opts in. Everything else on this heading follows from that, and from the mirror-image decision on the TrueFoundry side, where full bodies are logged by default under a logging policy you write. This post compares the two on request capture and search, metrics and their formats, LLM tracing and context propagation, attribution granularity, dashboards and integrations, alerting, eval hooks, and retention. Every claim comes from the two vendors' public documentation, and where OpenRouter is ahead we say so, because on this heading it sometimes is.
The OpenRouter dashboard for usage is the Activity page: every request's metadata lands there with optional workspace filtering, Explore charts draw on the same aggregates the Analytics API returns, and chart configurations can be saved and shared with "Everyone in my organization". Enabling Usage Accounting returns cost and token counts in each response body, so a client can track spend per call without polling. Prompt and completion content is a separate, opt-in feature: Input & Output Logging is in beta, toggled per workspace, viewable only by org admins, and skipped for requests sent through the regional endpoints, so in-region routing and content logging are mutually exclusive. Two features make OpenRouter activity data more useful than raw metadata usually is. Broadcast carries a per-destination sampling rate (deterministic by session_id, so sessions export whole) and per-destination API-key filtering, which lets production keys export at a lower rate than development keys. Custom Classifiers let you define a taxonomy (department, task type, agent complexity) that a small model applies to every generation, after which logs filter and analyze groups by those tags. Capture itself is binary per workspace; the sampling is on export, not ingest.
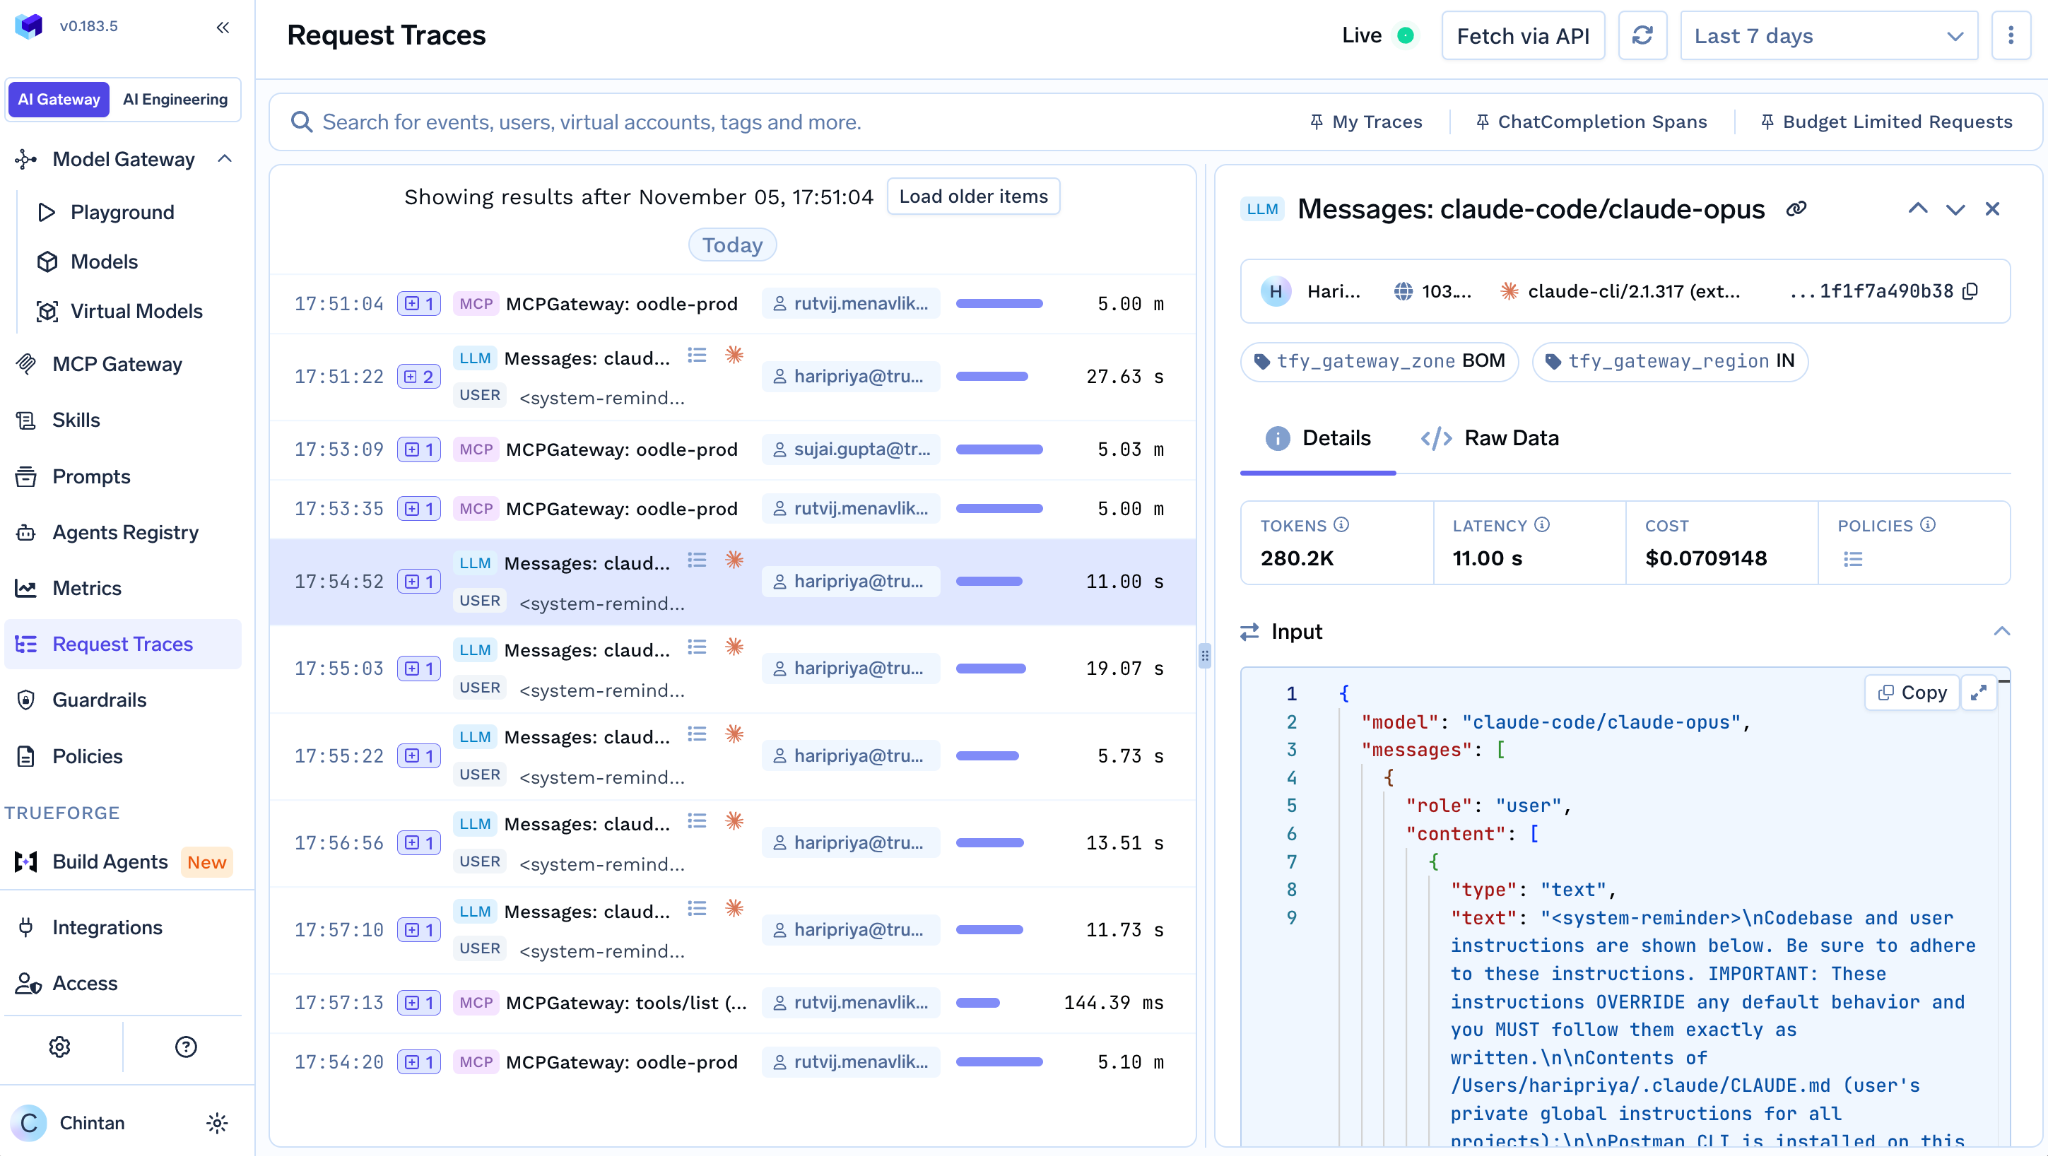
TrueFoundry logs full request and response bodies as Parquet in blob storage, governed by logging configs that match on user, team, model or metadata; cost, tokens and latency are recorded even when a rule suppresses bodies (request logging). Search runs through a span-query API filtered by trace ID, subject, model and metadata, with documented span attributes, plus a Request Traces browser in the UI (fetching request logs). Because the Parquet lands in your own bucket, DuckDB, Athena or Spark can query it directly, which is the raw-data-ownership argument in one sentence. What we do not have, and OpenRouter partly does: percentage sampling. Our logging configs are log or don't-log per matching rule. Our overview of observability in an AI gateway covers the logging-policy model in more depth.
OpenRouter's Analytics API is in beta. GET /api/v1/analytics/meta lists supported metrics, dimensions, filter operators and granularities; POST /api/v1/analytics/query runs the query. A management key is required, and regular API keys receive a 403. The metric set is good: spend broken down by credits, OpenRouter, BYOK, BYOK fees, upstream, cache and web; request count; tokens as prompt, completion, reasoning or cached; cache hit rate; blended cost per million tokens; and latency and throughput at P50, P90 and P99, at minute, hour, day, week or month granularity. Two limits matter for anyone building reports on it: queries are capped at two dimensions, and responses carry a truncation flag. There is no Prometheus scrape endpoint, which follows from there being no customer-operated process to scrape; OTLP metrics via Broadcast are the second path.
TrueFoundry exposes a Prometheus-scrapable /metrics endpoint on self-hosted gateways with a fully documented metric catalogue and label set, OTel metrics export configured from the dashboard in OTLP HTTP or gRPC, and a query API family covering model, MCP, guardrail, cache, routing and agent metrics (Prometheus and Grafana, OpenTelemetry export). The one place OpenRouter's LLM metrics read better on paper is the ready-made percentile row; ours are per-dimension latency series you aggregate in Grafana, which is the same data with one more step.
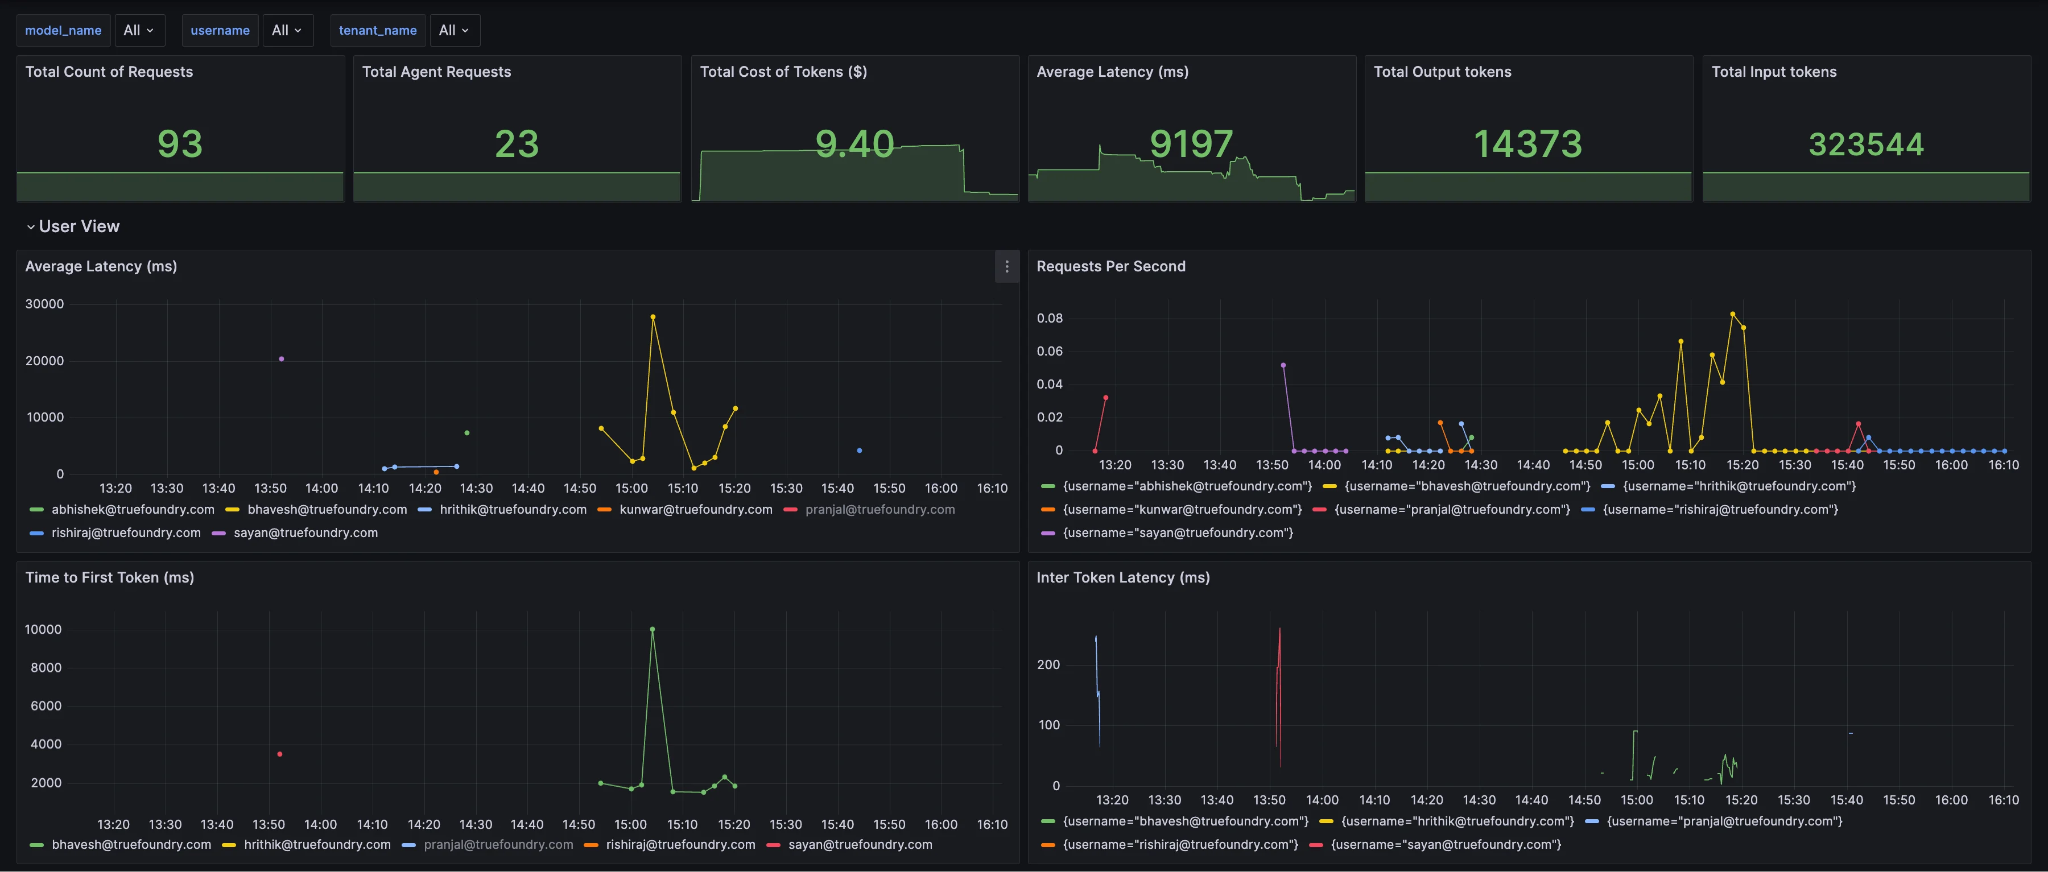
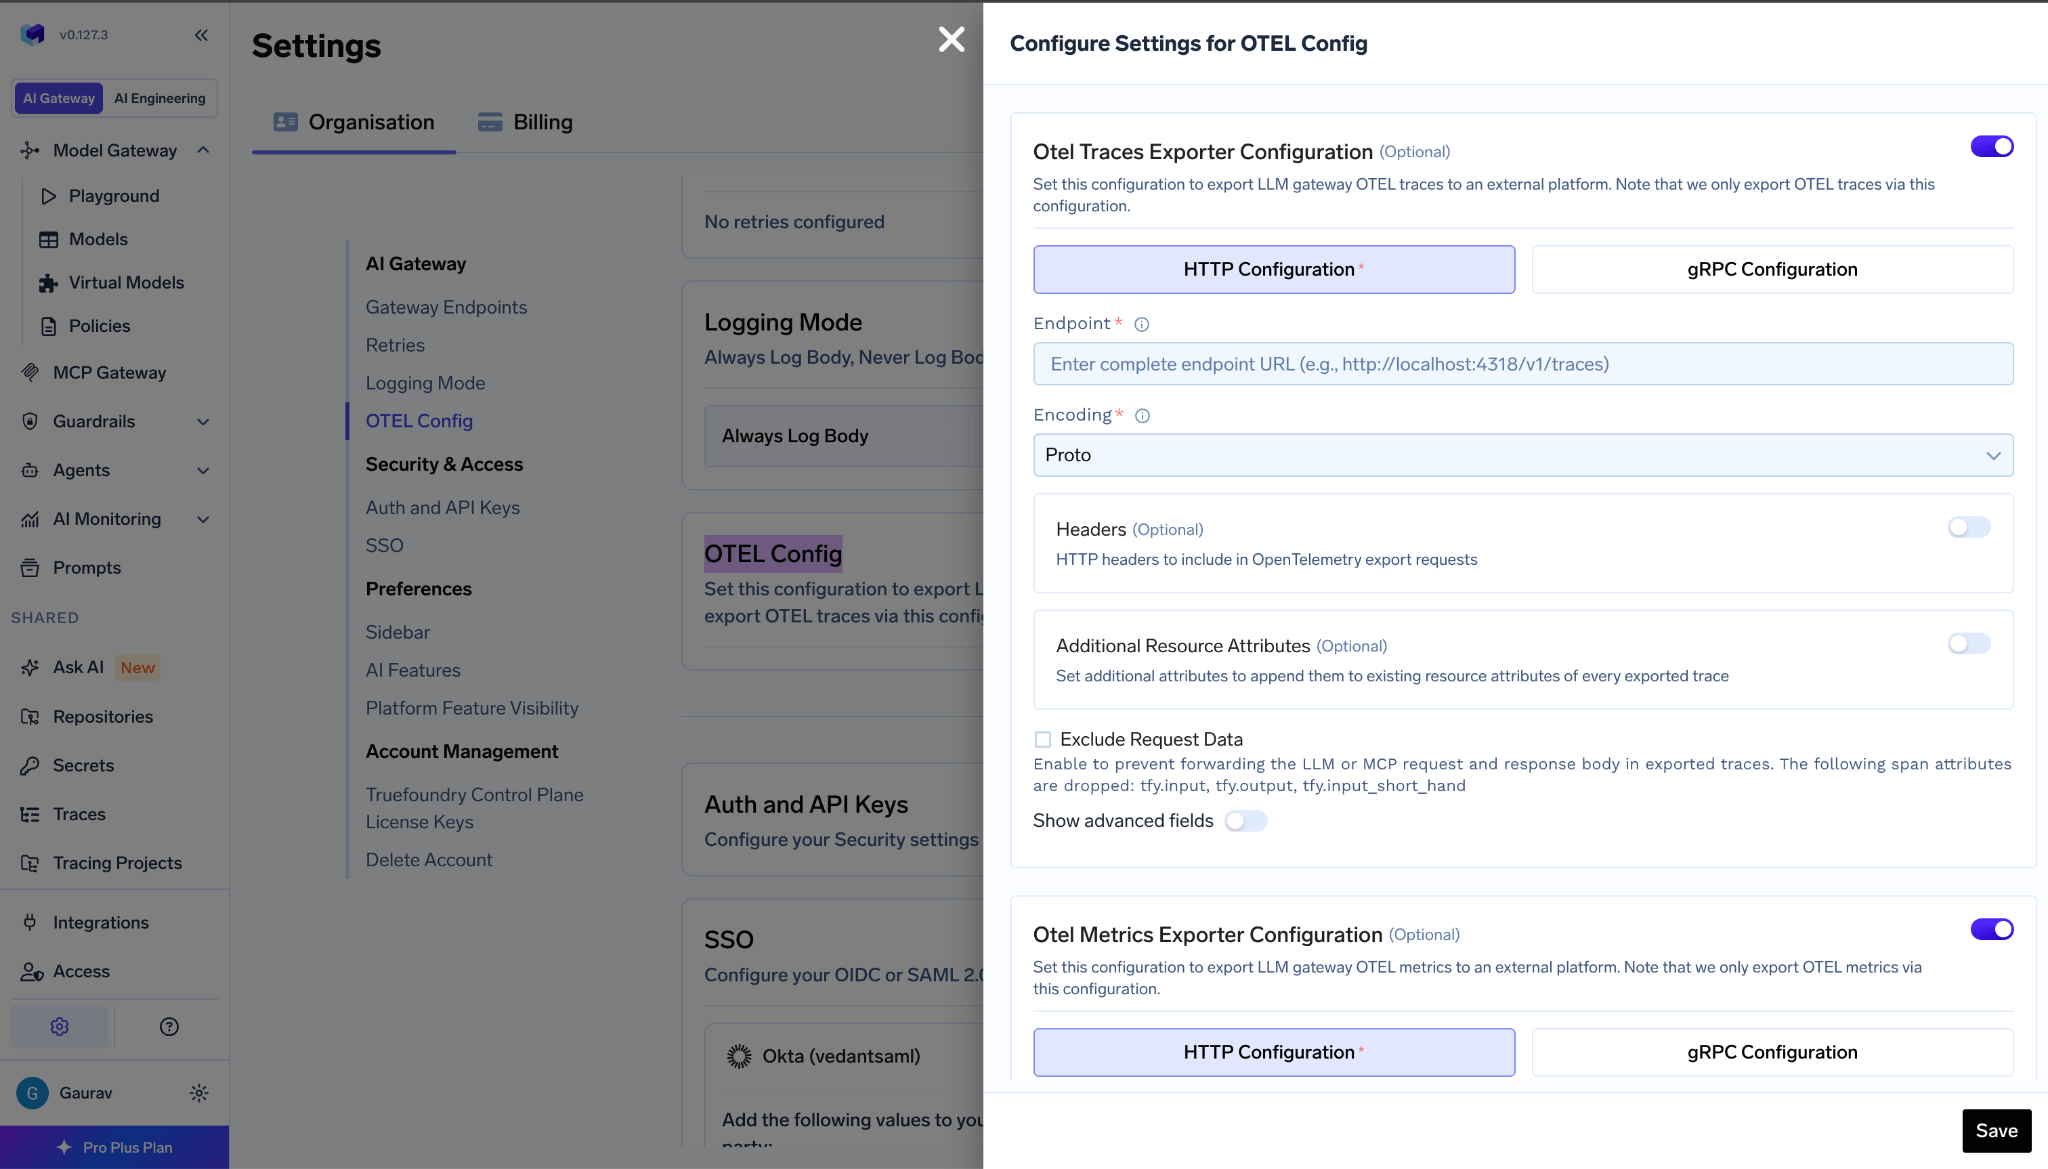
OpenTelemetry LLM export exists on both sides, with different shapes. TrueFoundry is natively OTel-compliant: gateway traces are stored by TrueFoundry and optionally dual-exported to any OTLP backend without affecting internal storage, and spans follow the OpenTelemetry GenAI semantic conventions with a documented attribute reference (span attributes). OpenRouter is OTLP-native on the way out through Broadcast, with destination-specific mappings: OpenInference attributes for Arize, TraceQL-queryable attributes for Grafana Cloud, NRQL for New Relic, OTLP JSON for generic webhooks.
Context propagation is where they diverge, and the difference is operational rather than cosmetic. OpenRouter nests its generation span under your application span if you pass a trace object with trace_id and parent_span_id in the request body. That is explicit propagation through the payload, which means modifying every call site; whether an inbound W3C traceparent header is honoured is not documented. TrueFoundry does not explicitly document inbound traceparent propagation either. We say the same thing about both: send one header, inspect the exported span's parent, and you have your answer in ten minutes. Gateway-level tracing is also what feeds our agent tracing product, and the ~3–4 ms added latency and 350+ requests per second per vCPU hold with tracing on, across 2,500+ LLMs through one OpenAI-compatible API.
OpenRouter token usage attributes across a wide dimension set through the Analytics API: model, variant, provider, API key, app, user, workspace, origin, country, data region, finish reason, context length, session, generation, custom user IDs and any classifier dimension, grouped by at most two at a time. Activity Export produces aggregated usage as CSV or PDF by model, key or organisation member, with one caveat for finance: BYOK spend is estimated at provider market rates, not at any discount you negotiated, so an export of BYOK-heavy traffic overstates what you paid.
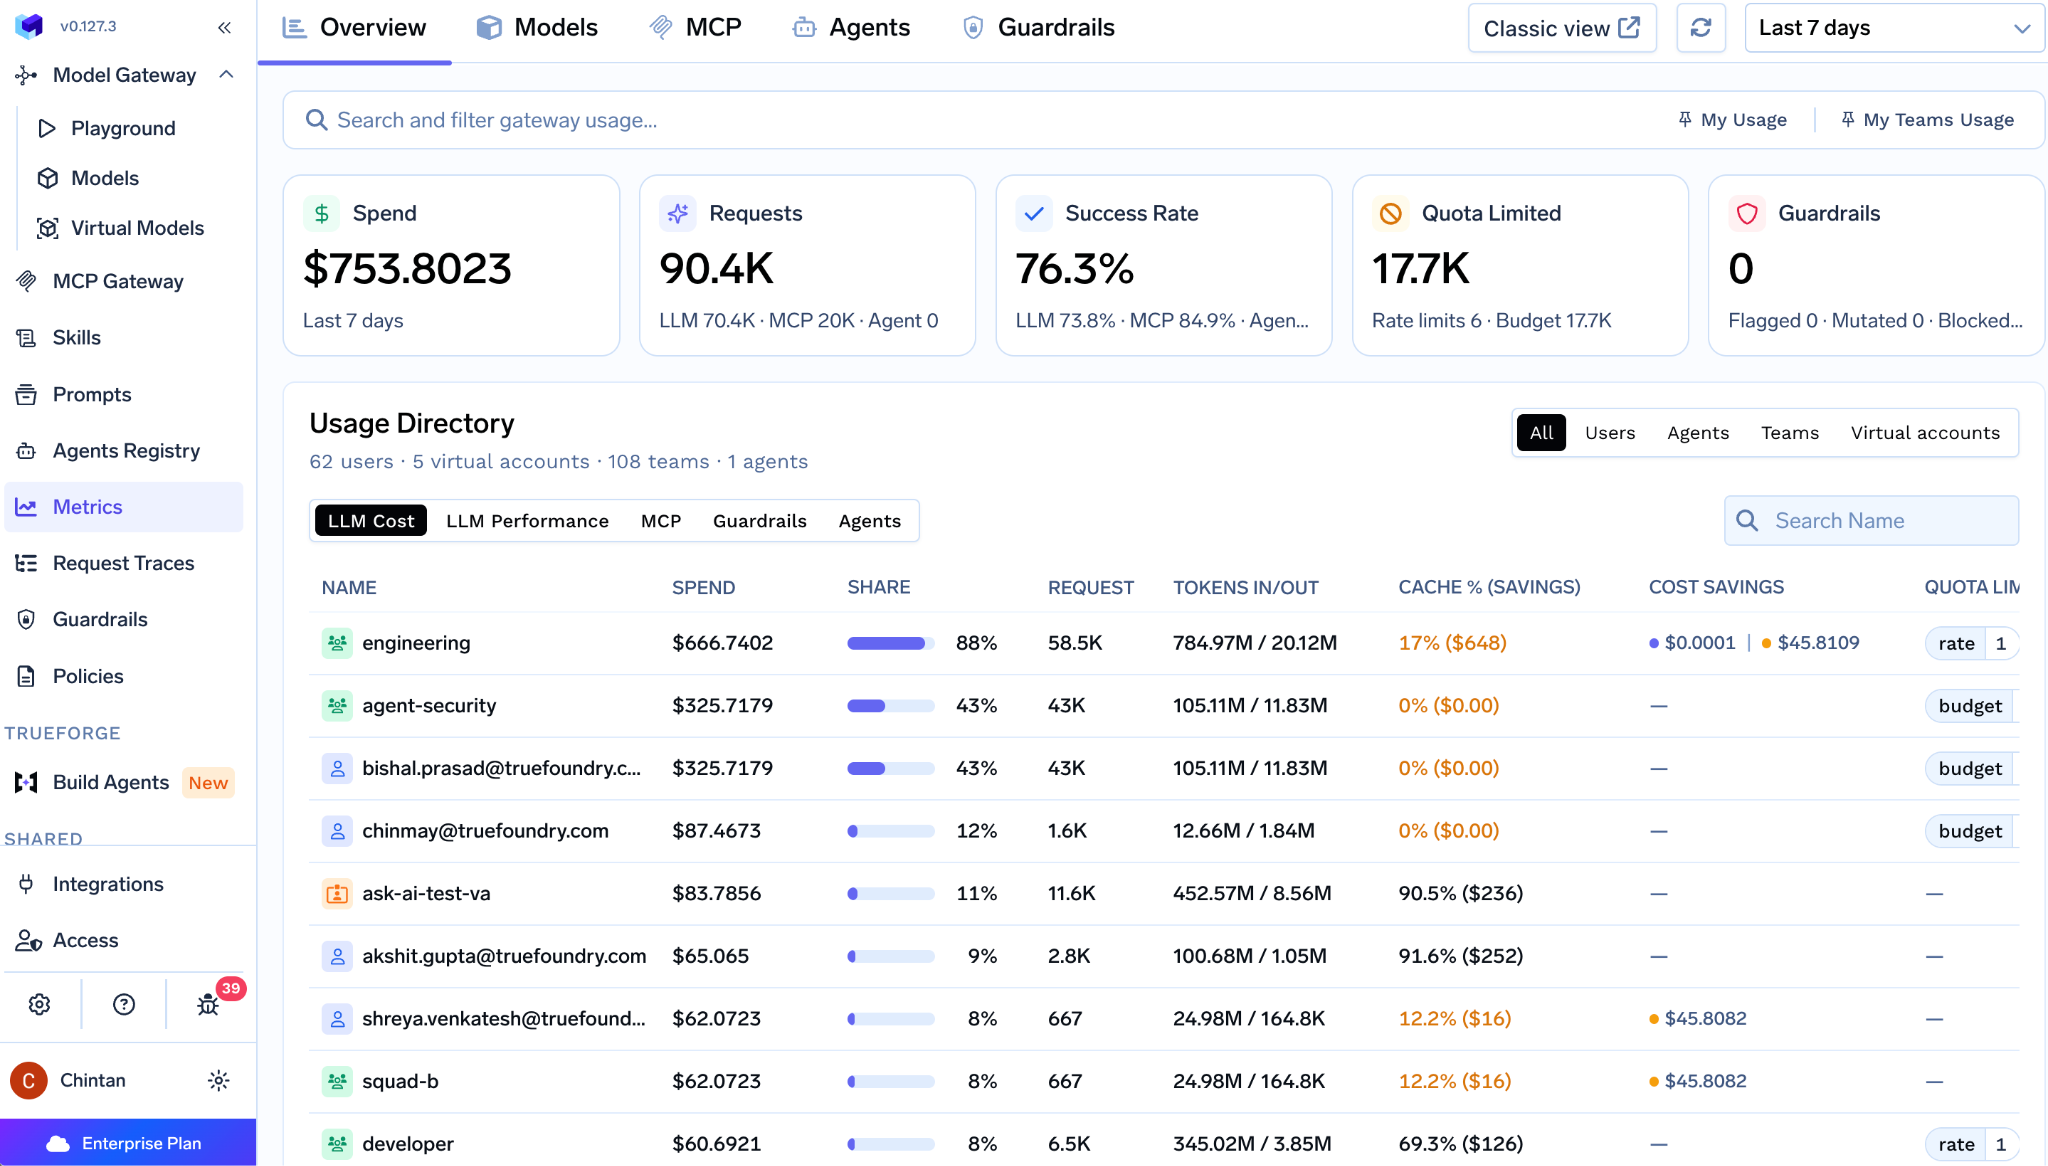
TrueFoundry attributes tokens, cost and latency per request, user, team, virtual account, model, provider account, MCP server, individual MCP tool and arbitrary metadata keys, sliceable without a dimension cap in the dashboard and query APIs (analytics). Tool-level attribution is the row OpenRouter cannot match, because it does not sit on the tool-call path; for agent workloads where the cost is in the tools rather than the model, that is the number you need. Our guide to LLM cost tracking shows how the per-team and per-virtual-account views feed chargeback.
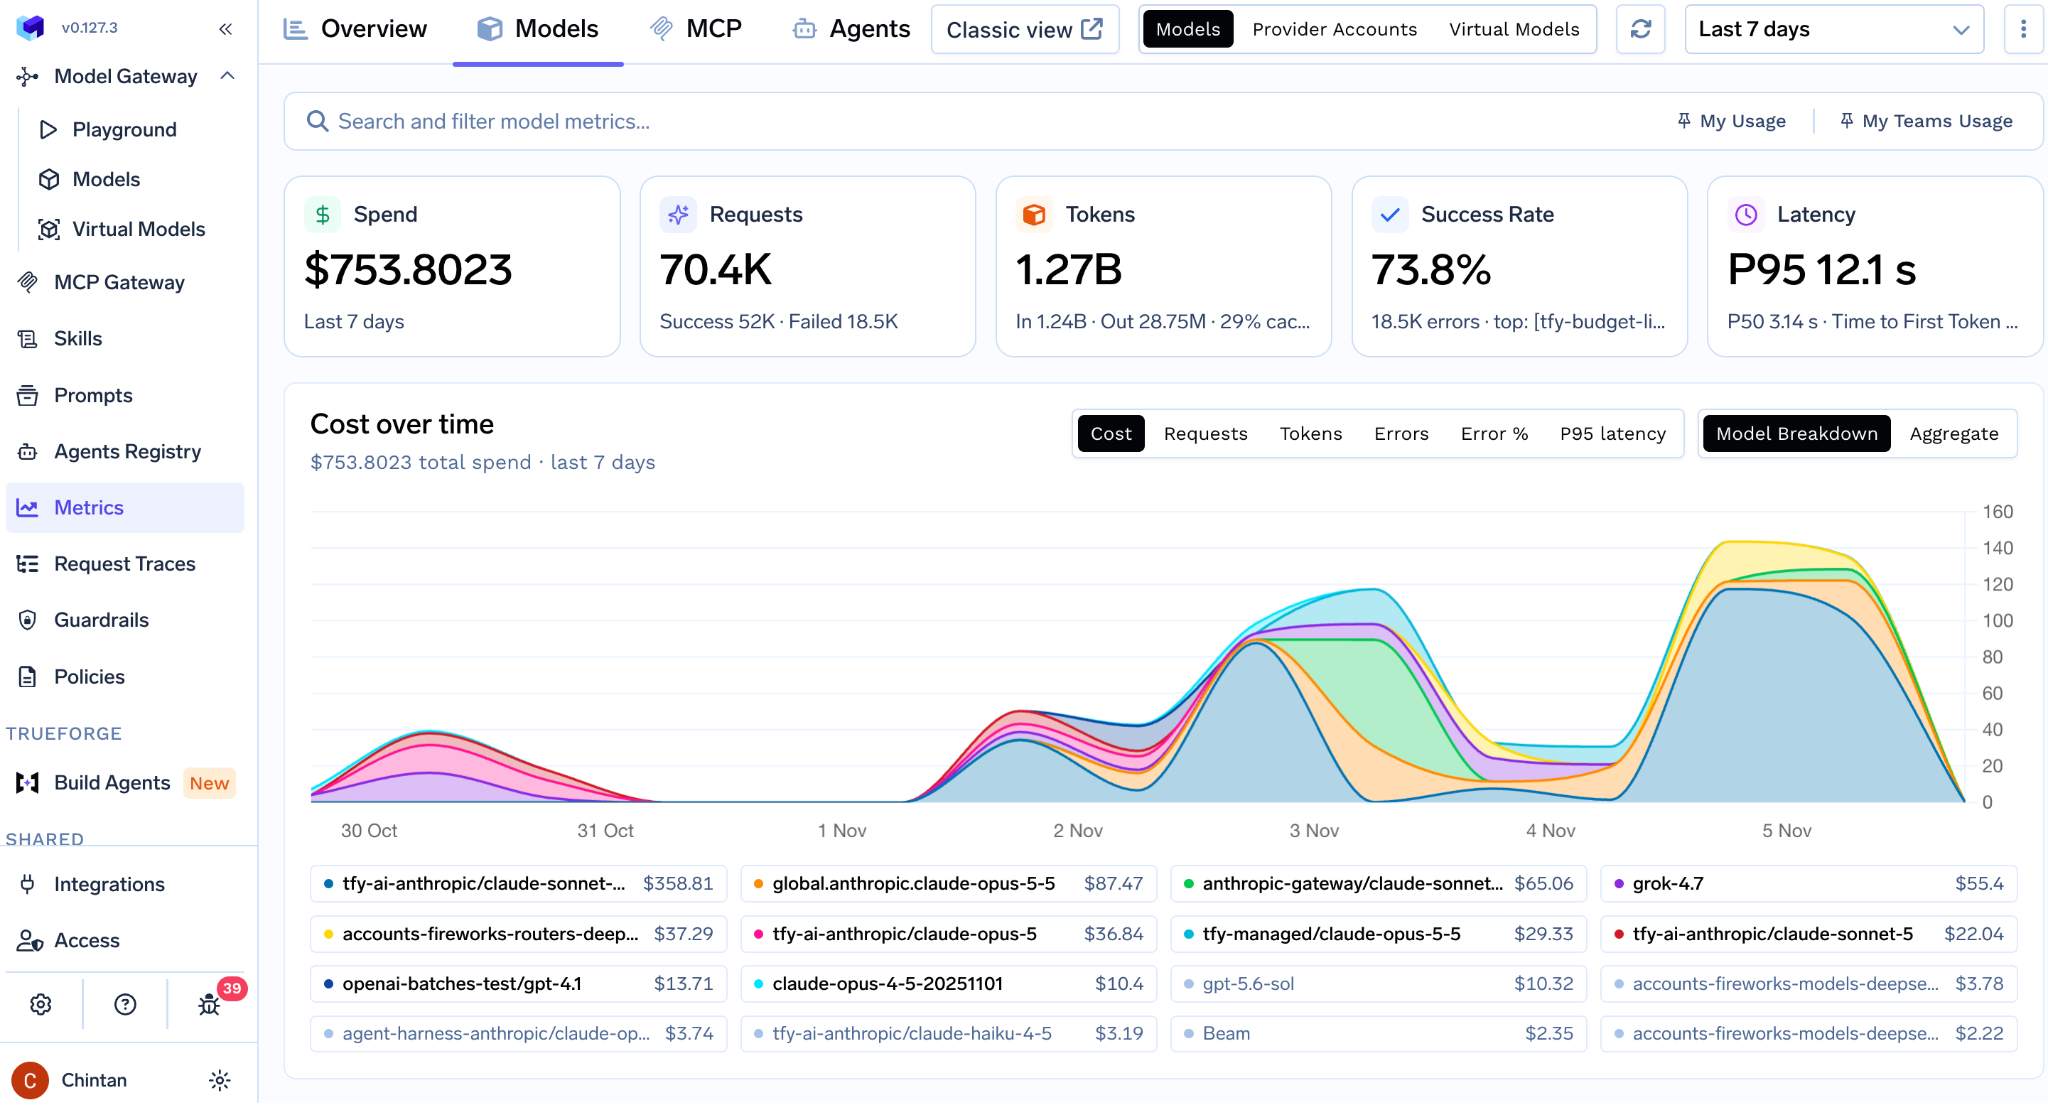
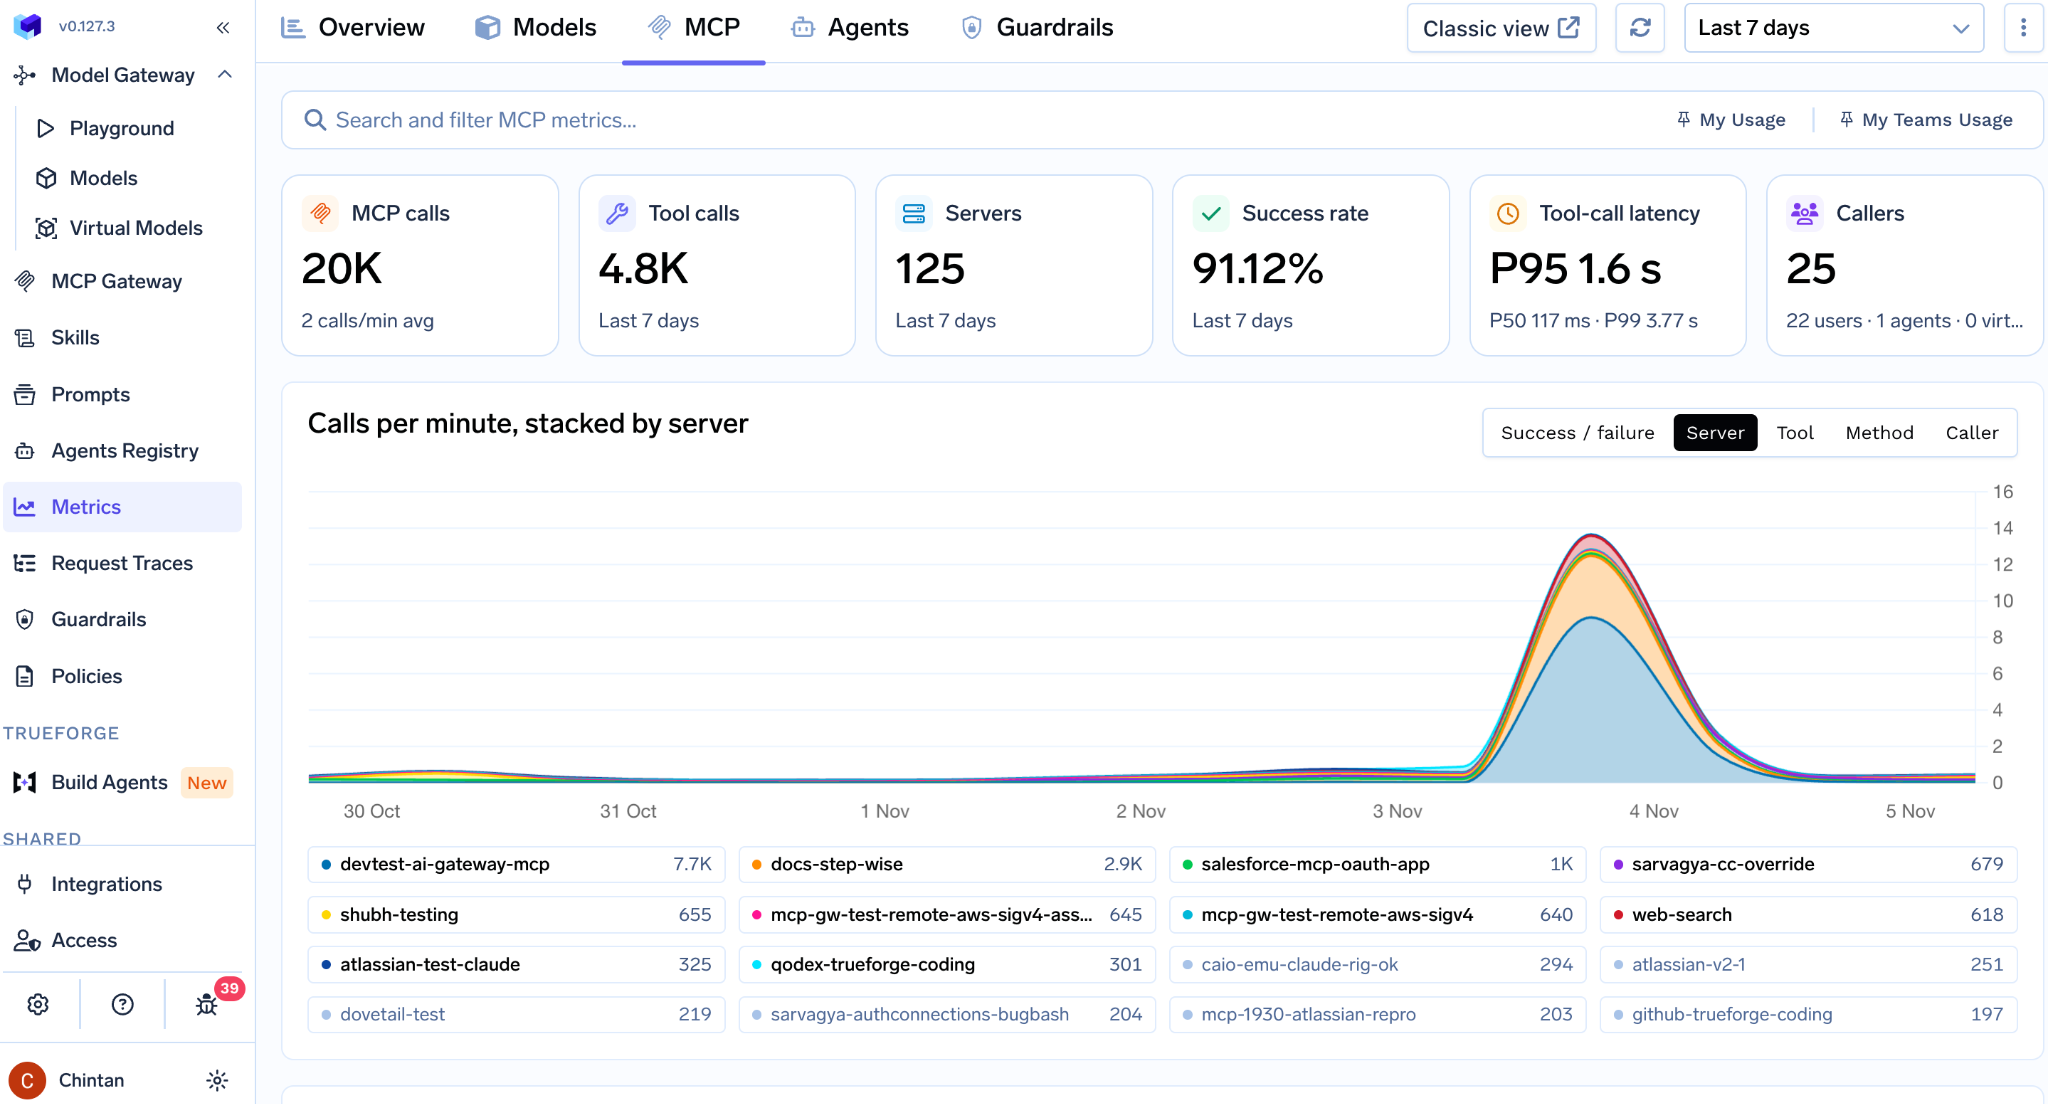
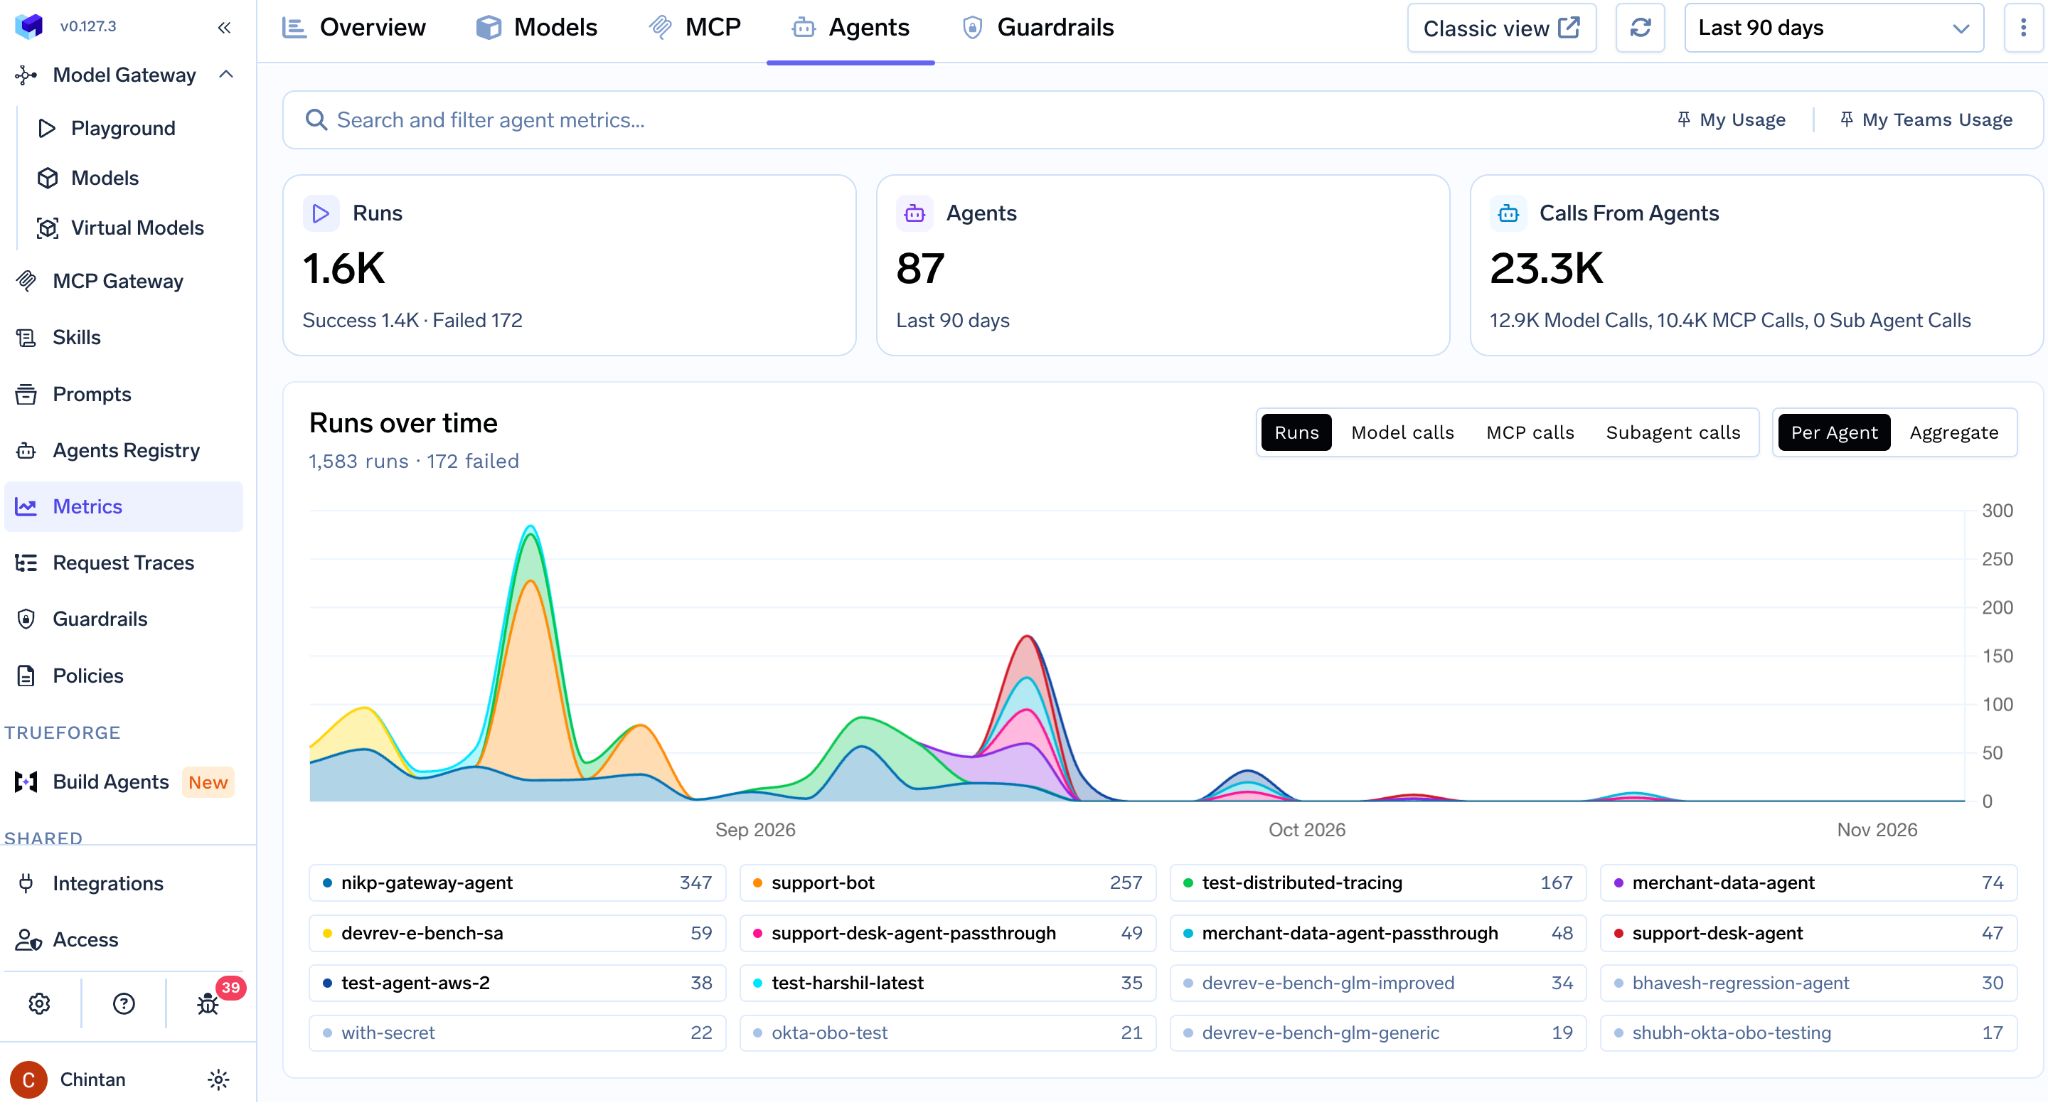
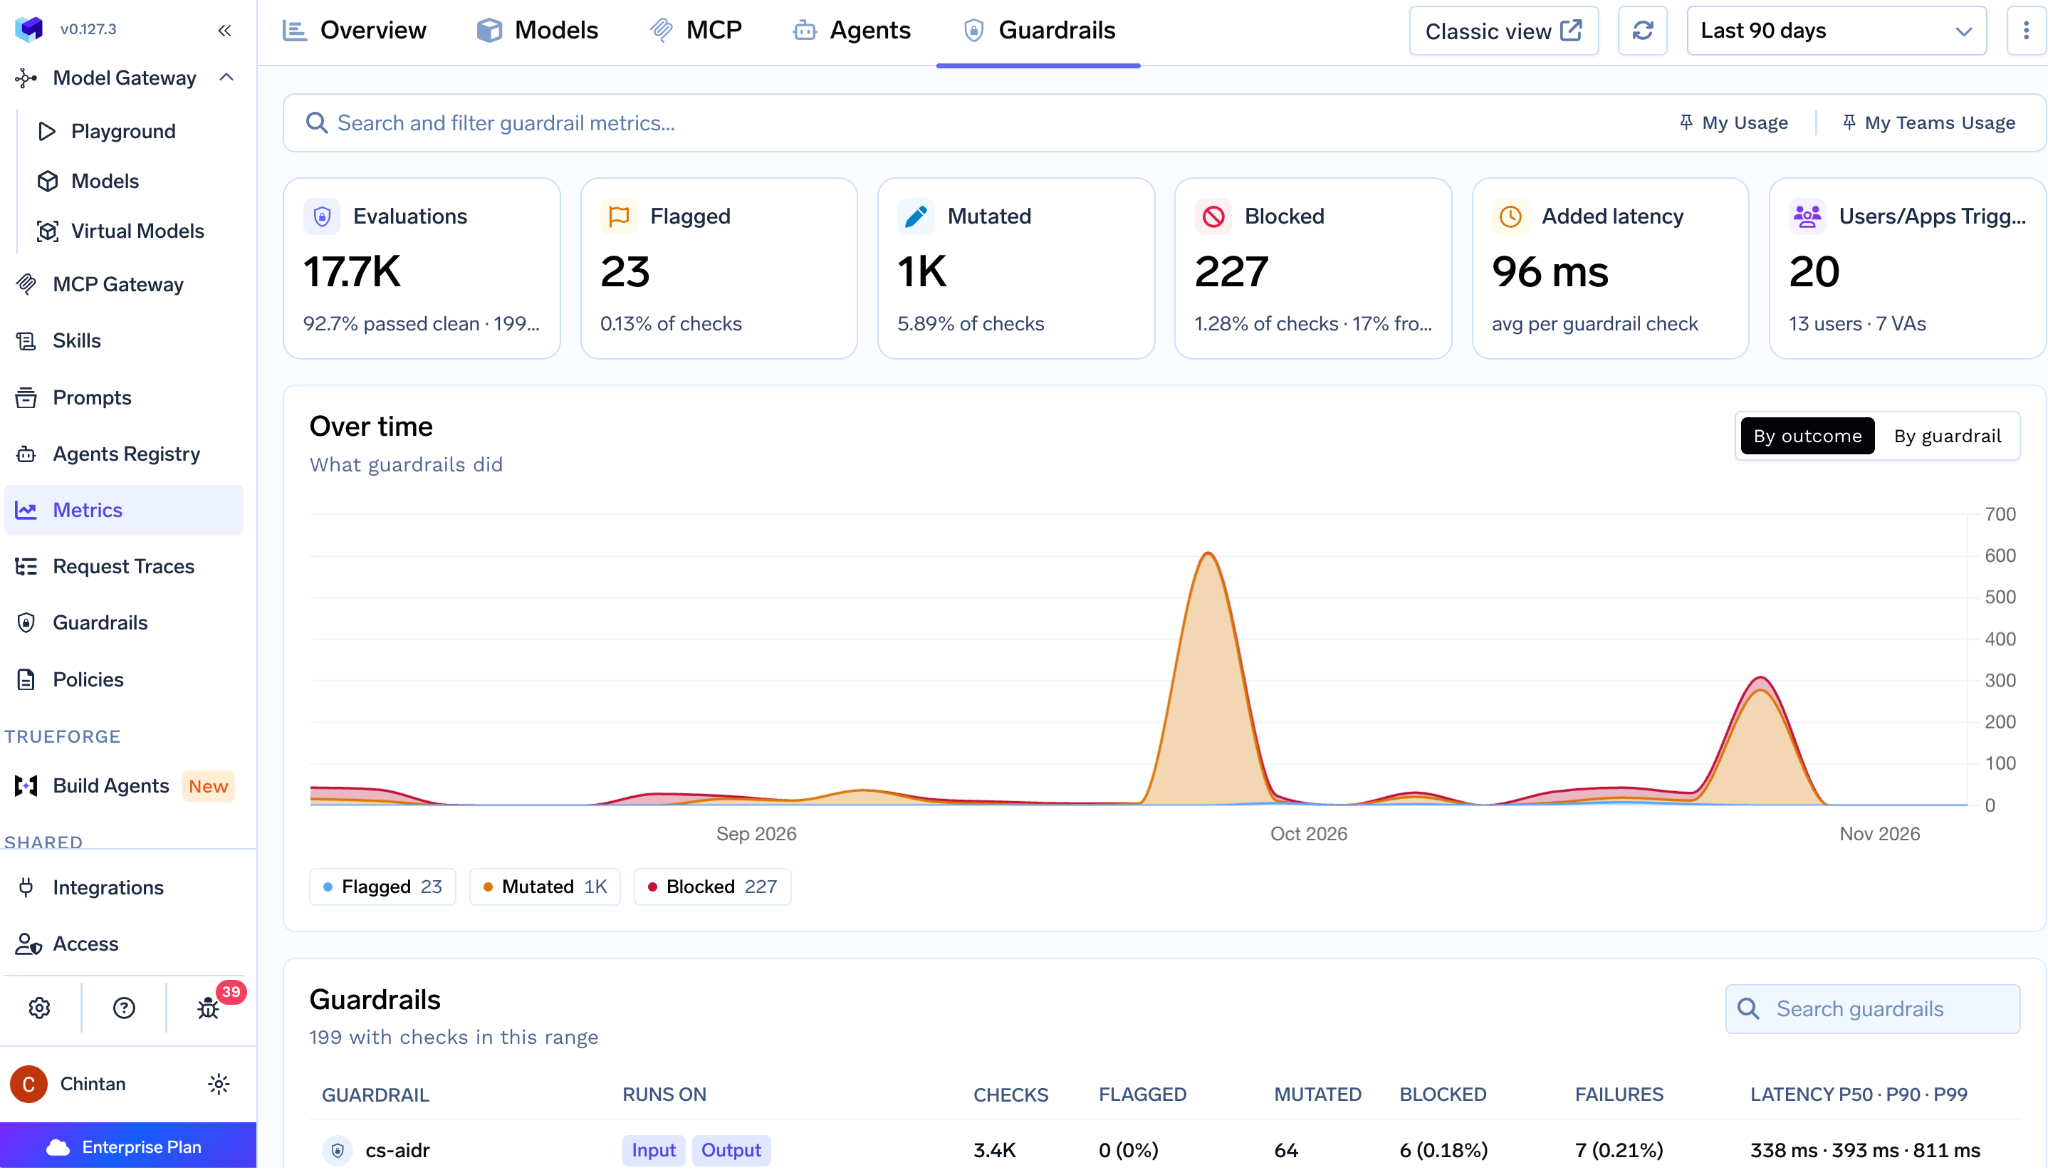
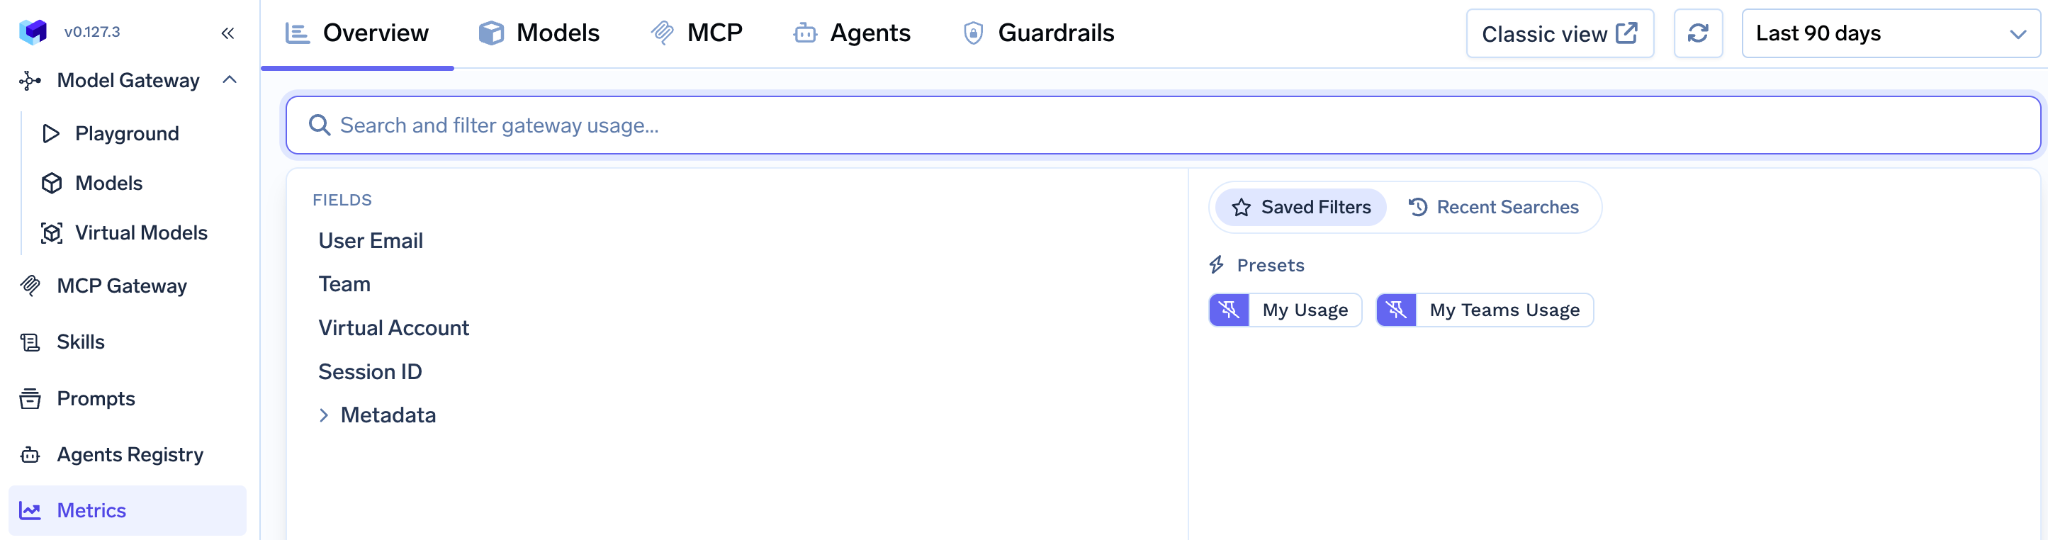
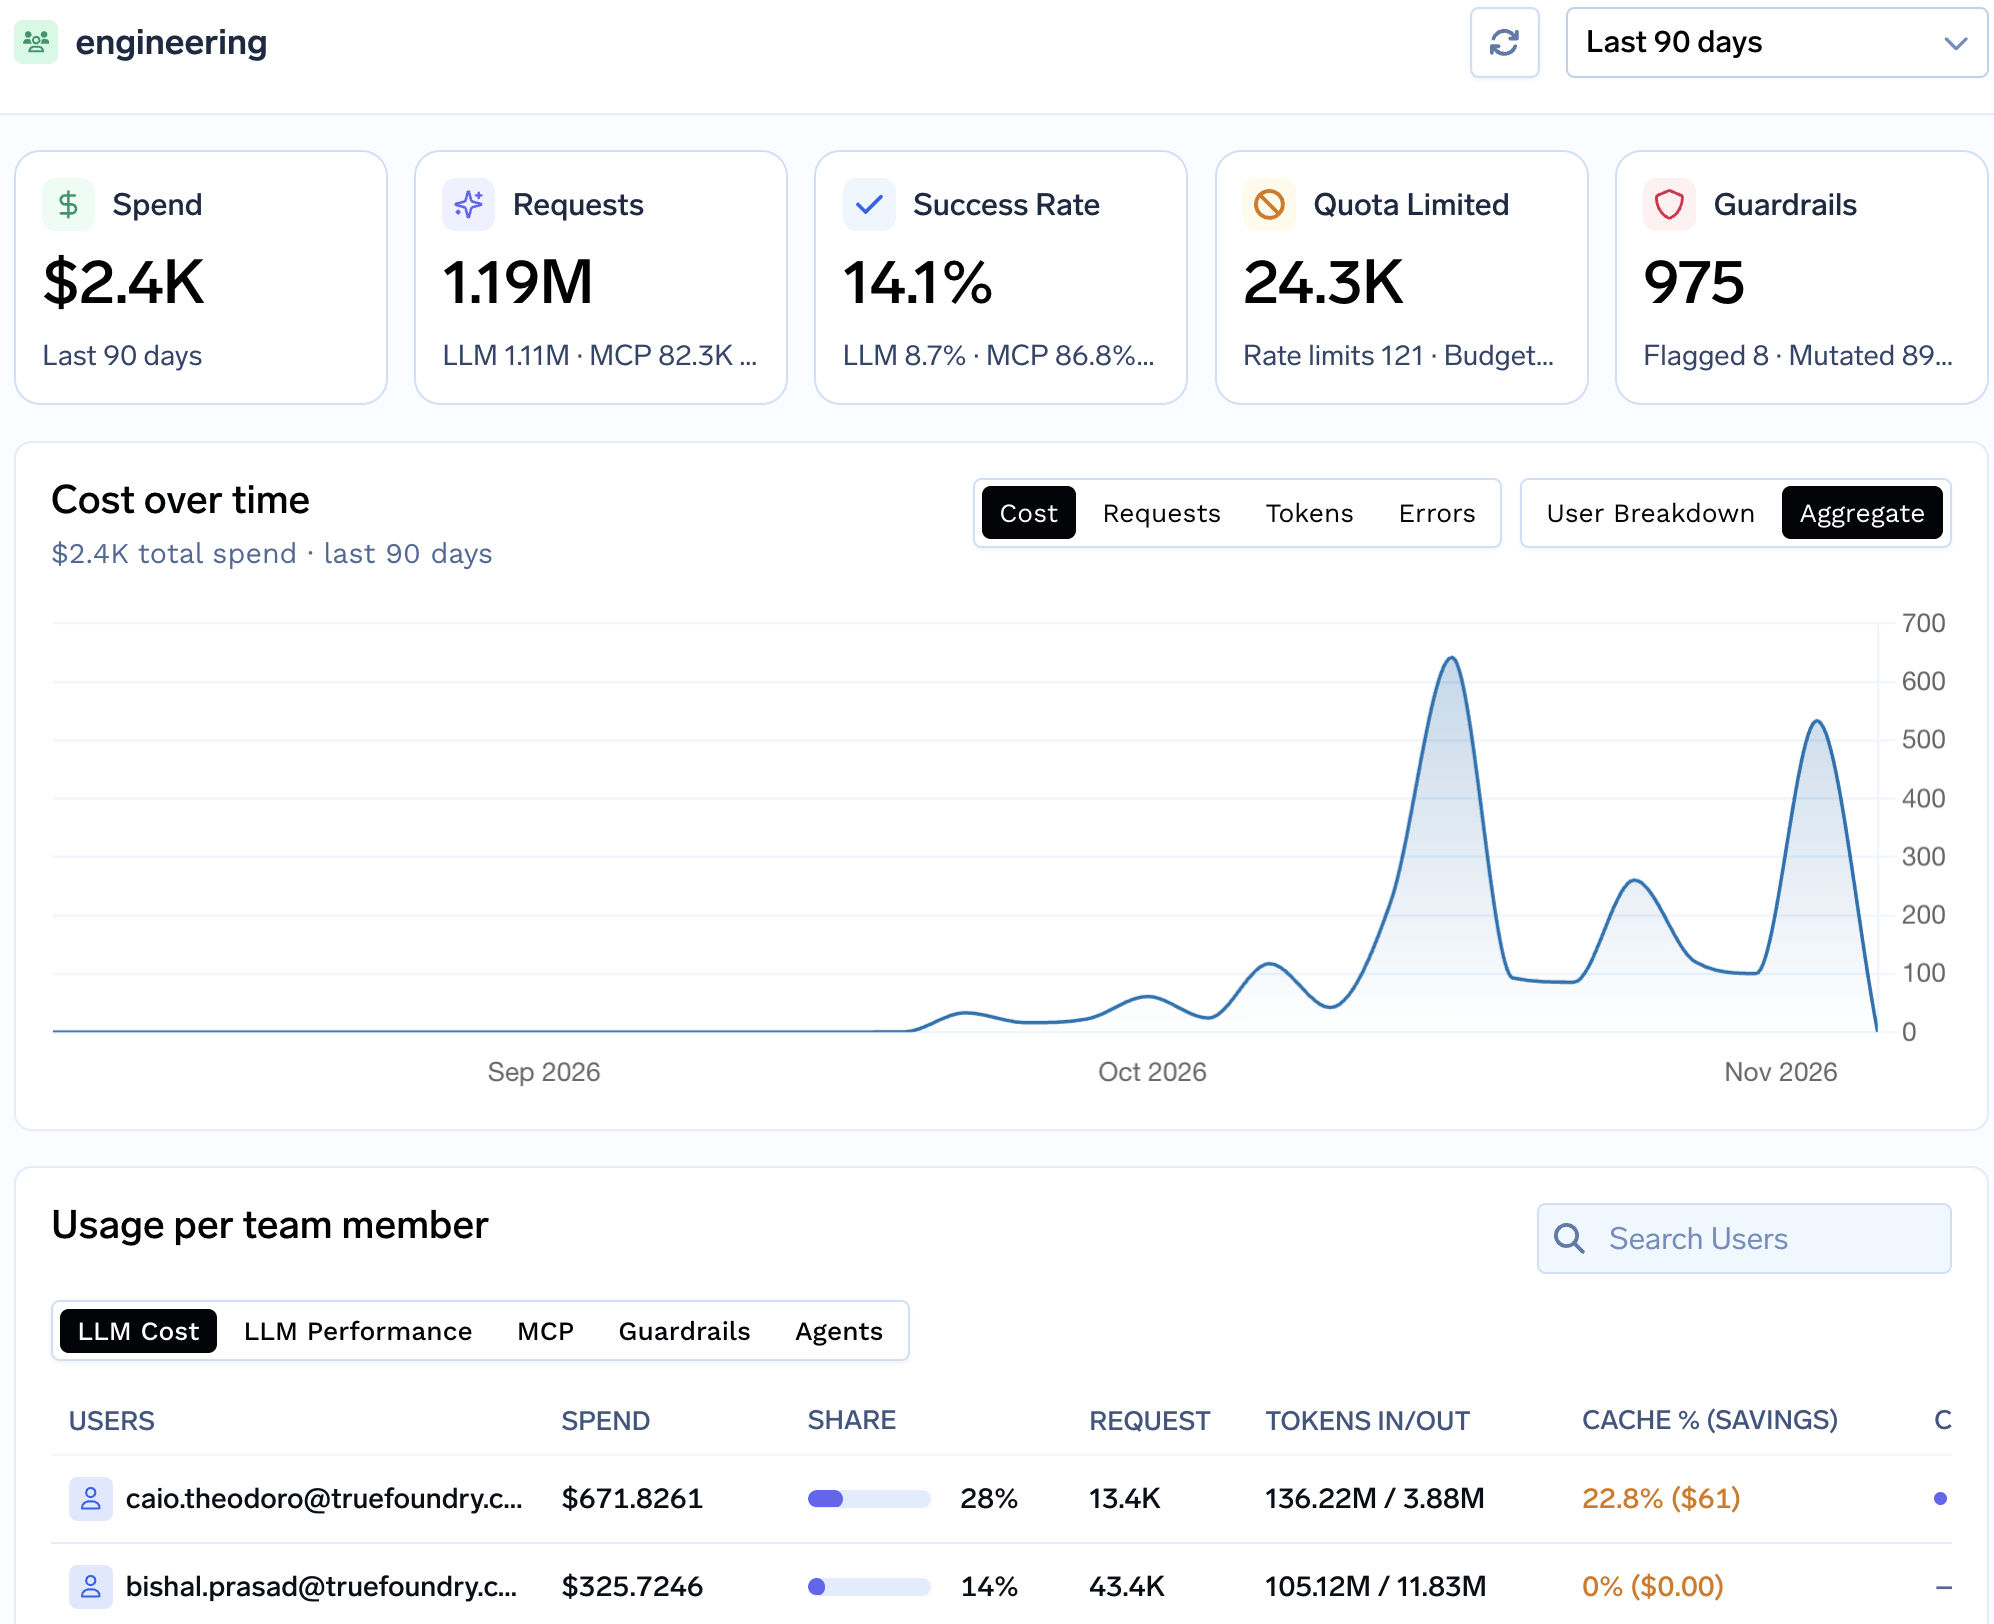
Both ship a built-in dashboard and a bring-your-own path. TrueFoundry's Metrics Dashboard has tabbed views for overview counters, cost, LLM and MCP breakdowns, errors, guardrails and leaderboards; OpenRouter's Activity dashboard has saveable Explore charts and a Logs view with generation detail pages.
On integrations OpenRouter wins the row, and we would rather say it than bury it. Broadcast destinations: Arize AX, Braintrust, ClickHouse, Comet Opik, Datadog, Elastic Observability, Google BigQuery, Grafana Cloud, Hugging Face storage buckets, Langfuse, LangSmith, New Relic, OpenTelemetry Collector, PostHog, Raindrop, Ramp, S3 and S3-compatible, Sentry, Snowflake, W&B Weave and a generic webhook, with encrypted credentials and a configuration that only saves if Test Connection succeeds. The data-warehouse and product-analytics sinks (BigQuery, Snowflake, PostHog) have no direct equivalent in our list. TrueFoundry documents Datadog, Grafana/Prometheus, New Relic, Langfuse, Arize, Honeycomb, Dynatrace, SigNoz, Coralogix, Traceloop, Middleware and W&B Weave, plus anything OTLP-compatible through the generic exporter (ecosystem), and a warehouse is reachable from the Parquet bucket rather than from a native connector. One interaction to pin down before relying on Broadcast: it exports trace data to a third party of your choosing, and the Datadog guide references a Privacy Mode, so check how that interacts with content you have otherwise chosen not to store.
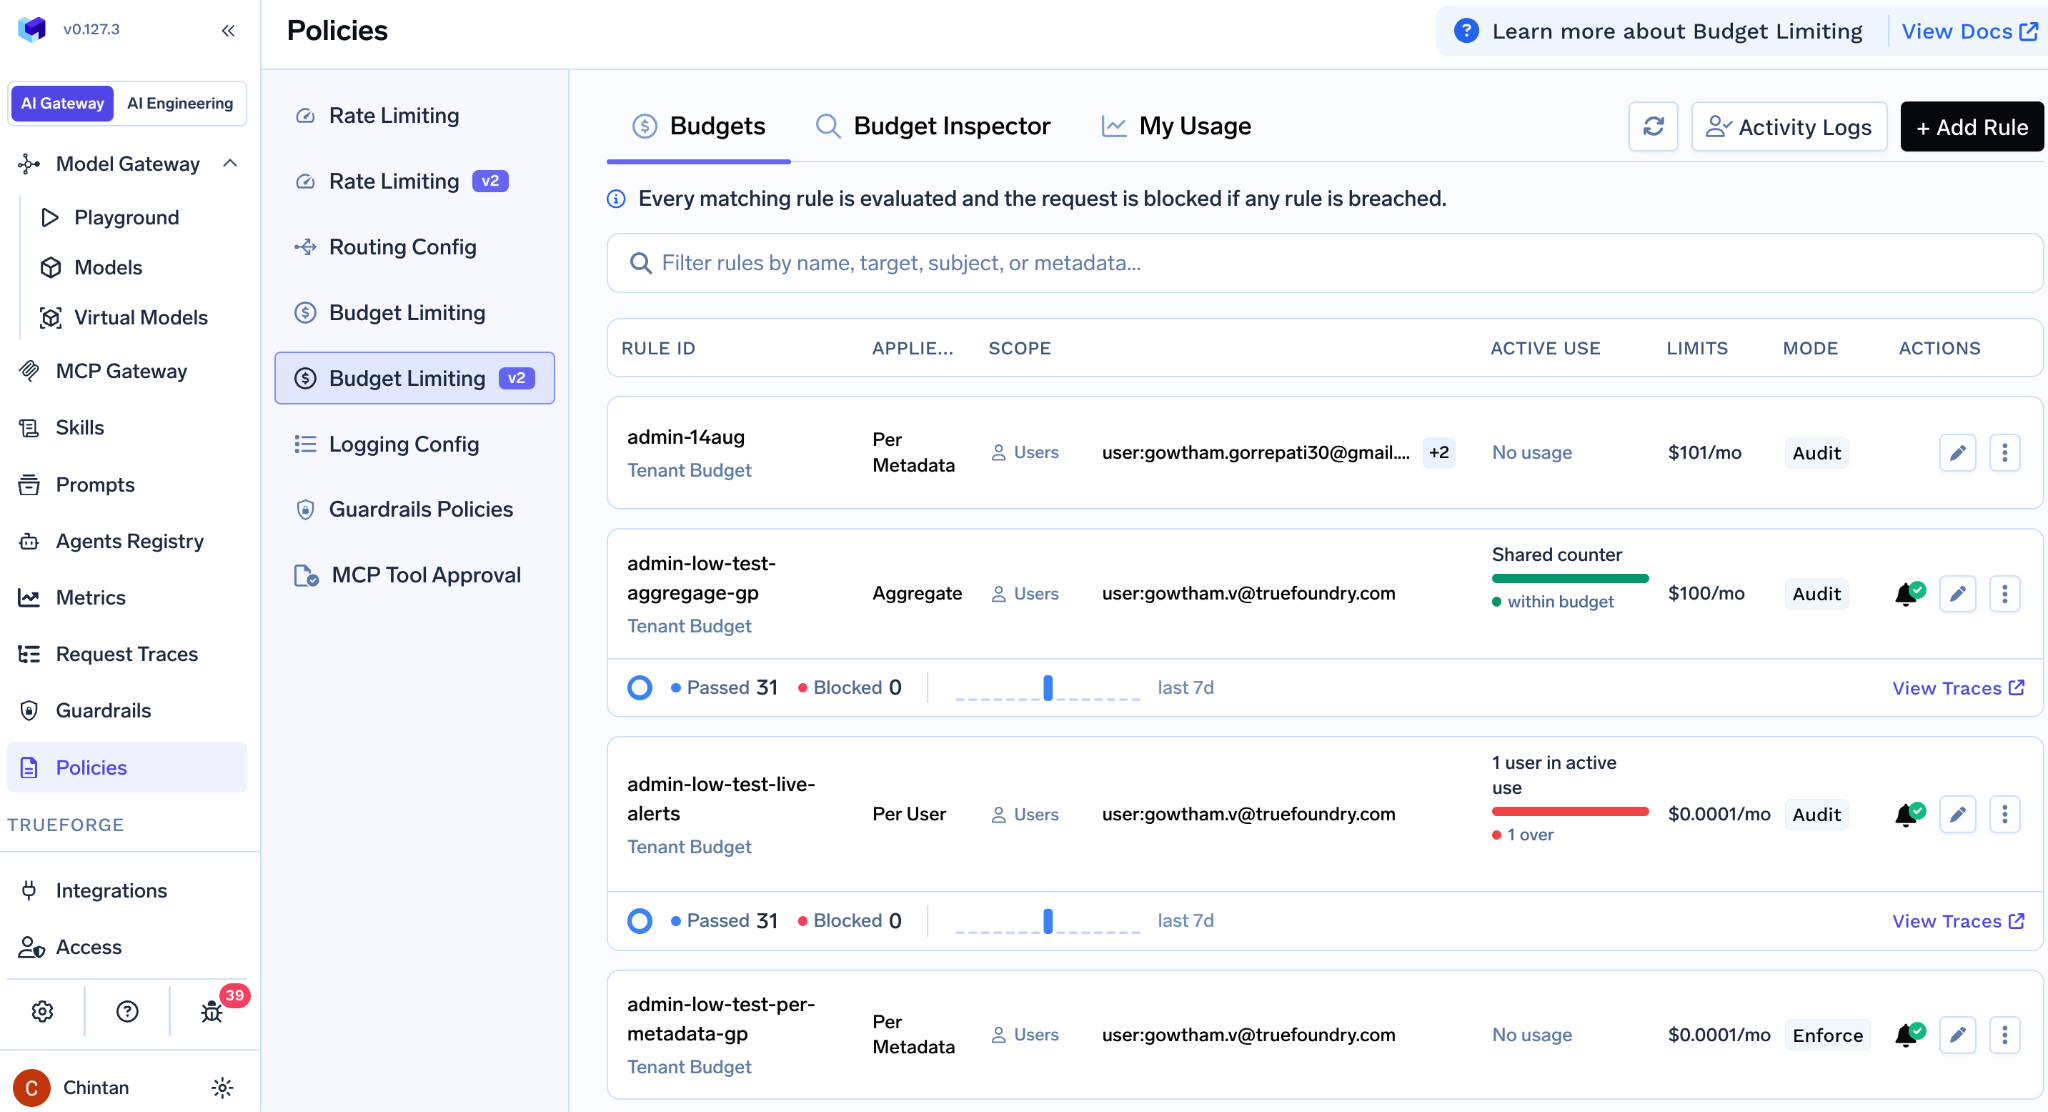
TrueFoundry's native alerting is spend-only: budget milestone alerts at 75, 90, 95 and 100% to email, Slack webhook or Slack bot with per-user templating, on every plan (budget limiting). OpenRouter's notifications are tiered: low-balance, model-deprecation and price-drop emails everywhere; on Business and Enterprise, a workspace budget-limit alert that fires at a share of the budget, per-key spend-limit alerts, and Slack or webhook delivery. Alert-before-block therefore exists on both, but on OpenRouter it is a paid feature. Neither documents alert rules on latency, error rate or guardrail trips; LLM monitoring for reliability is downstream on both, via exported metrics into AlertManager or your APM on our side and via Broadcast on OpenRouter's. How budget alerts connect to hard limits and rate limits is covered in our post on OpenRouter rate limits.
OpenRouter has the only first-party eval product on this heading, and it is adjacent to the API rather than part of it. Ori Eval is a CLI that scans a codebase for every model call, interviews you, writes eval files, runs the agent on your own prompts, asserts on tools called and grades open-ended answers with an LLM judge, with harness and model pinned so result changes are attributable to the model. It routes through OpenRouter, so comparisons span the catalogue, and because evals are code they can be scheduled; OpenRouter describes a beta user whose monthly comparison opens a pull request when a better model appears. The API side has a Report Feedback endpoint, and routing variants, Routers and presets as experimentation primitives; no native A/B traffic split is documented.
TrueFoundry has three real hooks and no eval UI, which we state as plainly as the Ori Eval concession above. A Feedback API attaches 1–5 ratings to any trace via the x-tfy-feedback-target-id response header, root span only for now (feedback for traces). Production traffic seeds an eval set structurally, because the Parquet in your bucket is documented for evaluation via Spark, DuckDB or Athena. And virtual-model traffic splitting is a native experimentation primitive: route a percentage of a virtual model's traffic to a candidate and compare on the same metrics. For LLM evals as a product, both vendors point you at Langfuse, Arize, Braintrust or Weave through trace export.
TrueFoundry documents no hard ceiling; trace retention is configurable per data-routing destination, metrics always go to the default destination with a configurable retention period, and with customer-managed storage the ceiling is your bucket (data routing). Storage cost at scale is not published; compute it from a measured bytes-per-request figure [USER TO FILL]. OpenRouter documents no platform ceiling and no stated retention period for metadata or opted-in content; the analytics activity endpoint's 30-day window is a query window, not a retention statement. Where data is broadcast to your own S3, ClickHouse, BigQuery or Snowflake, retention and cost are yours.
TrueFoundry capabilities are from our documentation; OpenRouter capabilities reflect its publicly documented functionality at the time of writing.
OpenRouter usage tracking is the strongest hosted observability story in this series: Broadcast, the Analytics API's percentiles, Custom Classifiers and Ori Eval are real advantages, and two of them (warehouse sinks and a first-party eval tool) are things TrueFoundry does not offer. TrueFoundry's advantages are the platform kind: a Prometheus endpoint, GenAI-convention spans, attribution to the tool, budget alerts on every plan and raw Parquet in your bucket. Neither samples at capture, neither alerts natively on reliability, and neither documents inbound traceparent propagation. Pick by where your data already lives and by whether you need to own the raw logs.
To see the metrics dashboard, OTel export and tool-level attribution together, explore the TrueFoundry AI Gateway, or book a demo if you want to walk through your own observability stack.
TrueFoundry AI Gateway delivers ~3–4 ms latency, handles 350+ RPS on 1 vCPU, scales horizontally with ease, and is production-ready, while LiteLLM suffers from high latency, struggles beyond moderate RPS, lacks built-in scaling, and is best for light or prototype workloads.


Three ways: the Activity dashboard shows per-request metadata with saveable charts; Usage Accounting returns cost and token counts in each response body; and the Analytics API (beta, management key required) returns spend, tokens, cache-hit rate and P50/P90/P99 latency grouped by up to two dimensions. Prompt and completion content is only captured if an admin enables Input & Output Logging, and not on regional endpoints.
Not by default. OpenRouter always records metadata such as model, tokens, latency and cost, and records prompt and completion content only when Input & Output Logging (beta) is enabled per workspace. Broadcast can export content to a third-party destination you configure, so check the destination's privacy settings as well.
Yes. Broadcast ships traces to 21 destinations including Datadog, Grafana Cloud, Langfuse, New Relic, Arize, an OpenTelemetry Collector, S3, BigQuery and Snowflake, with per-destination sampling and API-key filtering. TrueFoundry exports to the same observability tools via native OTLP, plus Prometheus scraping.
Full request and response logging under a policy you define, a Prometheus /metrics endpoint, native OpenTelemetry traces with GenAI semantic conventions exported to any OTLP backend, cost and latency attribution per user, team, model, MCP server and tool, a built-in metrics dashboard, and integrations with Datadog, Grafana, New Relic, Langfuse, Arize, Honeycomb and others.
Yes. TrueFoundry runs as managed SaaS, in hybrid mode with the gateway in your VPC, or fully self-hosted including air-gapped environments. In hybrid and self-hosted modes, request logs and traces stay in storage you control.
Yes. TrueFoundry includes an MCP Gateway and an Agent Gateway, and observability extends to them: MCP server and tool calls are traced, attributed and metered alongside model calls, which is what makes tool-level cost attribution possible.



The latest news, articles, and resources sent to your inbox