June 20, 2026
|
5 min read

Published: May 21, 2026
Blazingly fast way to build, track and deploy your models!
Gateways are becoming the operational control plane of GenAI systems. They unify traffic for third‑party APIs (OpenAI, Anthropic, Mistral, Bedrock) and self‑hosted models, enforce policy, and expose a single pane of glass for latency, errors, token consumption, and spend. That same choke point is the ideal place to capture traces, compute model‑level and user‑level analytics, and trigger guardrails and alerts—without adding latency to the request path.
Real organizations have learned this the hard way. Consider a support copilot serving thousands of agents. One afternoon, an innocuous prompt update increases output length by ~40%. Agent satisfaction falls as responses lag; finance notices the bill. With gateway observability, you would see p95 latency and output tokens climbing for the affected route, correlate it to the deployment or prompt version, and roll back—ideally with an automated alert set to catch it next time.
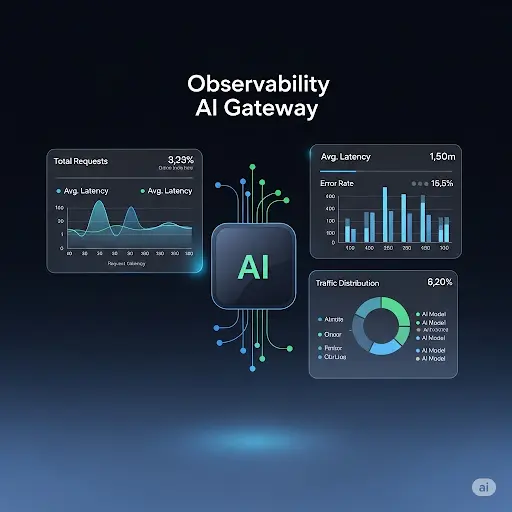
This post recaps what an AI Gateway is, why observability is critical, and the concrete metrics, dashboards, and workflows teams should put in place. We’ll also show how TrueFoundry’s AI Gateway ships the observability stack out of the box: unified analytics (latency, TTFT/ITL, errors), granular cost tracking, customer/user‑level breakdowns, healthy/failed routing visibility, and scalable, low‑overhead collection built into the architecture.
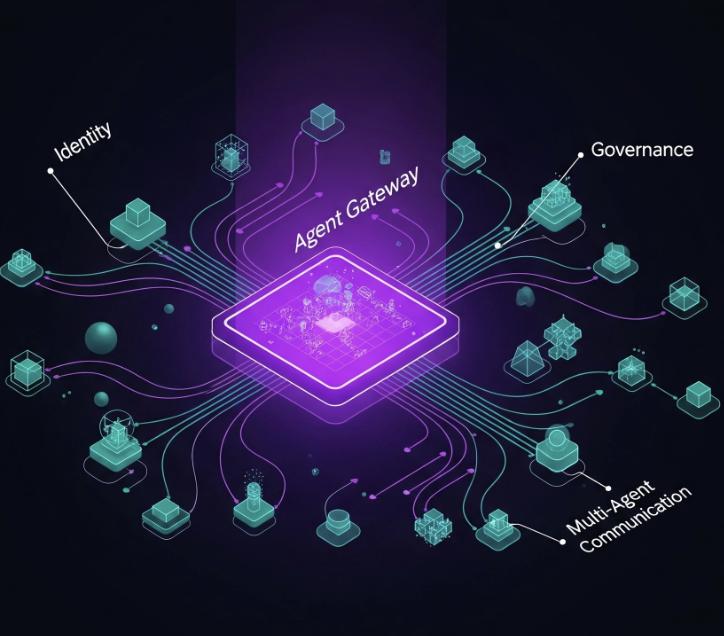
An AI Gateway is a thin, high‑performance layer that proxies application requests to one or more LLM providers or self‑hosted models. It unifies APIs, centralizes authentication and RBAC (Role Based Access Control) , applies rate limits and guardrails, performs load balancing and failover, and captures observability and cost data for every request. Think of it as the “ingress + policy + telemetry” layer for GenAI.
Operationally, modern gateways support weighted and latency‑based routing, health checks, and automatic fallbacks when a model or region is unhealthy—so requests continue even through provider hiccups. Because every request passes through the gateway, teams can compare providers by latency and cost, making OpenRouter vs AI gateway a practical evaluation when deciding how to manage routing, observability, and control at scale.
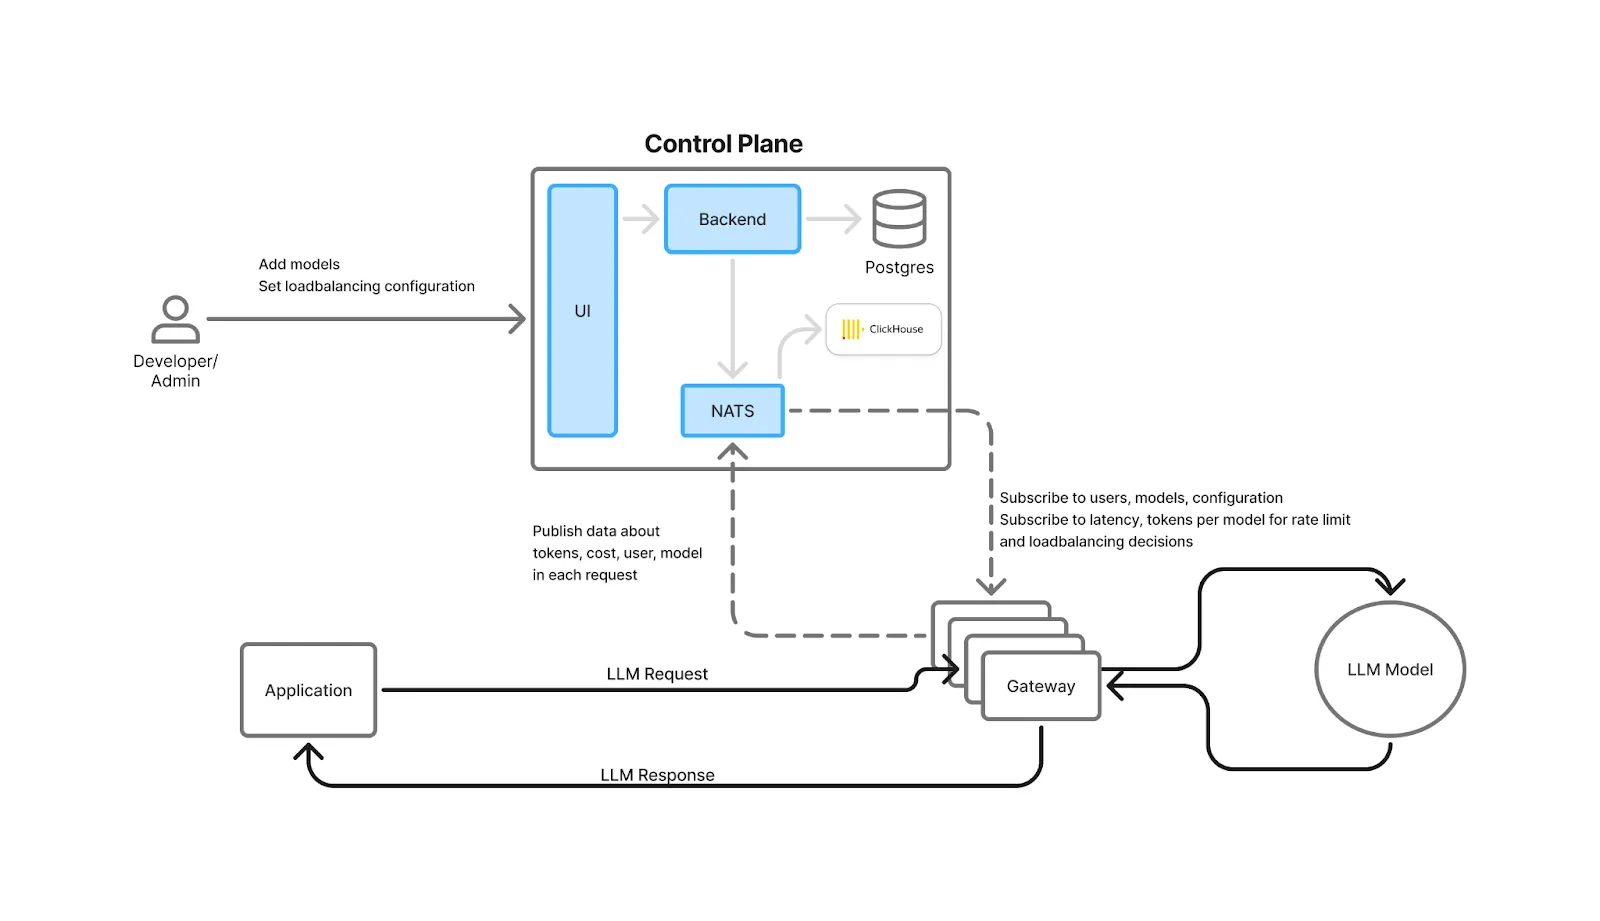
TrueFoundry’s architecture is designed so these controls and metrics add minimal overhead: checks for auth, rate limiting, and load balancing are done in‑memory; logs/metrics are written asynchronously to a queue; and the request path avoids external calls (unless you opt into caching). The gateway is horizontally scalable and CPU‑bound, keeping end‑to‑end latency overhead to single‑digit milliseconds.
LLM latency is multi‑modal: there’s time to first token (TTFT), inter‑token latency (ITL) for streaming, and total request latency. Each affects perceived UX differently. Gateways that track all three help you diagnose whether slowdowns come from provider queues, model compute, network, or prompt length—and choose the best routing strategy.
Tokens are the new CPU cycles. A single prompt can fan out to multiple tools or retrieval steps, and costs accumulate across providers. Observability must attribute spend by model, provider, environment, application, tenant, and user and stay current with providers’ public pricing to avoid manual spreadsheets.
Production apps need guardrails against provider outages, throttling, and model regressions. Observability tied to health checks, 4xx/5xx code breakdowns, retry/fallback rates, and rate‑limit utilization lets you enforce SLOs and automatically fail over when performance deteriorates.
Enterprises need full request/response trails with access controls and PII/content moderation policies. A gateway centralizes this enforcement and logging so teams can prove who called which model, with what data, and what it returned—without sharing provider API keys broadly.
Model quality, pricing, and quotas change frequently. Organizations that instrument gateways can compare providers head‑to‑head and shift traffic based on fresh latency/cost/error data—maintaining performance and margins as the market evolves.
External guidance echoes these needs: industry leaders emphasize AI observability for rapid response to drift, outages, and cost spikes; OpenAI and Azure recommend structured logging and exponential backoff for rate limits, which a gateway can standardize across apps.
Below are capabilities you should expect from a production‑grade AI Gateway—and that TrueFoundry provides natively.
Key Metrics for Evaluating Gateway
| Criteria | What should you evaluate ? | Priority | TrueFoundry |
|---|---|---|---|
| Latency | Adds <10ms p95 overhead for time-to-first-token? | Must Have | ✅ Supported |
| Data Residency | Keeps logs within your region (EU/US)? | Depends on use case | ✅ Supported |
| Latency-Based Routing | Automatically reroutes based on real-time latency/failures? | Must Have | ✅ Supported |
| Key Rotation & Revocation | Rotate or revoke keys without downtime? | Must Have | ✅ Supported |
| Key Rotation & Revocation | Rotate or revoke keys without downtime? | Must Have | ✅ Supported |
| Key Rotation & Revocation | Rotate or revoke keys without downtime? | Must Have | ✅ Supported |
| Key Rotation & Revocation | Rotate or revoke keys without downtime? | Must Have | ✅ Supported |
| Key Rotation & Revocation | Rotate or revoke keys without downtime? | Must Have | ✅ Supported |

Here is how TrueFoundry bakes observability into the core request path and ships a full analytics stack out of the box—without slowing down production traffic.
.webp)
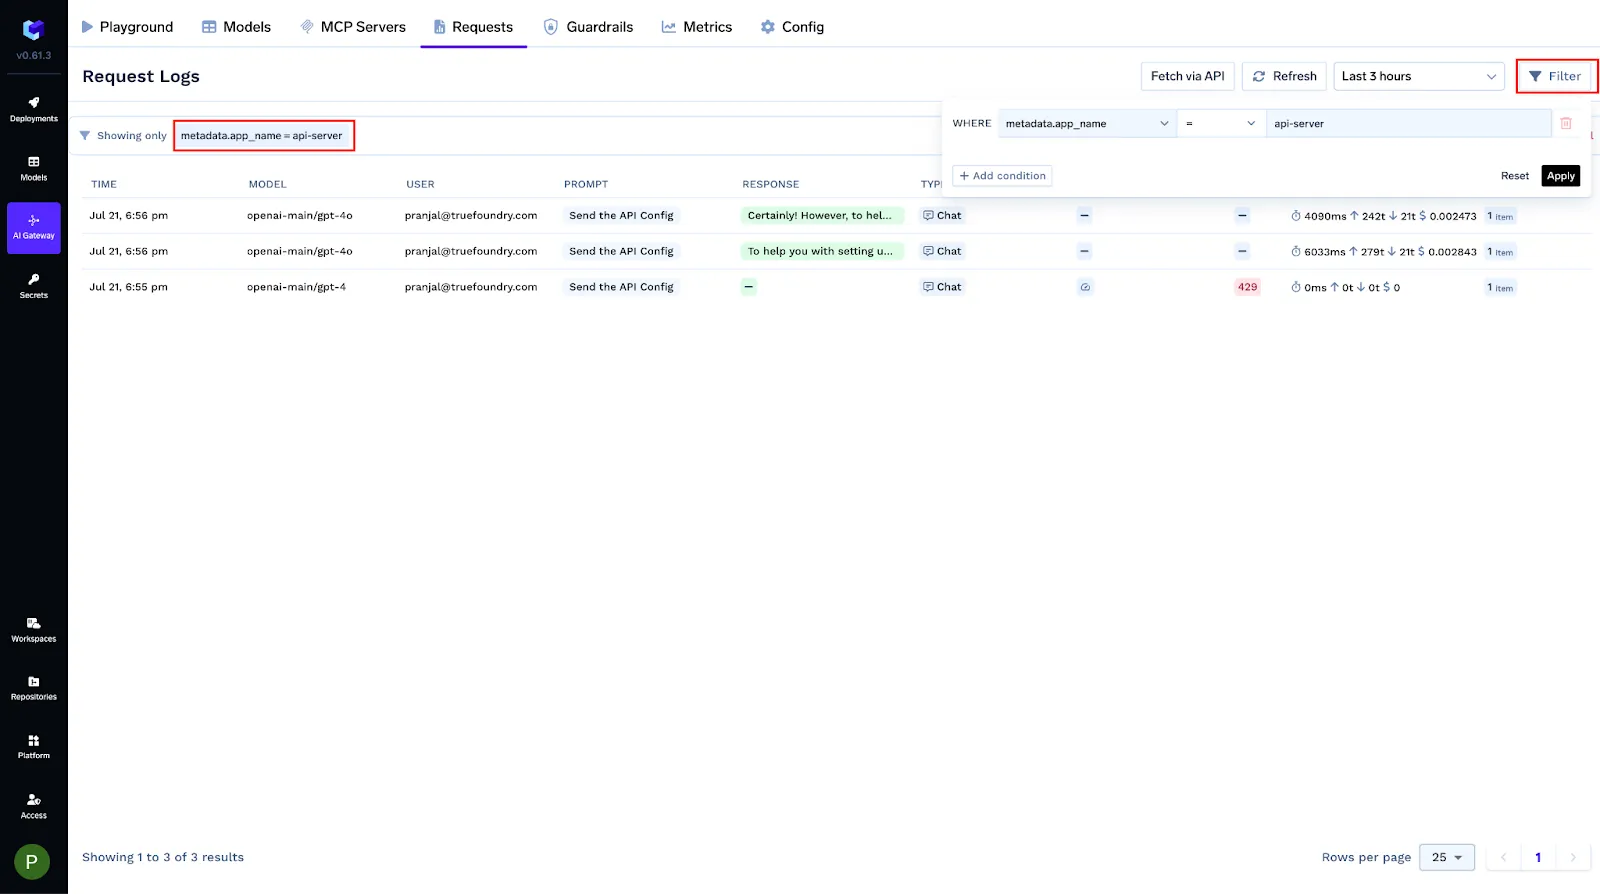
The Analytics dashboard exposes: Request Latency (p50/p95/p99), Time to First Token (TTFT/TTFS), Inter‑Token Latency (ITL), cost per model/provider, input/output tokens, error codes, and policy activity (rate‑limit, load‑balancing, fallbacks, guardrails, budgets). Views slice by model, user, team, ruleId, and custom metadata; you can also download raw CSVs.
Enable Public Cost to auto‑populate per‑token pricing from providers’ published rates (OpenAI, Anthropic, Bedrock, etc.). For negotiated or fine‑tuned models, set Private Cost with custom input/output token prices. Both flow into per‑request and aggregate cost analytics.
Attach business context (customer, feature, environment) and break down tokens, latency, and spend by any dimension—ideal for chargebacks, noisy‑neighbor detection, and prioritizing optimizations.
.webp)
Define quotas by tokens or requests per minute/hour/day, scoped to users, models, or segments identified via metadata. Dashboards show utilization and throttles so you can right‑size limits and protect shared capacity.
Use weight‑based splits for experiments or latency‑based routing for steady‑state. Health checks mark backends unhealthy on error/latency thresholds and exclude them automatically. Fallback chains retry on failure, with spans and metrics that show which path was taken and its latency/cost impact.
Centralize provider keys, issue scoped access tokens, enforce RBAC, and retain immutable request/response logs for compliance—across LLMs and MCP servers
You can tag every request with structured metadata via the X-TFY-METADATA header. Logged keys become queryable filters, Grafana labels, and conditions in gateway configs (rate limits, load balancing, fallbacks, guardrails). Values are strings (≤128 chars).
X-TFY-METADATA: {"tfy_log_request":"true","environment":"staging","feature":"countdown-bot","customer_id":"acme-42"}


Use this to isolate logs, group cost/latency by tenant or feature, and roll out policy changes safely to a subset of traffic.

Example — rate‑limit by metadata

name: ratelimiting-config
type: gateway-rate-limiting-config
rules:
  - id: openai-gpt4-dev-env
    when:
      models: ["openai-main/gpt4"]
      metadata:
        env: dev
    limit_to: 1000
    unit: requests_per_day
The same when metadata pattern applies to load balancing and fallback rules
The gateway is OpenTelemetry‑compliant. Turn on OTLP export and send traces to any backend (Tempo, Jaeger, Datadog/New Relic via Collector, TrueFoundry Tracing). Spans include genai attributes—model, tokens, TTFT, ITL, parameters, tool calls, errors—and detailed spans for rate limiting, load balancing, fallbacks, and MCP server/tool calls, letting you correlate provider behavior with app‑level spans.
Enable tracing
ENABLE_OTEL_TRACING="true"
OTEL_SERVICE_NAME=<your_service>
OTEL_EXPORTER_OTLP_TRACES_ENDPOINT="https://<otel-collector>/v1/traces"
OTEL_EXPORTER_OTLP_TRACES_HEADERS="Authorization=Bearer <token>"
Representative spans
.webp)
Expose /metrics for Prometheus or push OTEL metrics by setting:

ENABLE_OTEL_METRICS="true"
OTEL_EXPORTER_OTLP_METRICS_ENDPOINT="https://<otlp-endpoint>/v1/metrics"
OTEL_EXPORTER_OTLP_METRICS_HEADERS="Authorization=Bearer <token>"
LLM_GATEWAY_METADATA_LOGGING_KEYS='["customer_id","request_type"]'

Metadata keys listed in LLM_GATEWAY_METADATA_LOGGING_KEYS become Prometheus labels llm_gateway_metadata_<key>, enabling per‑customer/per‑feature cost and latency charts. (Truefoundry Docs)
Metadata keys listed in LLM_GATEWAY_METADATA_LOGGING_KEYS become Prometheus labels llm_gateway_metadata_<key>, enabling per‑customer/per‑feature cost and latency charts. (Truefoundry Docs)
Key metric families (subset)
Tokens & cost: llm_gateway_input_tokens, llm_gateway_output_tokens, llm_gateway_request_cost.
Latency: llm_gateway_request_processing_ms, llm_gateway_first_token_latency_ms, llm_gateway_inter_token_latency_ms.
Errors: llm_gateway_request_model_inference_failure, llm_gateway_config_parsing_failures.
Policy activity: llm_gateway_rate_limit_requests_total, llm_gateway_load_balanced_requests_total, llm_gateway_fallback_requests_total, llm_gateway_budget_requests_total, llm_gateway_guardrails_requests_total.
Agent/MCP: llm_gateway_agent_request_duration_ms, llm_gateway_agent_llm_latency_ms, llm_gateway_agent_tool_latency_ms, llm_gateway_agent_tool_calls_total, llm_gateway_agent_mcp_connect_latency_ms, llm_gateway_agent_request_iteration_limit_reached_total.
A pre‑built Grafana dashboard JSON is published by TrueFoundry, organized into Model, User, Config, and MCP Invocation views. Add variables for your custom metadata, e.g.:
label_values(llm_gateway_input_tokens, llm_gateway_metadata_customer_id).webp)
Anthropic’s Model Context Protocol (MCP)—announced November 25, 2024—standardizes how assistants connect to tools, prompts, and resources. The ecosystem has accelerated through 2025 with many prebuilt servers (GitHub, Slack, Google Maps, Puppeteer, etc.).
TrueFoundry integrates MCP natively:
This makes the gateway the operational control plane for agentic workloads—unifying policy, auth, routing, and end‑to‑end visibility across both LLM calls and tool executions.
Below is a practical checklist. Each metric includes what it tells you, how to use it, and how TrueFoundry surfaces it.
A prompt change increases output verbosity for enterprise customers. Symptoms: rising output tokens, higher p95 latency, and daily spend. Action with TrueFoundry: Analytics shows a jump in output tokens for the “support‑prod” environment and a cost surge for the primary model. You compare an alternate provider that shows lower TTFT and cheaper output tokens; you shift 30% of traffic via weight‑based routing and set an alert on “cost per conversation.”
At 10:00 IST, error rates climbed to 429s. Action with TrueFoundry: Rate‑limit dashboards confirm throttles from the upstream. Fallback chains kick in, and routing shifts toward a healthier backend. You keep user experience stable and later tune token quotas and backoff parameters.
Users report “the answer starts fast but then crawls.” Action with TrueFoundry: TTFT is fine, but ITL is elevated on the primary model. Latency‑based routing automatically prefers a provider with better streaming throughput; you also set an alert on ITL p95.
One customer’s batch job hogs tokens and slows everyone else. Action with TrueFoundry: Token‑based rate limits by customers enforce fair‑share and protect SLOs; analytics verify utilization and rejected counts so you can upsell higher quotas.
LLM applications are dynamic systems. Models evolve, providers change quotas and prices, prompts morph, and user behavior surprises you. The best AI gateway is where you can observe, control, and optimize all of it—if you collect the right signals and turn them into actions.
TrueFoundry’s AI Gateway gives you that operational command center. It captures latency (TTFT/ITL), tokens, cost, and errors with low overhead; enforces token‑aware rate limits, RBAC, and guardrails; and provides routing, health, and fallback visibility so you can keep experiences fast, reliable, and cost‑efficient. With granular customer/user analytics and automated, up‑to‑date cost attribution, teams can move from reactive firefighting to proactive optimization.
If you’re centralizing your GenAI stack—or untangling a sprawl of one‑off integrations—start by routing traffic through the gateway, turn on the dashboards above, and set a few SLO‑aligned alerts. You’ll gain the visibility to ship faster, contain costs, and keep your agents and users delighted.
Observability in AI gateway helps trace complex multi-step reasoning and tool invocations that are otherwise opaque. Monitoring agent execution paths helps detect infinite loops, hallucinations, and inefficient tool usage in real time. This visibility ensures that autonomous agents remain reliable, predictable, and within budget while interacting with diverse external systems and APIs.
AI gateway observability optimizes LLM performance by providing real-time tracking of latency, throughput, and error rates across different model providers. By capturing granular metrics like Time to First Token (TTFT) and Inter-Token Latency (ITL), teams can pinpoint specific bottlenecks in the inference chain. These insights enable developers to compare model speeds objectively and implement smart routing to ensure high-speed performance for end users.
AI gateway observability reduces costs by providing granular visibility into token consumption across models, teams, and users. Tracking spend per request and workspace enables teams to identify runaway prompts or inefficient workflows immediately. This data supports automated cost-saving strategies like semantic caching, token-aware rate limiting, and routing queries to more affordable models without manual intervention.
AI gateway observability supports compliance auditing by maintaining a centralized, immutable log of every request and response. Modern systems record detailed audit trails, including user IDs, timestamps, and PII masking events to protect sensitive data. These logs ensure enterprises meet regulatory standards like GDPR and SOC 2 by providing full transparency into model interactions, often while keeping all telemetry within the organization's secure cloud environment.
TrueFoundry simplifies AI infrastructure management by unifying multiple model providers into a single control plane through observability in AI gateways. TrueFoundry correlates request-level telemetry with GPU and CPU utilization to optimize resource allocation and reduce waste. This integrated approach allows platform teams to manage deployments, scaling, and security policies across diverse environments natively within their AWS, GCP, or Azure accounts.
TrueFoundry AI Gateway delivers ~3–4 ms latency, handles 350+ RPS on 1 vCPU, scales horizontally with ease, and is production-ready, while LiteLLM suffers from high latency, struggles beyond moderate RPS, lacks built-in scaling, and is best for light or prototype workloads.


The latest news, articles, and resources sent to your inbox
© 2026 All rights reserved.


.webp)
.webp)
.webp)
.webp)
.webp)

.webp)

.webp)
.webp)