July 25, 2026
|
5 min de lecture


Accédez instantanément à un environnement TrueFoundry en direct. Déployez des modèles, acheminez le trafic LLM et explorez la plateforme complète : votre sandbox est prête en quelques secondes, aucune carte de crédit n'est requise.


Published: April 27, 2026
.webp)
Une méthode incroyablement rapide pour créer, suivre et déployer vos modèles !
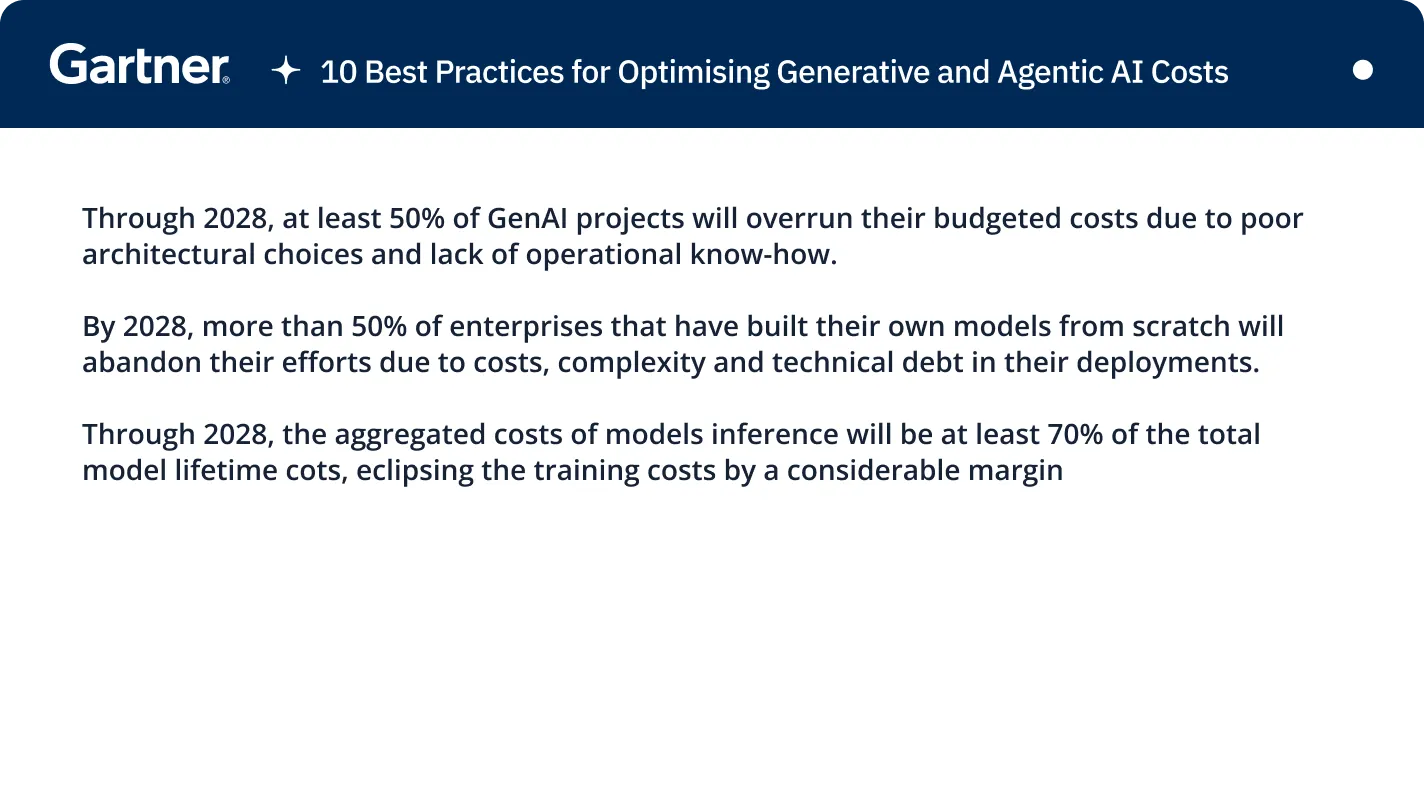
Your dashboard indicates good performance, with all performance metrics (latency: 200ms; error rates: 0.01%; resource utilization: within limits) showing that your AI system is functioning well.
However, we still see issues:
From a technical standpoint, nothing crashed or timed out. The system returned a 200. However, simply functioning correctly is not enough for AI applications that make decisions rather than only serve data.
AI observability was built to address this gap, addressing the failure of traditional monitoring to adequately handle AI models. This document will define what is AI observability; describe the inadequacy of traditional monitoring tools for AI; outline the core components needed; and provide examples of how enterprise teams are developing the necessary visibility to deploy AI applications reliably and efficiently
.webp)
AI observability is the practice of making artificial intelligence systems transparent and measurable in AI deployment. The full answer to what is AI observability goes beyond dashboards and latency charts. It provides engineering teams with insight into what an AI system is doing, how it arrived at an output, and what that output is expected to be in terms of quality, safety, and cost efficiency. Understanding AI observability meaning is essential for any enterprise running AI models in production.
To fully answer what is AI observability, it helps to break it into three signal dimensions that can be collected and analyzed:
Most teams only achieve the first layer. Some reach the second. Very few track model performance at all three levels simultaneously. Very few run the third in production. The majority of AI failures occur in the gap between "we log prompts and completions" and "we can determine whether the output we produced meets the required quality metrics”.
Understanding what is AI observability starts by understanding this gap. The gap between traditional monitoring and AI observability comes down to a fundamental difference in how AI systems fail.
Traditional software runs in a deterministic way. The same input yields the same output every time. When something goes wrong in traditional software, you see a sudden rise in a metric, a thrown exception, or a stack trace identifying where in the code the issue occurred.
AI models powered by machine learning are probabilistic. The same prompt can produce different outputs depending on model temperature, the documents retrieved, and which model version is running. An AI system can provide users with incorrect, irrelevant, or dangerous information while still reporting zero errors to your monitoring stack.
There is no "hallucination detected" error type. When the model fabricates a non-existent policy definition, your monitoring stack sees a clean 200, not an error spike. There will be no error spike when the context returned from a retrieval step runs on an out-of-date document set. Your alerting mechanism will provide no indication that a prompt regression has caused a 25% decline in response quality after a model update.
Traditional monitoring dashboards are unable to detect semantic failures. They will not indicate that the context returned is incorrect, that the model failed to consider the context provided, that prompt injections are hidden within a retrieved chunk of text, or that output quality is declining as actual user input distributions diverge from those used during testing.
AI systems break this assumption in a few specific ways:
.webp)
Traditional monitoring has three pillars: metrics, logs, and traces. Part of answering what is AI observability is understanding its four pillars. AI observability retains these three sources of information and redefines how they should be implemented. A fourth source of information: evaluations: cannot be mapped to any equivalent in the infrastructure monitoring space.
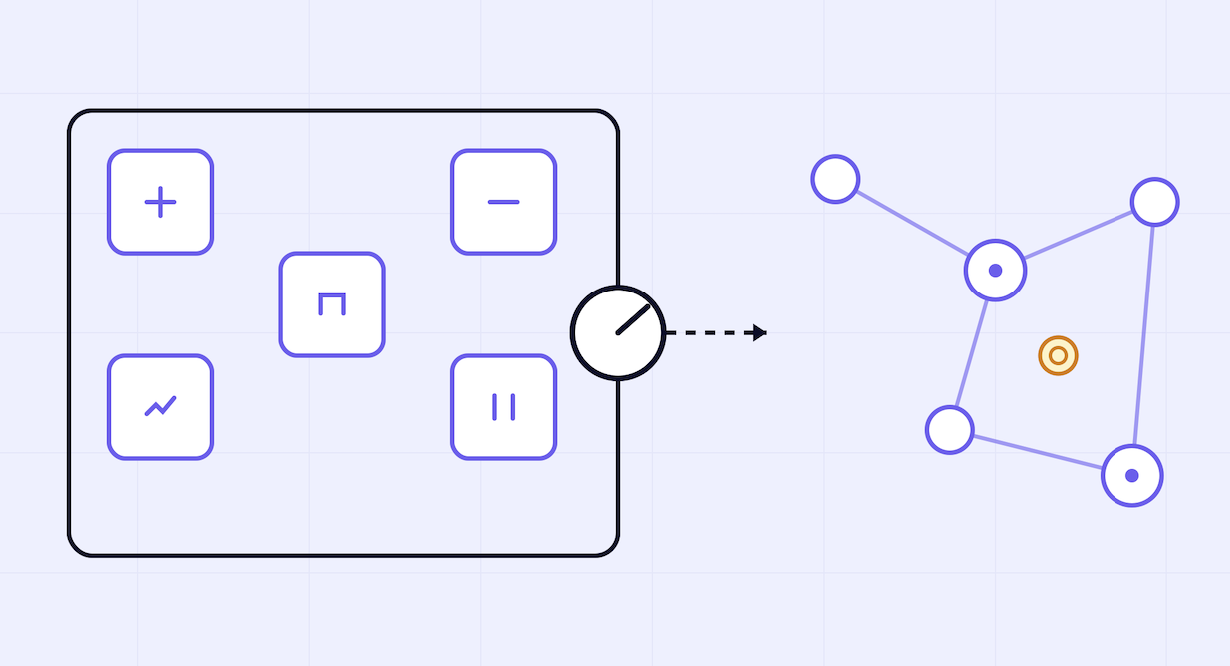
A trace illustrates everything that happens throughout the lifecycle of an individual request: the user input, all intermediate steps, and the final response. For traditional software, this includes just one or two hops. In an AI agent system, a single user request can trigger a multitude of LLM invocation calls, tool executions, retrieve actions, and sub-agent tasks, each creating its own span with corresponding time, input data, and output.
This matters because when a final response is wrong, the source of the bug can exist anywhere in that chain. Retrieval might return wrong documents. The reranker might have deprioritized correct chunks. The model might have omitted necessary context. The AI agent might have called the wrong tool. Without a trace representing every single step, debugging a wrong answer turns into guessing. With a trace, you can identify the specific span where the error occurred.
Traces address the basic debugging question: what happened, when, in what sequence, and what portion of the overall response times did each step contribute? Traces serve as the foundation upon which every other AI observability capability is built
Metrics for AI models exist at three different tiers. The tier that most teams fail to implement is the one that matters most for business outcomes.
The first tier (Performance Metrics) covers familiar measures such as P50, P90, and P99 latency, time-to-first-token, and throughput across providers and AI models. Every team has performance monitoring at this tier.
The second tier (Cost Metrics) involves tracking token usage by request, user, team, and application. Knowing the total spent on tokens is not sufficient for cost control. You need to understand which workflows are responsible for consumption. These are key metrics for governing AI deployment spend.
Most teams have a gap at the third tier (Quality Metrics). These key performance indicators measure how well the AI system has performed over time: hallucination rates, relevance of retrieved context, and the rate at which the AI completes a request without producing an accurate answer. Running these against real time production traffic rather than test sets is the distinction that separates genuine AI observability from basic performance monitoring.
AI logs show the actual content that was generated as a result of every prompt sent and every response received versus just showing the metadata information about whether a call was made. The distinction between these two types of information is important for two reasons:
In debugging mode, you need to see the complete picture: what was included in the system prompt, which documents were retrieved and injected, what the model returned, which tools the AI agent called, and in what order. If only system metadata is logged, you can identify that something went wrong but may have no way to determine specifically what failed. This is one of the unique challenges of AI observability compared to traditional monitoring tools.
In terms of compliance, logs act as the audit trail. Regulated industries must demonstrate which sensitive data was passed to which model, when it was passed, and by whom. This requires detailed audit trails tied to user identity, team, model version, and environment: not just a timestamp and a success or failure code.
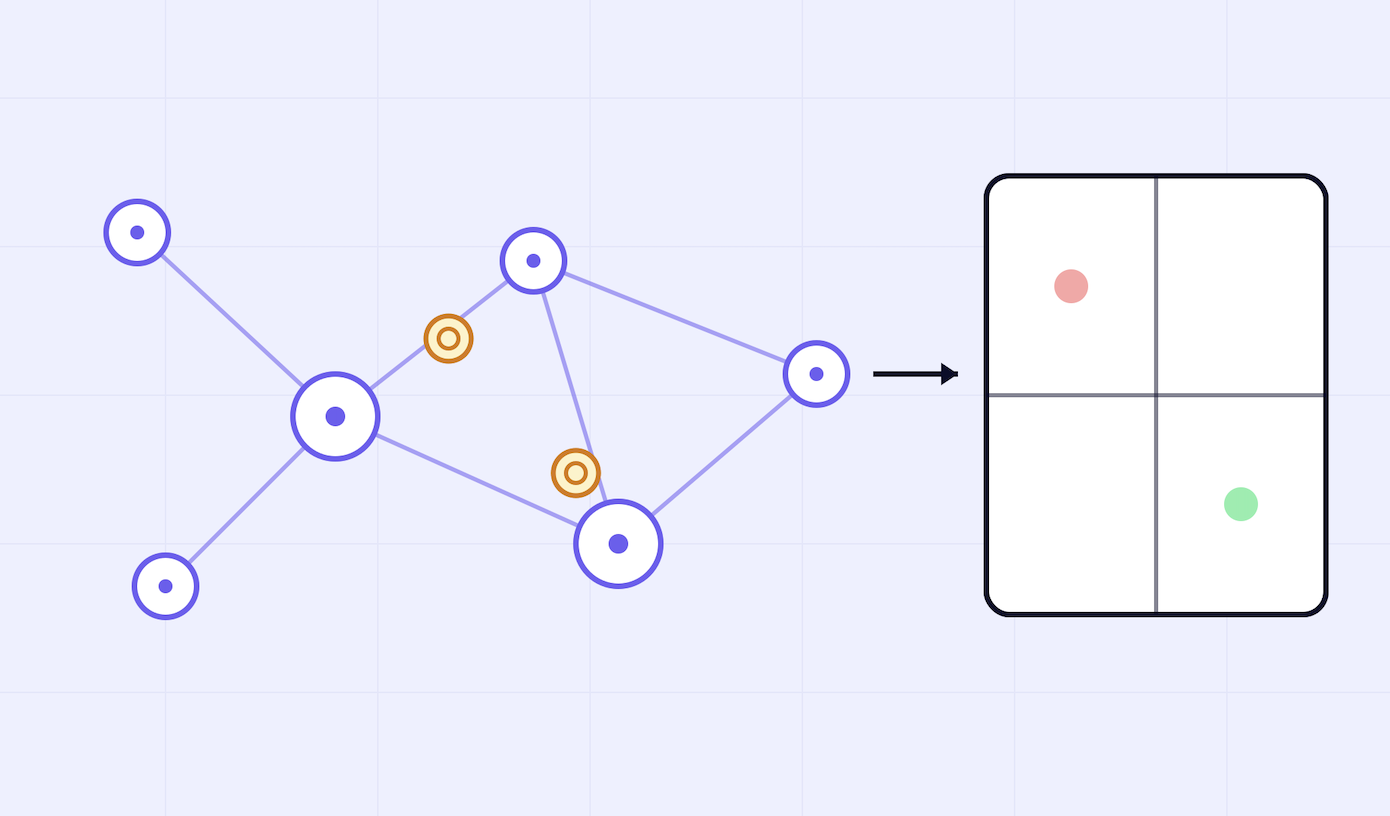
Traditional monitoring tools have no corresponding pillar. Evaluations are automated scoring functions applied to model outputs to measure whether those outputs meet established quality metrics without requiring continued human inspection.
Common evaluation types include faithfulness (is the response grounded in the retrieved source documents?), answer relevancy (is the answer responsive to the user input?), hallucination detection (does it contain unsubstantiated claims?), and safety checks (does it conform to established content policies?).
What makes production evaluations different from pre-deployment benchmarks is continuity. A model that performs well on a test set may perform poorly in production, especially after deploying new models, because real user input distributions do not match the distributions used for testing.
This performance degradation will not appear on an error rate chart, making it invisible to traditional monitoring dashboards. When evaluation scores drop below defined thresholds, alerts are triggered. This creates a closed-loop system for operational quality metrics rather than a quarterly review cycle. This approach is foundational to responsible AI development at scale, and is central to what is AI observability delivering on its promise of continuous improvement and actionable insights through structured feedback loops
.webp)
What is AI observability compared to traditional monitoring? The answer is clearest when you see both applied to the same system. AI observability and traditional monitoring can analyze the same AI system and yield completely different results.
In monitoring, you may see that a request took 2.1 seconds to complete. AI observability also tells you why that request was delayed due to a slow retrieval step, what context was retrieved, and whether that context actually helped answer the user query. The reported latency gives you a number. It does not tell you whether the answer was worth the time delay, which is a key performance indicator for user experience.
While monitoring may report zero errors at the model level, AI observability provides the same model's hallucination rate, the presence of prompt injection attempts within retrieved documents, and the occurrence of three times the average cost within a particular AI agent workflow as a result of those attempted injections. None of these would appear as infrastructure errors, making AI observability essential for genuine root cause analysis and identifying root causes before they affect users.
In monitoring you may have logs confirming a model was called. AI observability provides not only information about the model but also detail regarding which AI agent called the tool, what was expected at the time of the call, and what was ultimately returned to the agent. This level of observability data is foundational for diagnosing performance issues in AI applications.
Monitoring confirms that the system is present. AI observability confirms whether that system should still be running. Without it, every AI model is effectively a black box to the teams responsible for its outputs. This is precisely what is AI observability designed to address
Teams asking what is AI observability often discover the answer by encountering its gaps. Point tools in the AI observability space address specific use cases well but operate in isolation when deployed alone. Prompt tracing gives you a record of what was sent and received. Observability platforms built for evaluation will score outputs after the fact. Cost tracking proxies log token usage. All of these apply well to specific use cases within an organization releasing one LLM feature.
As AI applications become more complex, the limitations of point tools become more apparent. Multi-model, multi-AI agent, or workflow systems on shared infrastructure need more than visibility. They require cost control, access control, and compliance readiness within the same observability solutions to operate effectively.
When scaling across the business, these gaps emerge:
1. Cost attribution is limited: Some reporting tools provide total token spend grouped by model. Very few provide breakdowns by team, workflow, or user session. Without this, cost control across business operations is impossible.
2. Compliance is an afterthought: There are no immutable detailed audit trails, PII redaction, or data residency controls: even for sensitive data. As a result, teams create parallel systems purely for compliance purposes, violating observability practices that should be built in.
3. Agent and MCP coverage is inadequate: Most AI observability tools were built for single-turn prompt and completion pairs. Multi-step AI agent traces, tool selection decisions, and visibility across multiple MCP servers are unavailable or fragile.
4. Access controls do not scale: There is no role-based access, project-level isolation, or SSO functionality in most observability tools. Proof-of-concepts pass without any review of security access or compliance requirements, creating performance issues downstream.
As a consequence, teams fill the gaps with additional software to track compliance, cost allocations, and custom evaluation methods. These solutions require time and resources to build and maintain, and they fail to create a single point of visibility into AI initiatives across artificial intelligence applications used by the organization.
.webp)
For teams that need a complete answer to what is AI observability in practice, TrueFoundry demonstrates it through production. As one of the most complete AI observability tools for enterprise production systems in 2026, TrueFoundry's AI Gateway offers built-in observability supports to track every LLM request, tool execution, and AI agent execution without requiring a separate SDK or manual instrumentation.
All observability data (prompts, responses, agent traces) remains in your private cloud environment, where you have complete control over it.
Performance dashboards for P50, P90, and P99: Latency, error rates, and throughput metrics are tracked per model and per provider, grouped by team or business unit. This enables teams to identify performance degradation, track model drift, monitor GPU utilization, and address performance issues before they reach users. Memory usage and system health are surfaced in the same monitoring dashboards.
TrueFoundry AI Gateway offre une latence d'environ 3 à 4 ms, gère plus de 350 RPS sur 1 processeur virtuel, évolue horizontalement facilement et est prête pour la production, tandis que LiteLM souffre d'une latence élevée, peine à dépasser un RPS modéré, ne dispose pas d'une mise à l'échelle intégrée et convient parfaitement aux charges de travail légères ou aux prototypes.


Les dernières nouvelles, articles et ressources envoyés dans votre boîte de réception
.webp)