Obtenga acceso instantáneo a un entorno TrueFoundry en vivo. Implemente modelos, dirija el tráfico de LLM y explore la plataforma completa: su sandbox estará listo en segundos, sin necesidad de tarjeta de crédito.
9,9
Evaluación comparativa de LLM para producción empresarial: Cómo evaluar modelos para su caso de uso real
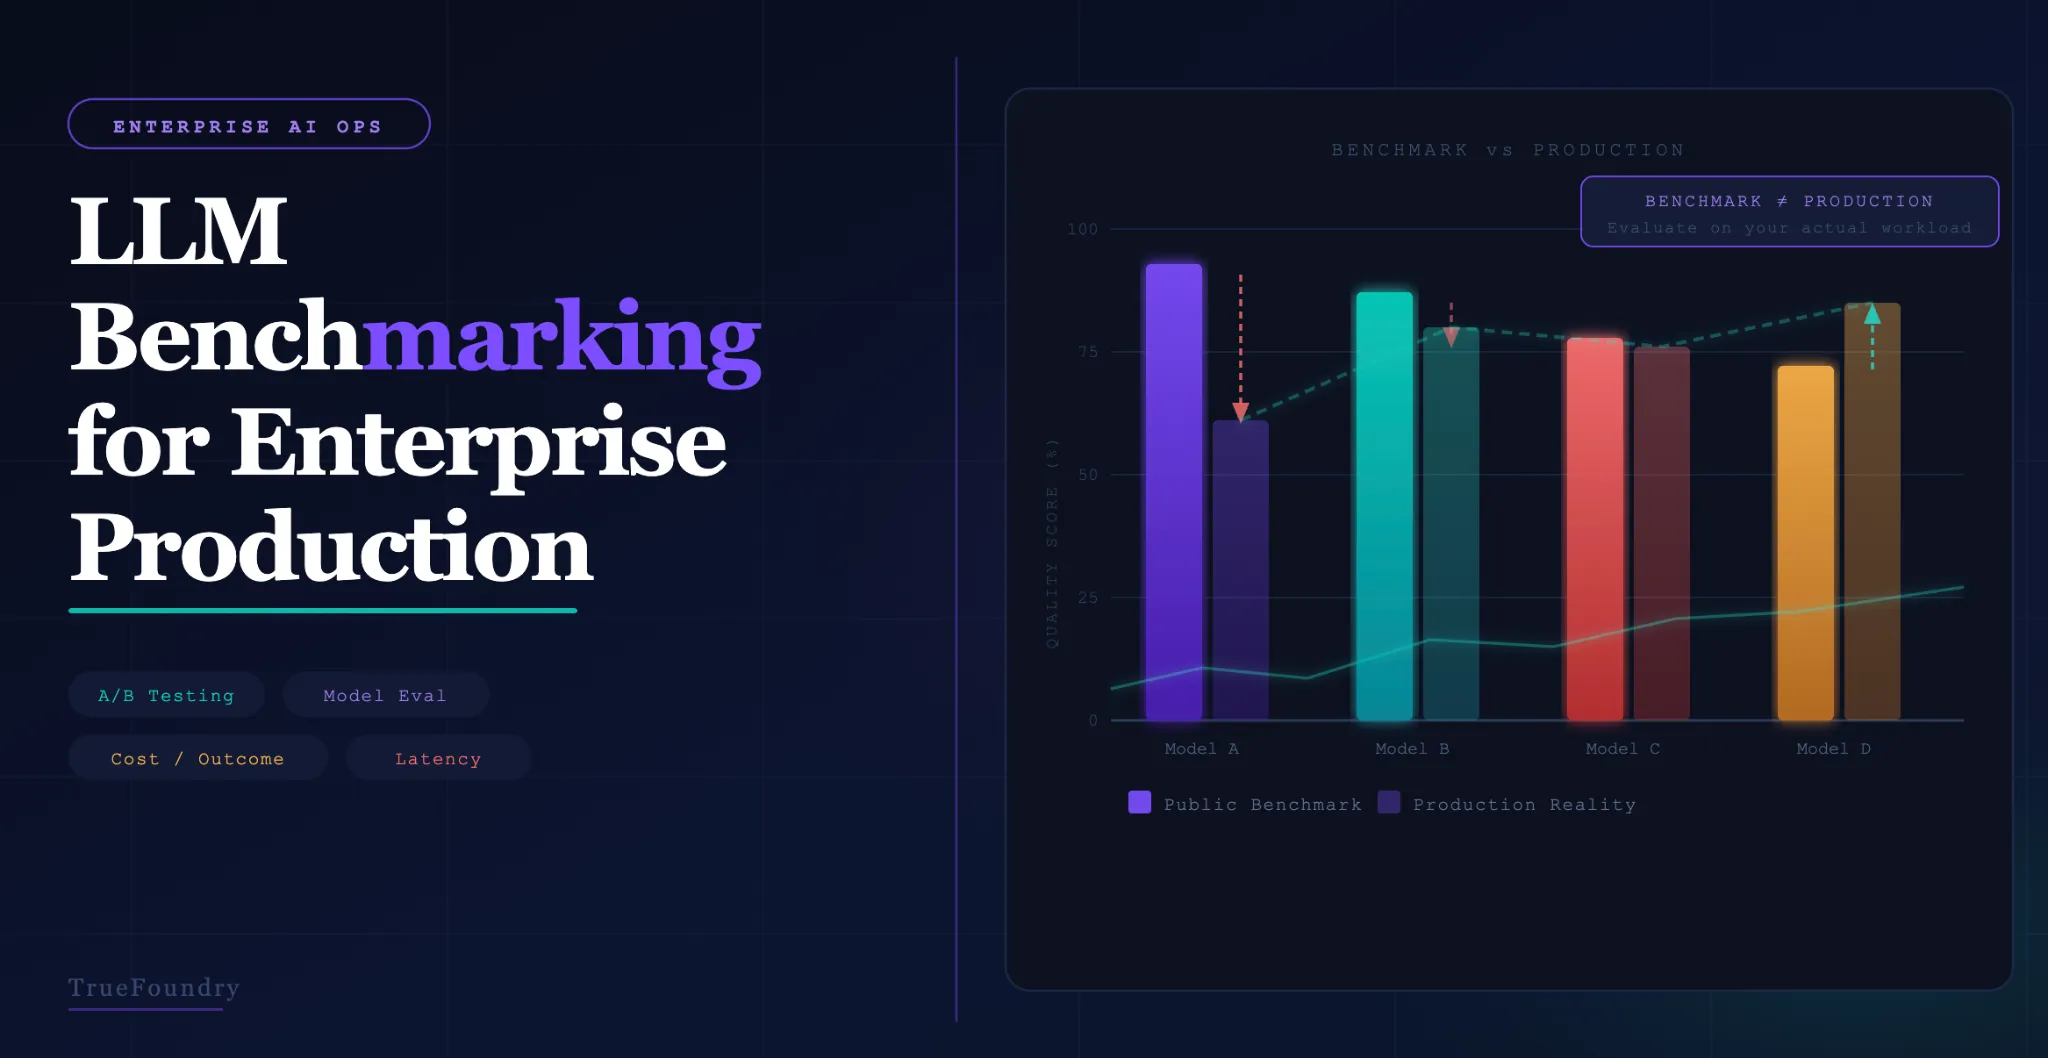
Los puntos de referencia públicos de LLM miden lo que les importa a los investigadores de IA: razonamiento a nivel de posgrado, generación de código en problemas canónicos, calidad de traducción multilingüe. Útil para enmarcar capacidades en abstracto. Frecuentemente engañoso cuando se usa para tomar decisiones de adquisición empresarial, porque el punto de referencia mide una distribución de tareas que probablemente no comparte casi nada con su carga de trabajo específica. Un modelo que ocupa el primer lugar en MMLU puede producir peores resultados que un modelo más barato en su carga de trabajo de resumen de documentos, simplemente porque sus documentos tienen características diferentes a las del conjunto de pruebas del punto de referencia.
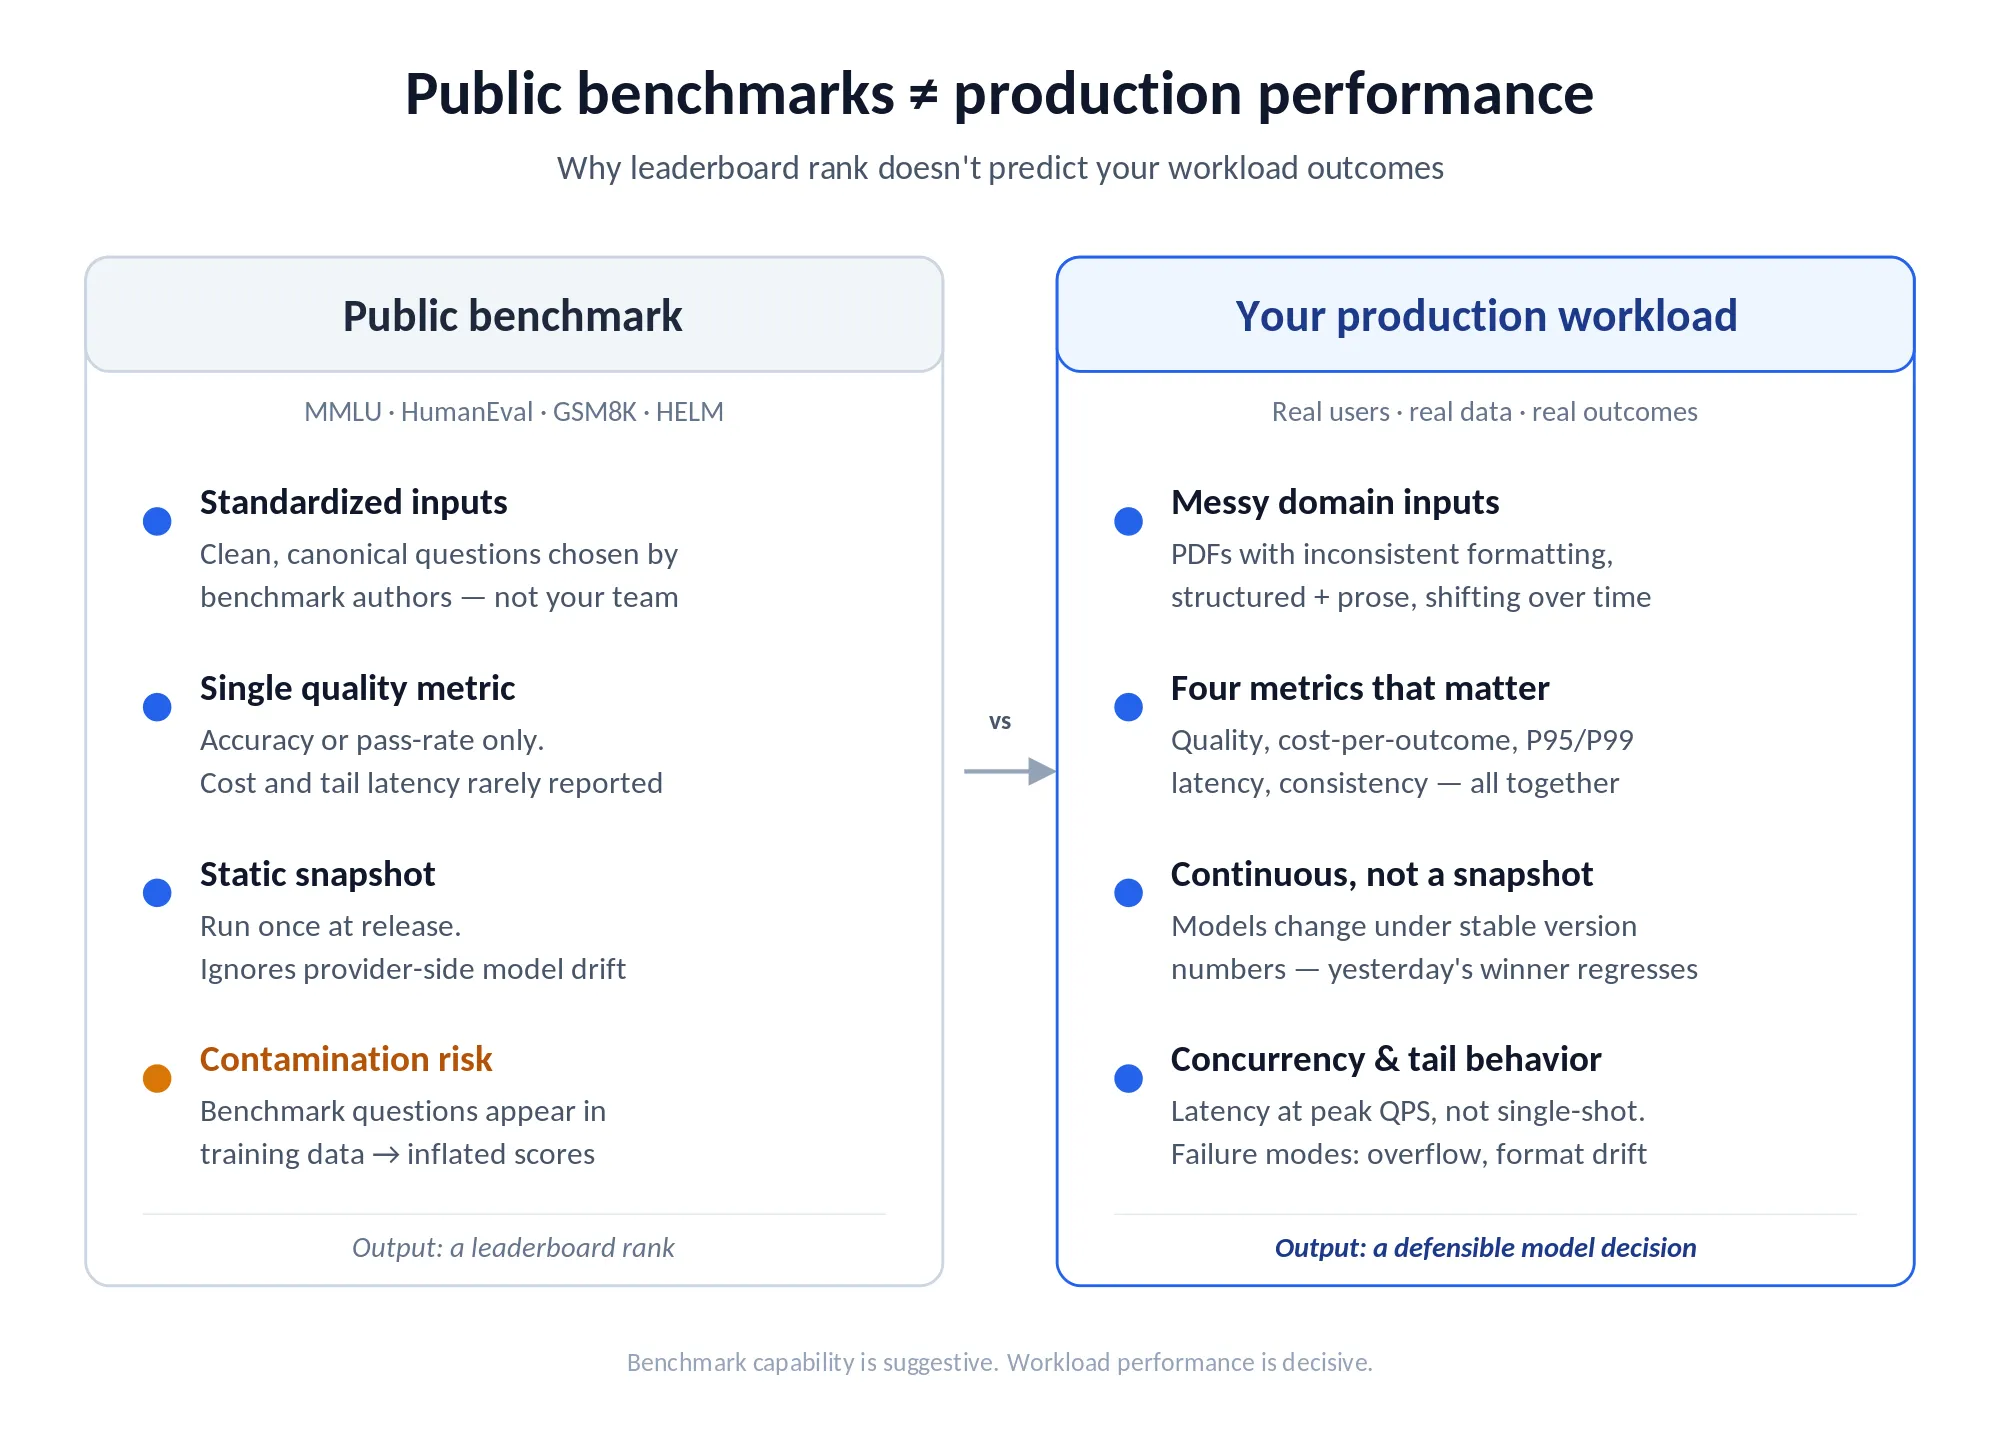
La brecha entre el rendimiento de los puntos de referencia públicos y el rendimiento en producción no es un problema menor de calibración. Es estructural. Los puntos de referencia utilizan datos estandarizados y limpios. Los datos de producción son desordenados. Específicos del dominio. Siguiendo distribuciones que los diseñadores de puntos de referencia no anticiparon. Los puntos de referencia miden la precisión en tareas canónicas. Los sistemas de producción deben satisfacer requisitos organizacionales de formato de salida, tono y consistencia que ningún punto de referencia público captura. Y los puntos de referencia son instantáneas estáticas, mientras que el rendimiento en producción cambia a medida que los proveedores de modelos actualizan sus modelos y su distribución de datos evoluciona.
Esta guía cubre cómo construir un marco de evaluación de LLM empresarial que genera una señal significativa para las decisiones de selección y optimización de modelos. Cubre las cuatro dimensiones de los puntos de referencia que predicen el rendimiento en producción, cómo construir un conjunto de datos de prueba que refleje su carga de trabajo real, cómo ejecutar pruebas A/B en producción sin interrumpir a los usuarios y cómo automatizar el cambio de modelos para que el gateway dirija al mejor modelo por solicitud sin intervención de ingeniería. El AI Gateway de TrueFoundry facilita la configuración y el monitoreo de las pruebas A/B con división de tráfico en producción.
Stop guessing which model performs best for your use case. Benchmark it in production.
TrueFoundry's AI Gateway handles production traffic splitting, outcome logging, and automatic rollback for live model A/B tests. Book a demo to see how to run your first benchmark in under 30 minutes.
Por qué los puntos de referencia públicos no son fiables para las decisiones de producción empresarial
Las puntuaciones de los puntos de referencia públicos son los datos más citados y más mal utilizados en la adquisición de LLM empresariales. Aparecen en presentaciones de proveedores, memorandos de la junta y hojas de cálculo de adquisiciones. Tratados como verdad absoluta. Comprender por qué generalmente no logran predecir el rendimiento en producción es el requisito previo para invertir tiempo de ingeniería en la selección de modelos basada en puntos de referencia.
La contaminación de los puntos de referencia infla las puntuaciones. Los grandes modelos de lenguaje se entrenan con enormes cantidades de texto de internet, que cada vez incluye más preguntas y respuestas de puntos de referencia. Los modelos que han visto contenido de puntos de referencia durante el entrenamiento obtienen puntuaciones más altas de lo que predeciría su capacidad genuina con datos nuevos. El alcance de la contaminación rara vez se divulga y es difícil de medir externamente. Tratar las puntuaciones publicadas como verdad absoluta exagera la brecha entre los modelos mejor clasificados y le dice muy poco sobre cómo manejarán sus entradas.
Las tareas académicas no coinciden con las cargas de trabajo empresariales. MMLU mide el rendimiento en preguntas de conocimiento a nivel de posgrado en 57 materias. HumanEval mide la generación de código en problemas de programación canónicos. Ninguno mide para qué los equipos empresariales realmente implementan modelos: extracción de datos estructurados de PDF con formato inconsistente, generación de salida JSON consistente a partir de instrucciones en lenguaje natural, resumir contenido técnico específico del dominio sin alucinar terminología, mantener el contexto de la conversación a lo largo de una interacción de servicio al cliente de 20 turnos.
La eficiencia de costos es invisible en los puntos de referencia centrados en la precisión. Un modelo que obtiene un 95% en un punto de referencia pero que promedia 4.000 tokens para completar su tarea típica puede tener un peor costo por resultado que un modelo que obtiene un 88% y que promedia 1.800 tokens por tarea. El costo por resultado, lo que realmente cuesta producir una salida aceptable para su caso de uso, casi nunca se informa en los puntos de referencia públicos. También es frecuentemente la métrica más importante para la planificación del presupuesto empresarial.
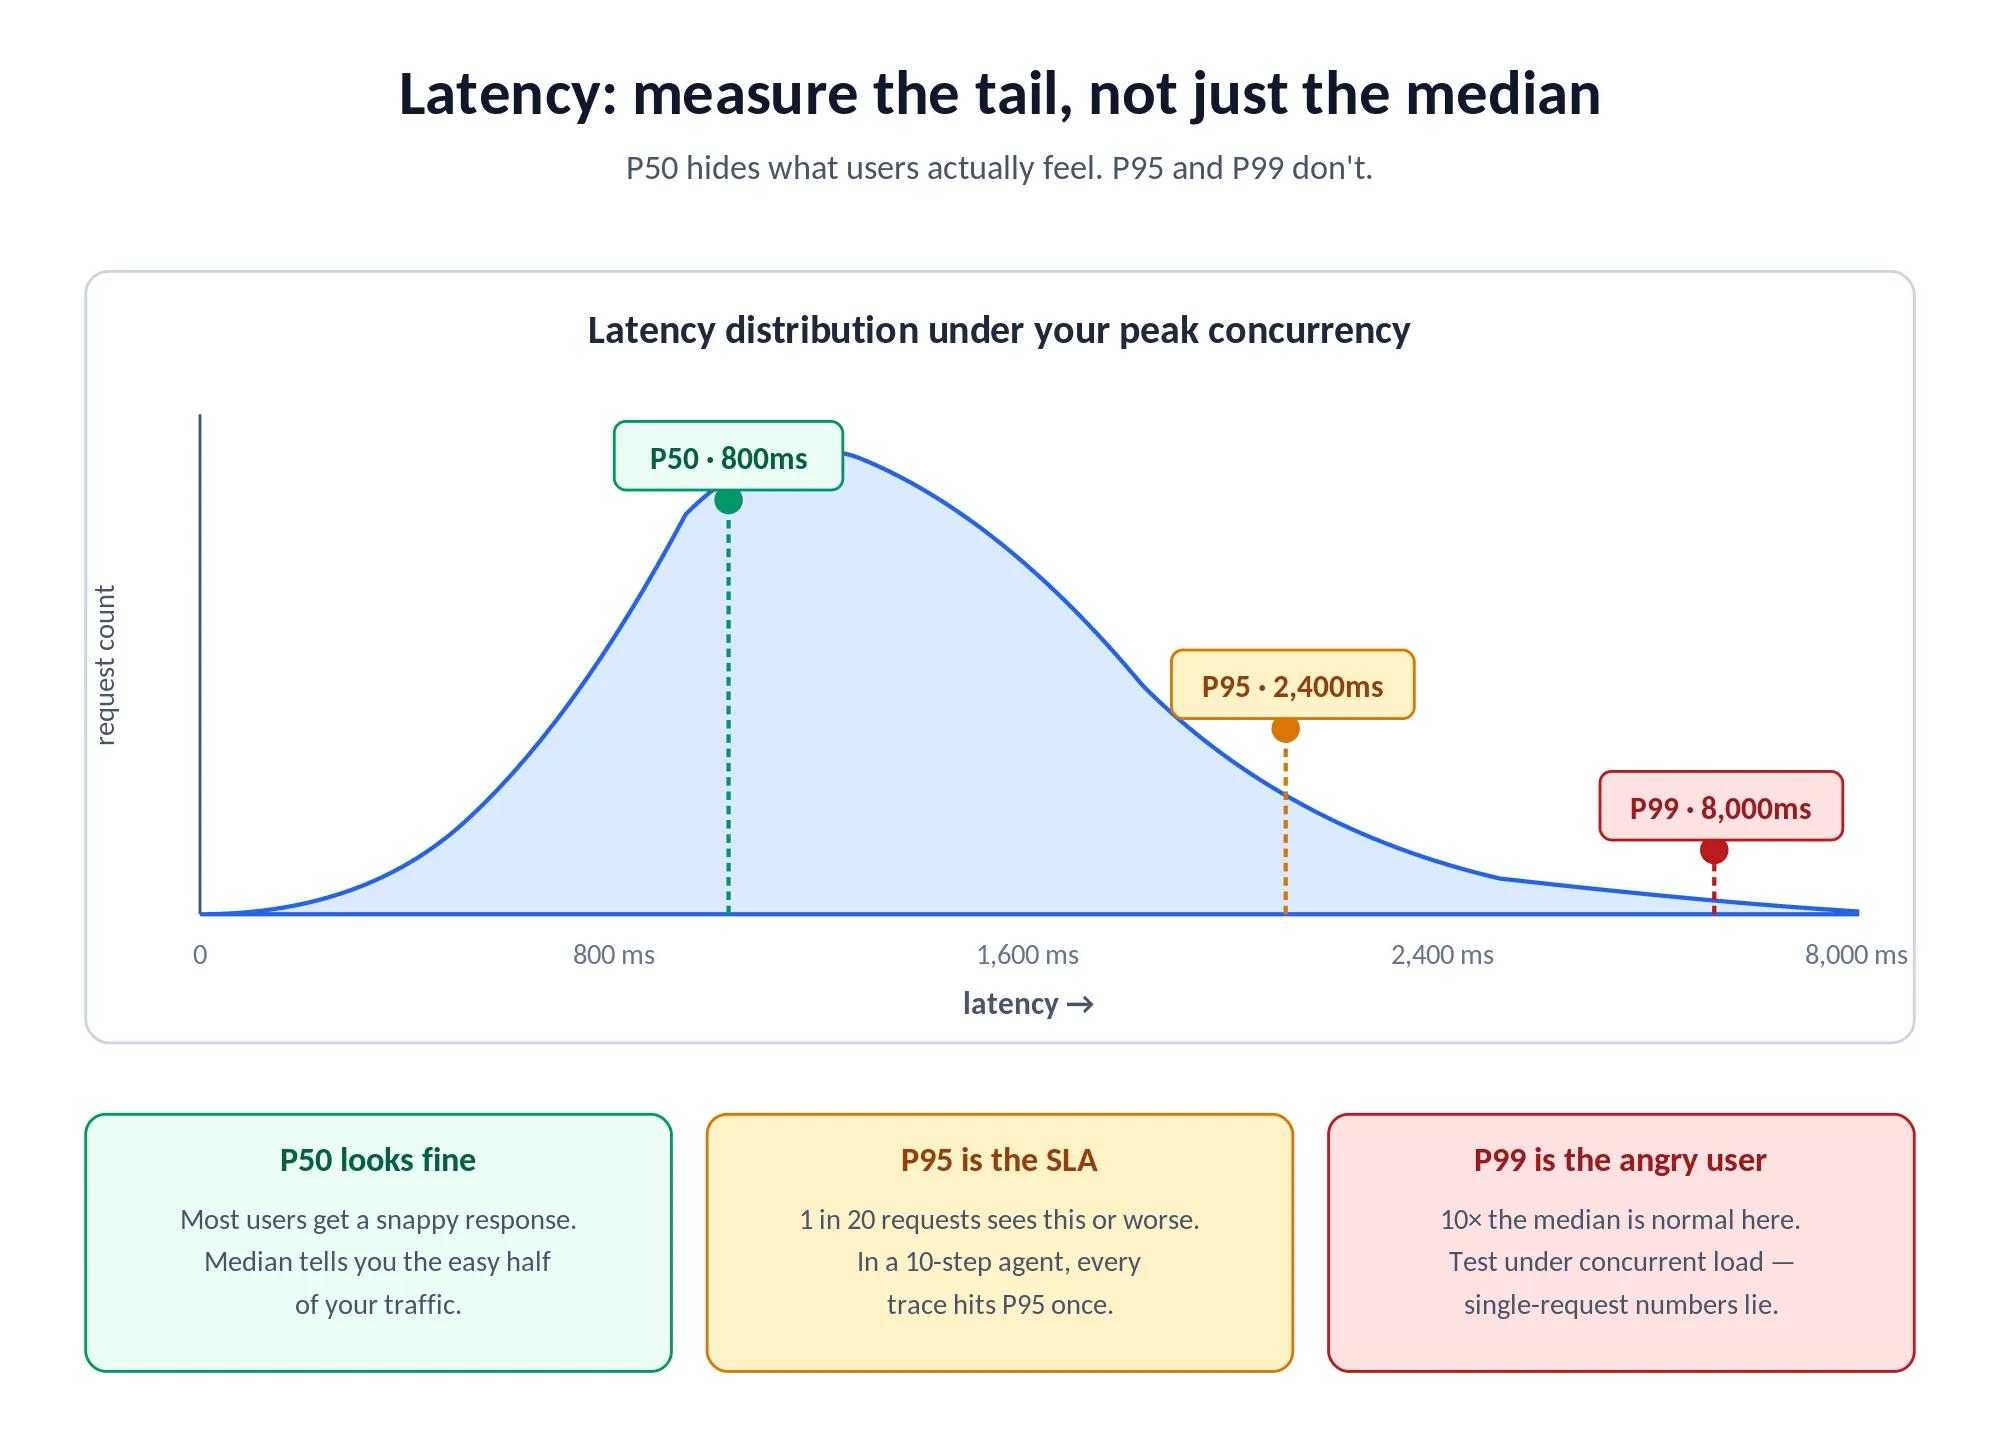
Los números de latencia de los puntos de referencia no se aplican a su entorno. Las cifras de latencia publicadas para las API de modelos se miden bajo condiciones específicas: tamaño de la solicitud, nivel de concurrencia e infraestructura que pueden diferir significativamente de los suyos. Un modelo que muestra una latencia mediana de 800 ms en condiciones de punto de referencia puede ofrecer una latencia P95 de 2.400 ms bajo su volumen concurrente de producción. Esa es una experiencia de usuario significativamente diferente.
Los modelos cambian bajo números de versión estables. Los proveedores actualizan el comportamiento del modelo sin siempre emitir nuevos números de versión o comunicar los cambios de manera destacada. Un modelo que funcionó bien en su punto de referencia interno hace tres meses puede comportarse de manera diferente hoy si el proveedor ha actualizado su ajuste fino, el manejo de las indicaciones del sistema o el filtrado de salida. La evaluación comparativa en producción debe ser continua, no un ejercicio único en el momento de la selección del modelo.
Las cuatro dimensiones de la evaluación comparativa de LLM empresariales
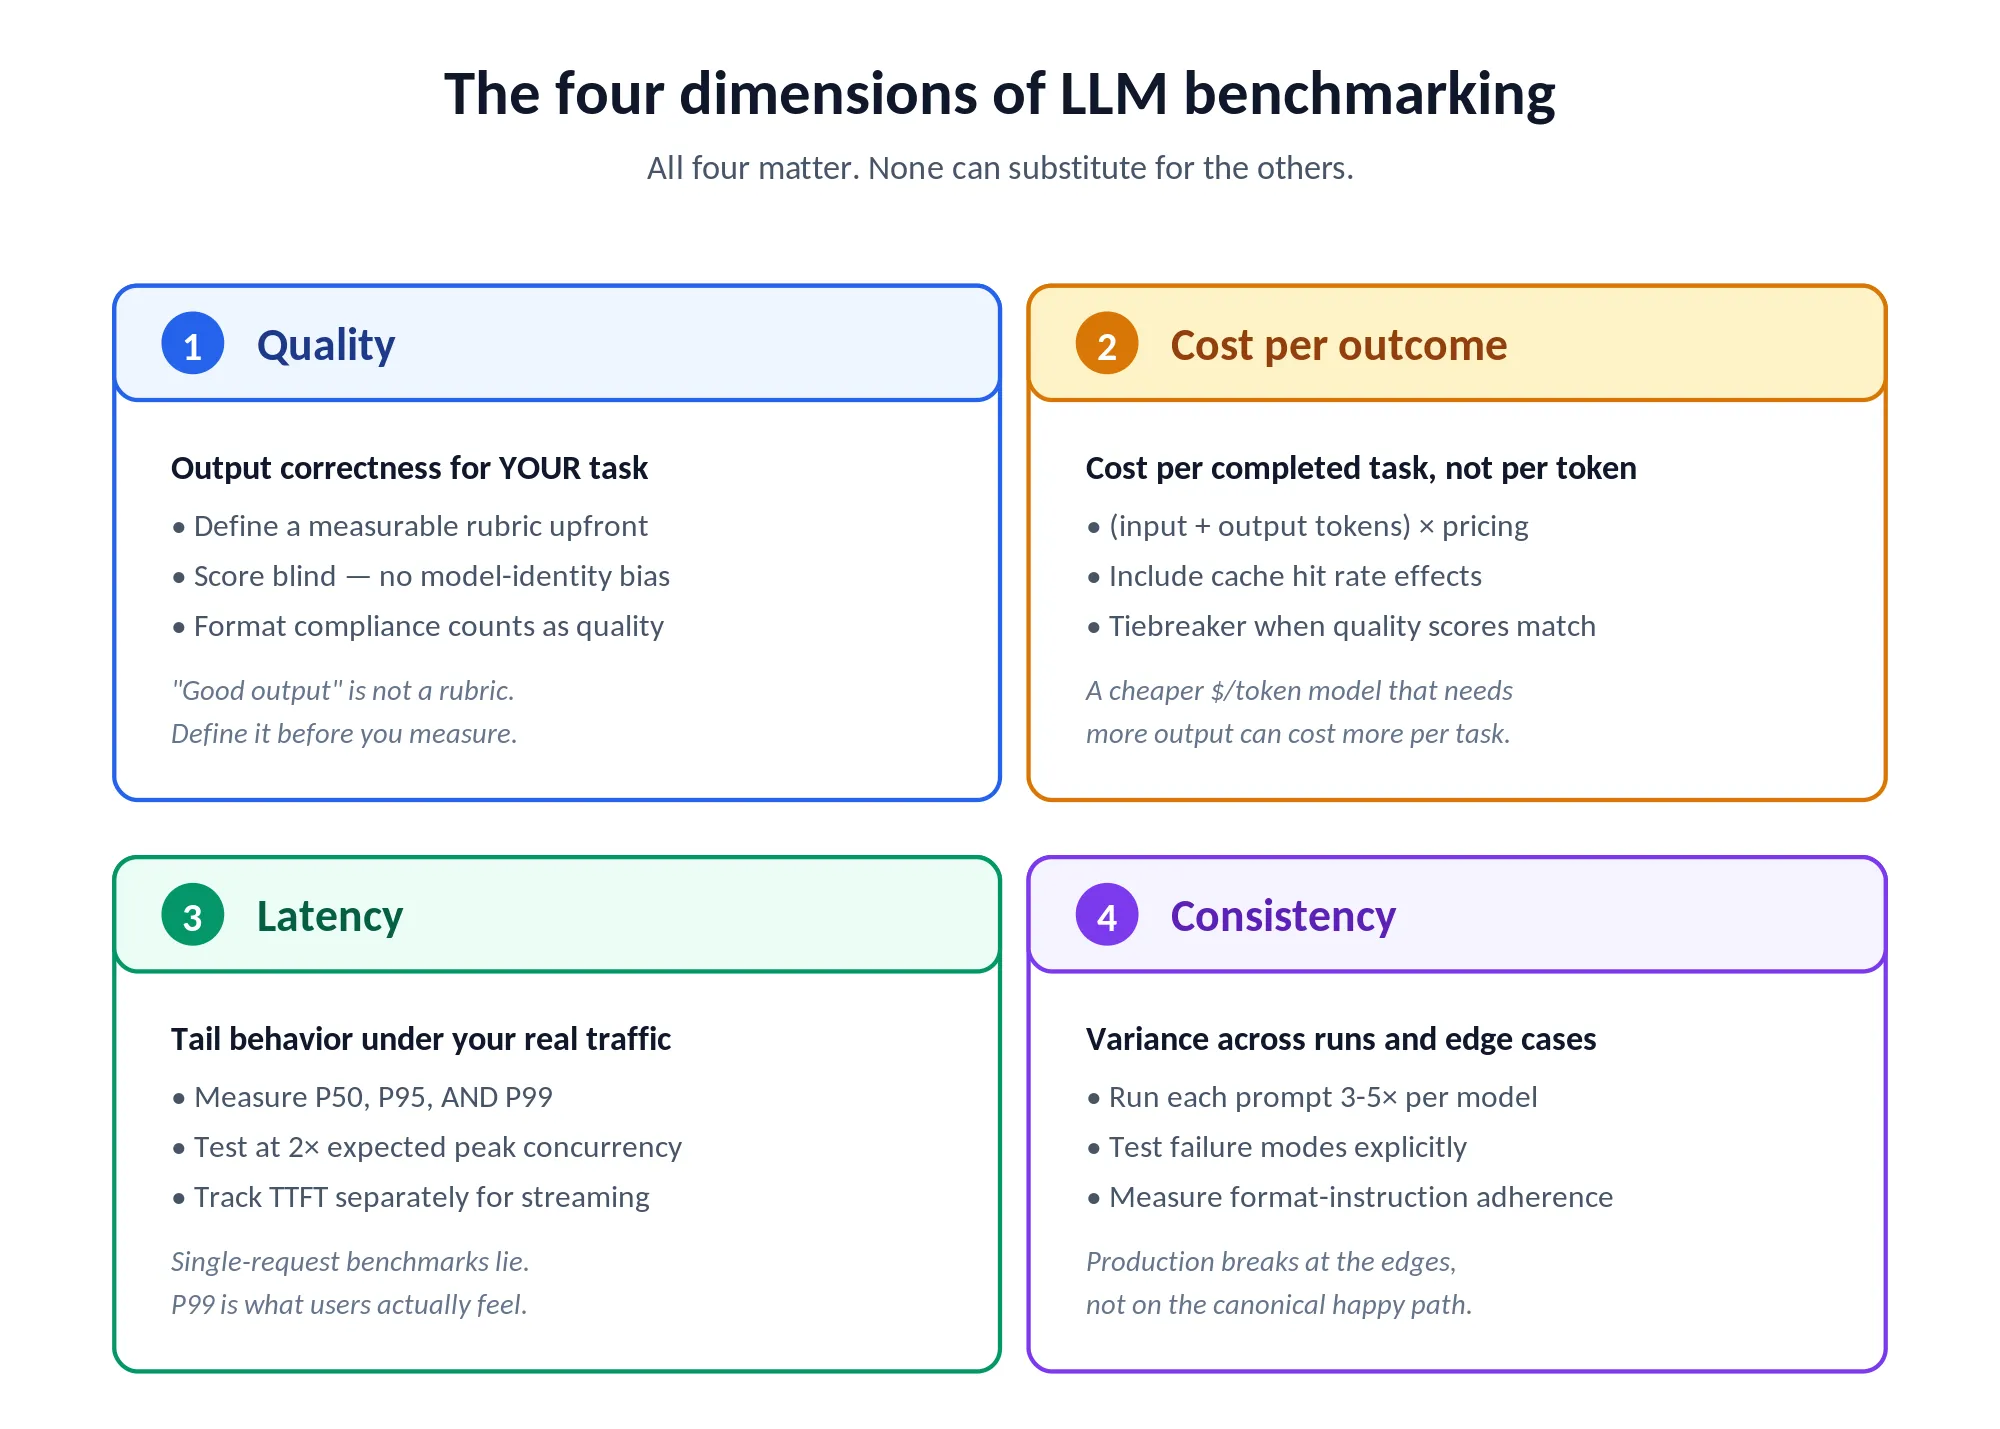
Un punto de referencia útil para LLM empresariales cubre cuatro dimensiones distintas. No son independientes. Un modelo que sobresale en calidad pero falla en el costo por resultado aún puede ser la elección incorrecta si la diferencia de costo no se justifica por la mejora de la calidad. Las cuatro deben medirse. Y sopesarse explícitamente.
Dimensión 1: Calidad de la salida para su tarea específica
Defina criterios de calidad específicos para cada tarea antes de realizar cualquier evaluación. Los criterios de calidad deben ser medibles, ya sea por evaluadores humanos utilizando una rúbrica definida, por un modelo de juez automatizado con criterios especificados, o por métricas objetivas donde existan (código: tasa de aprobación de pruebas; extracción estructurada: precisión de campo; clasificación: precisión y exhaustividad contra un conjunto etiquetado). Criterios vagos como “buena salida” producen evaluaciones que no son reproducibles y no pueden justificar una decisión de proveedor.
Cree una rúbrica de puntuación que pueda aplicarse de forma consistente a todos los modelos bajo evaluación. Para la elaboración de resúmenes de documentos, una rúbrica podría cubrir la precisión fáctica (¿contiene el resumen afirmaciones no respaldadas por la fuente?), la cobertura (¿incluye todos los puntos clave?), la longitud adecuada (¿dentro del rango de recuento de palabras objetivo?) y el cumplimiento del formato (¿sigue la estructura de salida requerida?). Cada criterio debe puntuarse de forma independiente para que los modelos puedan compararse por dimensión, no solo en general.
Realice la evaluación de calidad a ciegas. Los evaluadores o modelos de juez no deberían saber qué modelo produjo qué resultado. El sesgo de identidad del modelo es real: los evaluadores que saben que están leyendo una salida de GPT-4 la puntúan más alto en promedio que un texto idéntico sin esa etiqueta. La evaluación a ciegas le proporciona puntuaciones que reflejan la calidad real en lugar de los efectos de la reputación.
Dimensión 2: Costo por resultado
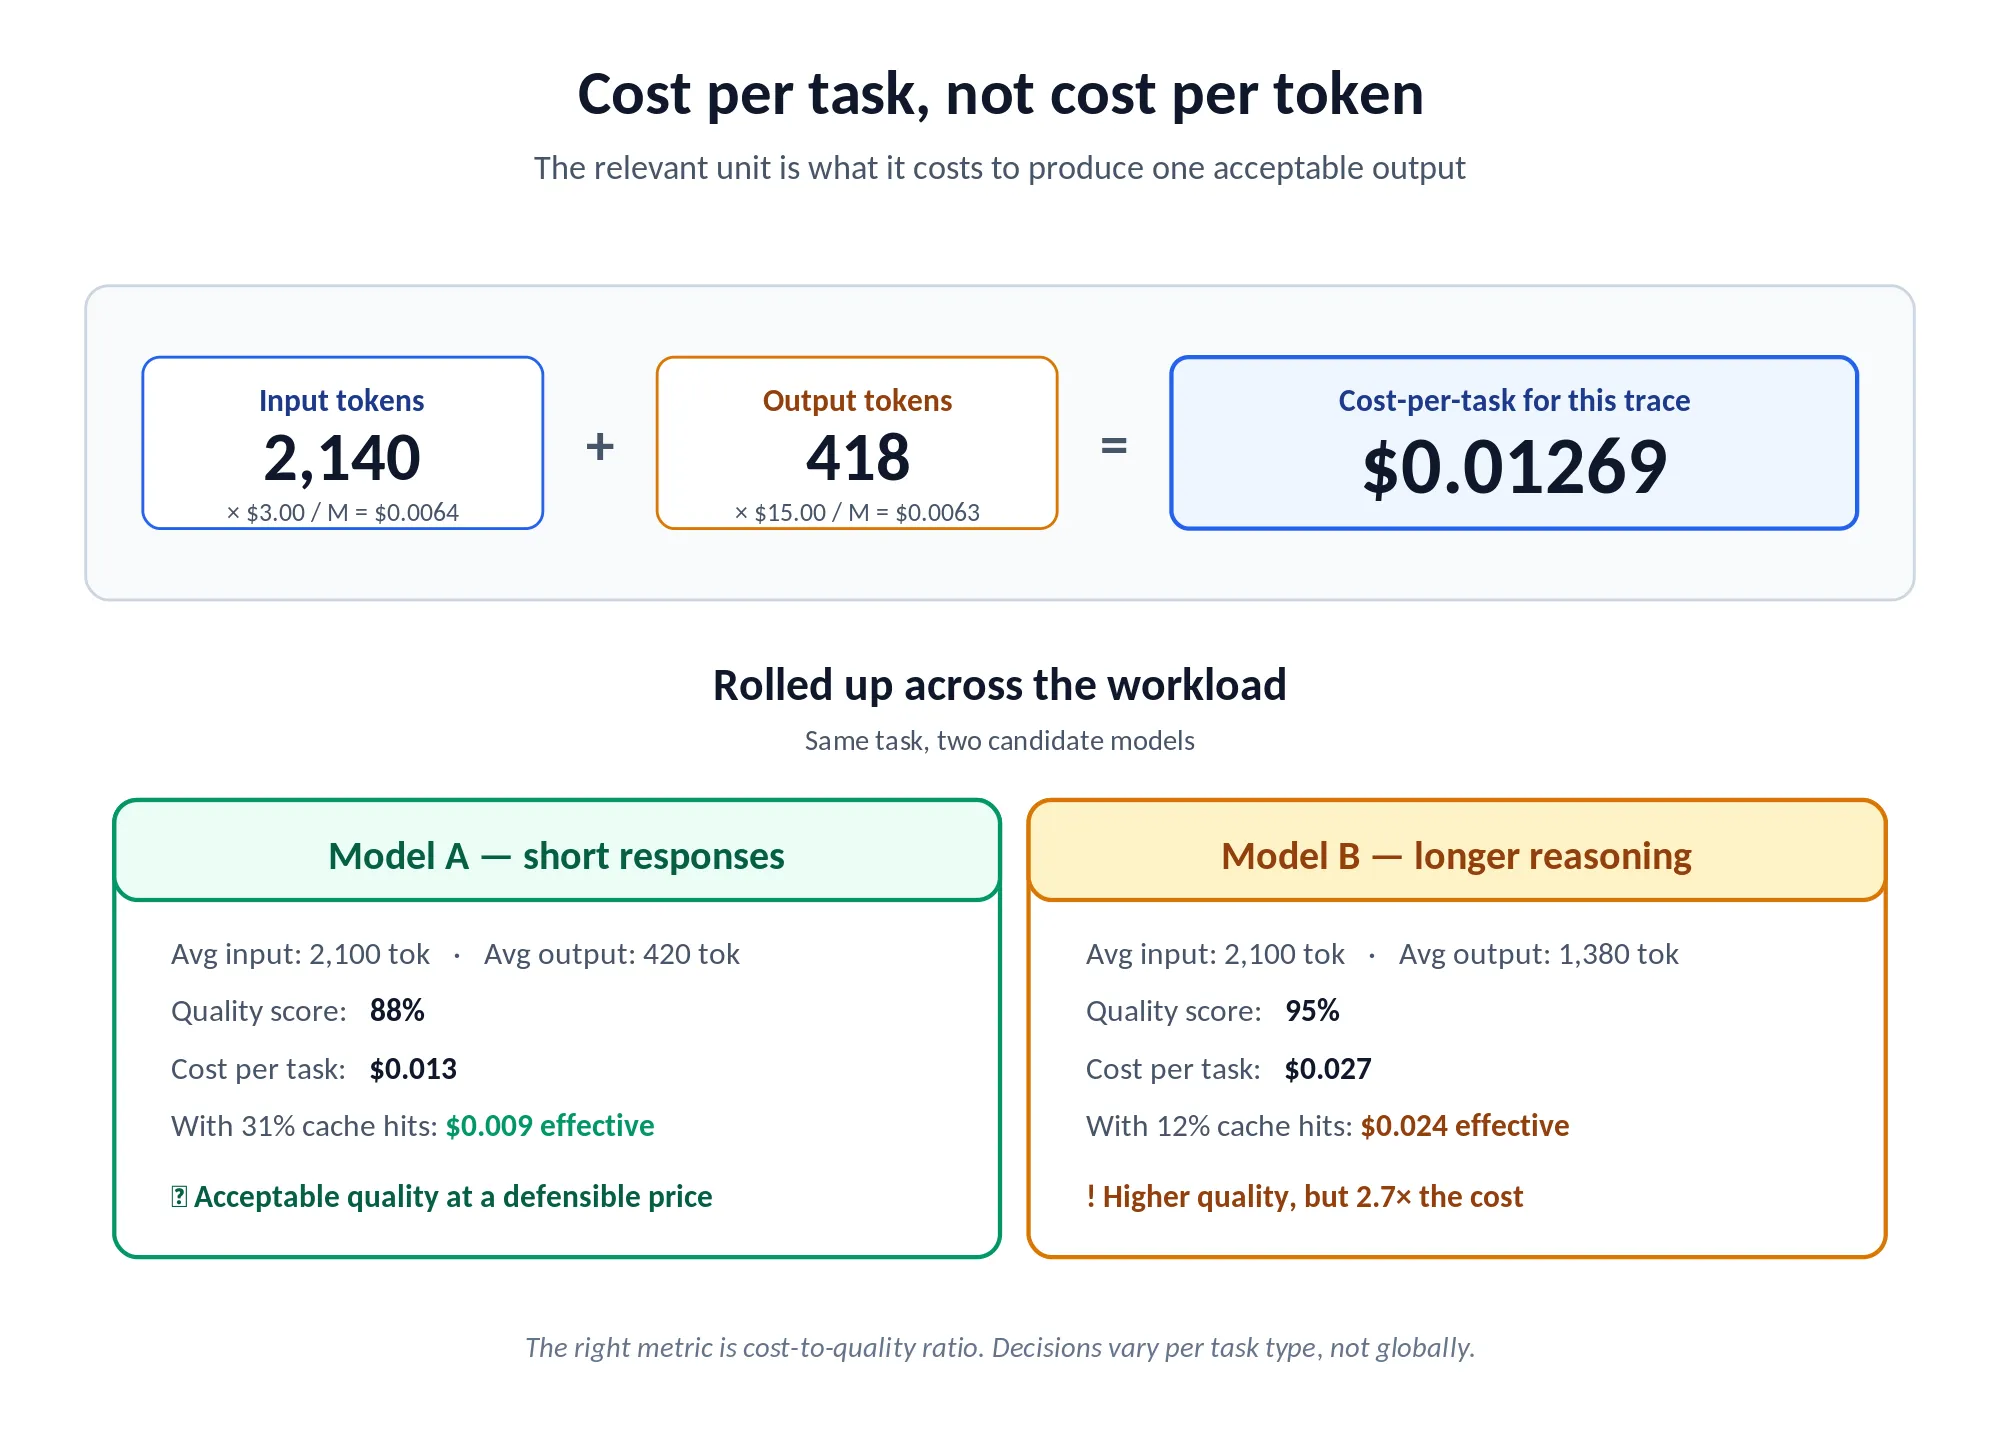
El costo por cada 1.000 tokens es una métrica independiente engañosa. La unidad relevante es el costo por tarea completada. El costo total (tokens de entrada + tokens de salida, según el precio del modelo) para producir un resultado aceptable para su caso de uso típico. Un modelo premium con un precio, por ejemplo, de $3 por millón de tokens de entrada y $15 por millón de tokens de salida podría ser más o menos rentable que un modelo nominalmente más barato que necesita respuestas más largas para alcanzar una calidad equivalente. El cálculo depende completamente de la distribución de la longitud de su tarea. Siempre obtenga las tarifas actuales por token de la página de precios de cada proveedor el día que realice la comparación; las cifras cambian trimestralmente.
Calcule el costo por tarea completada midiendo la longitud promedio del prompt (tokens de entrada) y la longitud promedio de la respuesta (tokens de salida) para su conjunto de datos de prueba en cada modelo, y luego multiplicando por los precios por token. Cuando las puntuaciones de calidad son similares, el costo por tarea es el desempate. Cuando las diferencias de calidad son reales, la relación costo-calidad (costo adicional por punto porcentual de mejora de la calidad) determina si el modelo premium vale la pena.
Incluya los efectos de la caché en el costo por resultado. El caché semántica devuelve respuestas generadas previamente para solicitudes semánticamente similares, puntuadas por similitud de coseno sobre una incrustación del último mensaje del usuario. Los aciertos de caché devuelven un costo de modelo cero, por lo que el gasto efectivo por solicitud depende de su tasa de aciertos. Si el 35% de sus solicitudes aciertan en la caché, el costo por resultado es materialmente diferente del cálculo por token, e ignorar esto puede cambiar drásticamente una comparación de modelos.
Dimensión 3: Latencia bajo su patrón de tráfico real
Mida la latencia en P50, P95 y P99, no solo la mediana. Las aplicaciones empresariales necesitan conocer el peor escenario que verán los usuarios, no solo la experiencia típica. Un modelo con un P50 excelente pero un P99 de 8 segundos hace que el uso interactivo sea inaceptable, incluso si la mediana parece buena. El panel de métricas expone selectores P50, P75, P90 y P99 para Latencia de Solicitud, Tiempo Hasta el Primer Token (TTFT), Latencia Inter-Token (ITL) y Tiempo Por Token de Salida (TPOT). Las cuatro métricas se muestran porque cada una ofrece información diferente.
Realice pruebas de carga bajo su volumen esperado de solicitudes concurrentes, no bajo condiciones de solicitud única. La mayoría de los modelos parecen excelentes de forma aislada y se degradan significativamente bajo las cargas concurrentes que generan las aplicaciones de producción. TrueFoundry ofrece un Herramienta de Benchmarking de LLM en el Catálogo de Aplicaciones que le permite configurar la concurrencia máxima, la tasa de aumento, la distribución del tamaño del prompt y el número máximo de tokens de salida. Grafica las solicitudes por segundo, el tiempo de respuesta, el TTFT y la latencia inter-token. Ejecútelo contra cualquier endpoint compatible con OpenAI, incluidos los modelos desplegados por TF, proveedores externos a través de clave API o cualquier modelo detrás de su AI Gateway. Pruebe aproximadamente al doble de su concurrencia máxima esperada para tener un margen de capacidad significativo.
Realice un seguimiento del TTFT por separado del tiempo total de generación para casos de uso de streaming. Las aplicaciones que transmiten la salida del modelo a los usuarios experimentan el TTFT como “latencia percibida”, el tiempo antes de que algo aparezca en pantalla. Un modelo con un tiempo de generación total más largo pero un TTFT más bajo puede ofrecer una mejor experiencia que un modelo técnicamente más rápido con un primer token lento. TPOT (tiempo total dividido por tokens de salida) es el único número que captura la velocidad de generación completa y es lo que el enrutamiento basado en latencia utiliza para seleccionar el objetivo más rápido.
Dimensión 4: Consistencia y Fiabilidad
Ejecute cada prompt de su conjunto de datos de prueba de tres a cinco veces en múltiples sesiones para medir la varianza de la salida. Algunos modelos producen resultados drásticamente diferentes para la misma entrada en distintas ejecuciones: diferentes afirmaciones fácticas, diferentes estructuras de salida, diferente cobertura de los puntos requeridos. Una alta varianza crea problemas posteriores para el análisis, la extracción de datos estructurados y la consistencia de la experiencia del usuario.
Pruebe explícitamente el comportamiento de los modos de fallo. ¿Qué devuelve el modelo cuando la entrada excede su ventana de contexto? ¿Qué sucede cuando la política de contenido se activa con una entrada límite? ¿Sigue las instrucciones de formato explícitas de manera fiable, o a veces recurre a respuestas de formato libre cuando se requería una salida estructurada? Estos modos de fallo están mayormente ausentes en los benchmarks públicos, pero son donde los sistemas de producción fallan.
Creación de un conjunto de datos de referencia representativo para su empresa
El conjunto de datos de referencia es el componente más importante de una evaluación de LLM empresarial. Un conjunto de datos bien diseñado produce predicciones fiables del rendimiento en producción. Uno mal diseñado produce resultados engañosos que conducen a selecciones erróneas. El diseño del conjunto de datos merece tanta inversión en ingeniería como la propia metodología de evaluación.
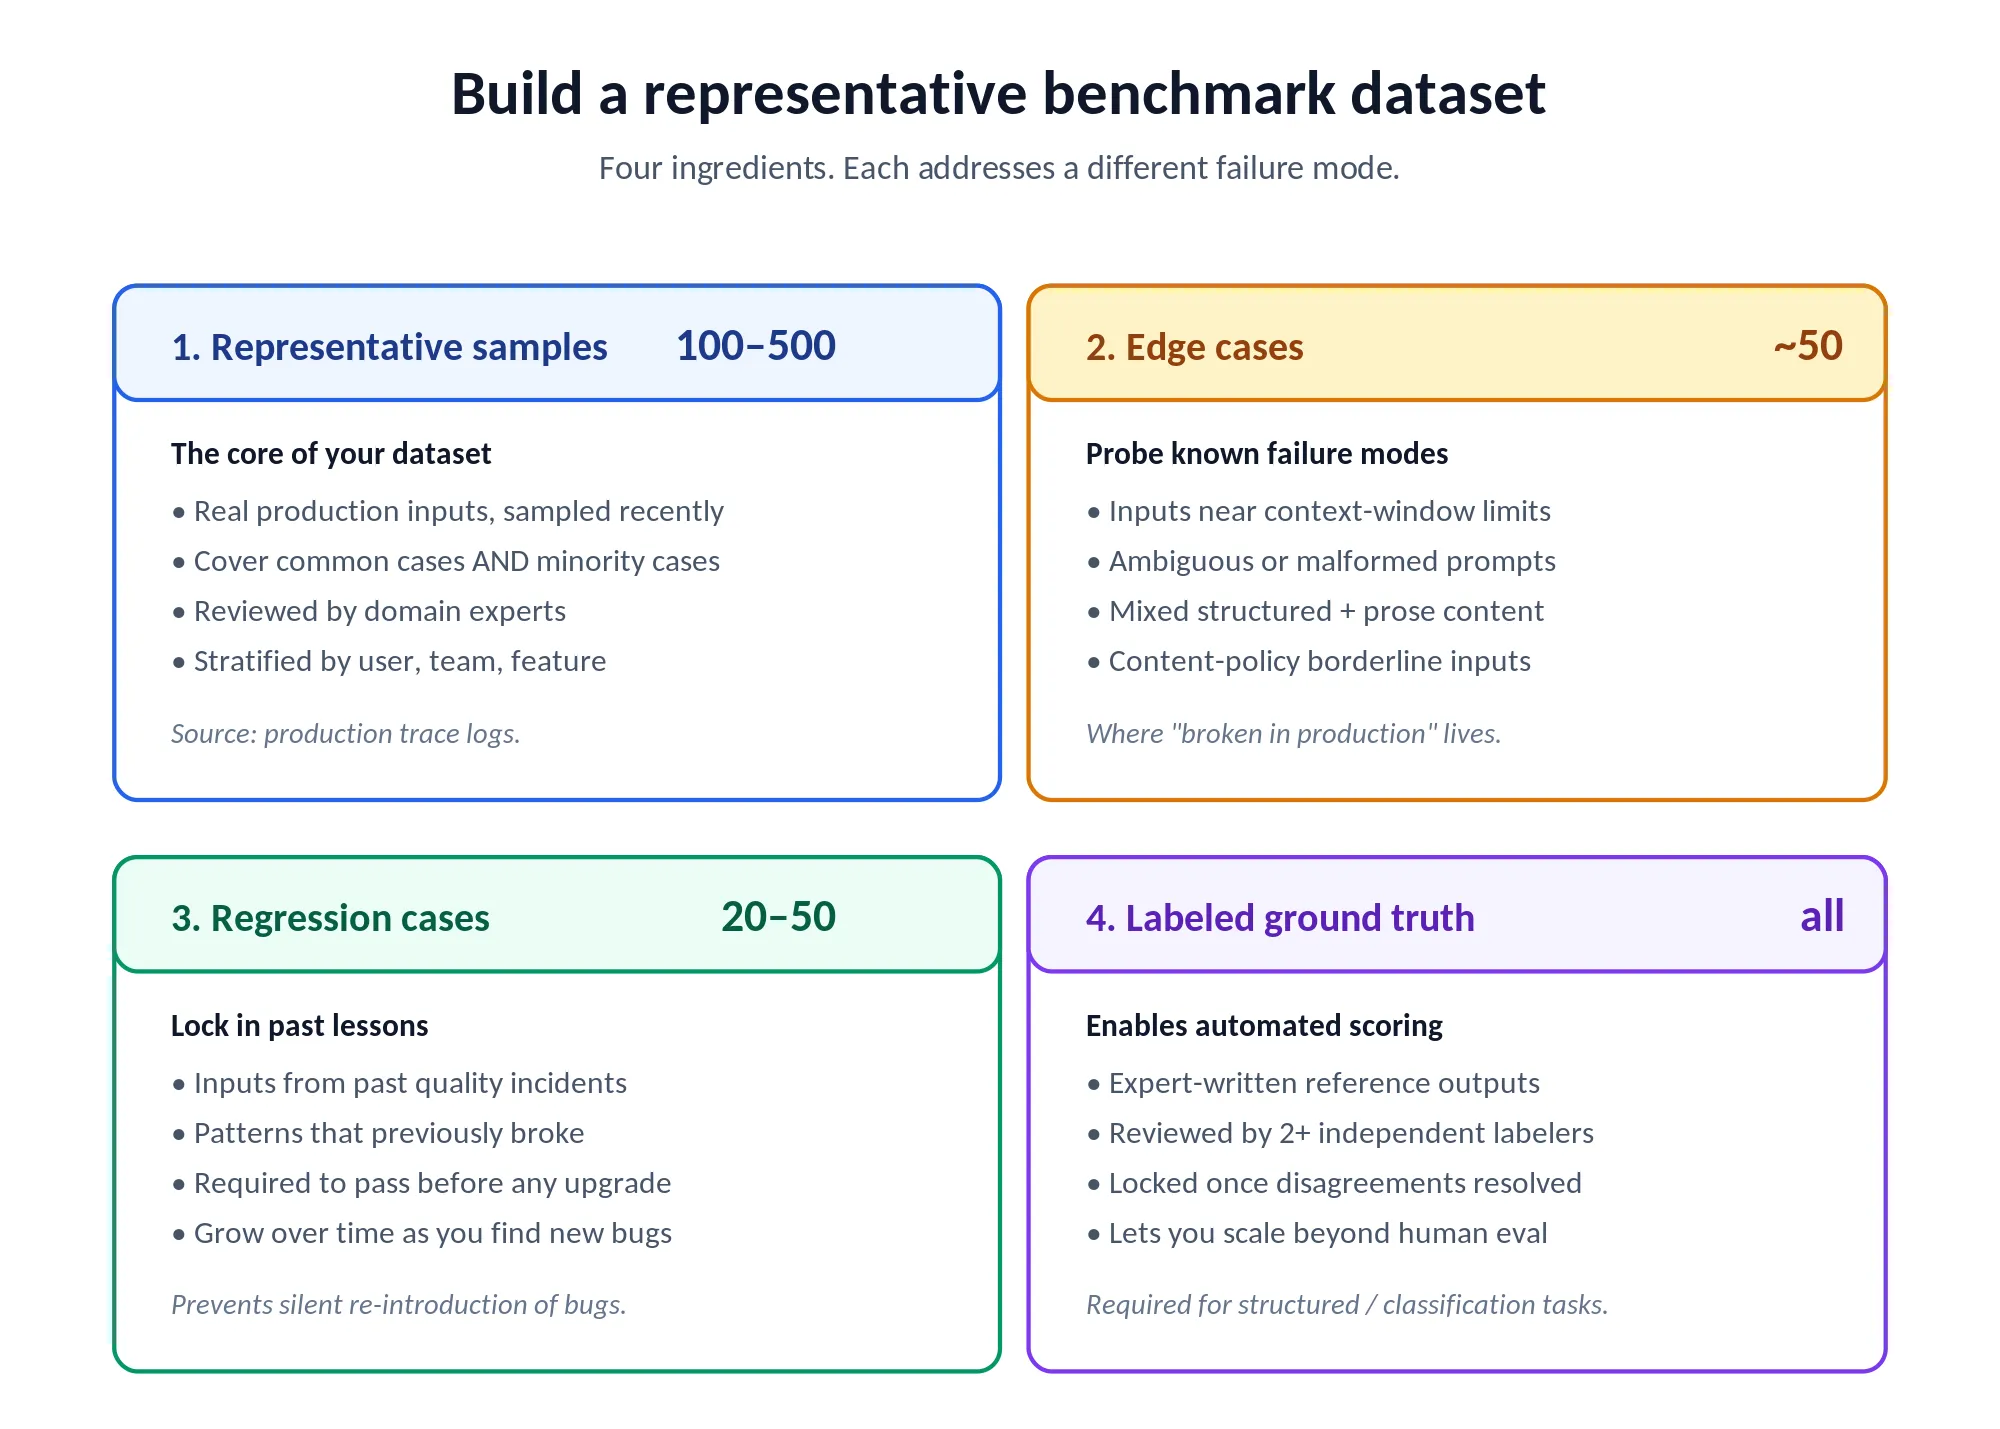
Las muestras representativas forman el núcleo del conjunto de datos. Recopile de 100 a 500 ejemplos reales de su carga de trabajo de producción, revisados manualmente por expertos en la materia para confirmar que representan la distribución real de las entradas que maneja su sistema. Cubra la distribución completa: casos comunes, casos extremos, la minoría de entradas que son técnicamente difíciles o donde los requisitos de calidad son más estrictos. Las muestras deben extraerse de datos de producción recientes para reflejar las distribuciones actuales, no de datos históricos que pueden ya no ser representativos. Si ha habilitado el rastreo en su AI Gateway, la Query Spans API (a través del SDK de TrueFoundry) es probablemente la forma más sencilla de obtener una muestra estratificada, filtrando por usuario, equipo, cuenta virtual o cualquier clave de metadatos personalizada que haya adjuntado.
Los casos extremos detectan modos de fallo conocidos del modelo. Diseñe entradas de prueba específicas para hacerlos aflorar. Para el procesamiento de documentos: documentos muy largos cerca de los límites de la ventana de contexto, documentos con formato inconsistente, documentos con tablas o datos estructurados mezclados con prosa. Para la generación de código: solicitudes con especificaciones ambiguas, solicitudes en frameworks poco comunes, solicitudes que requieren razonamiento sobre implicaciones de seguridad. Para aplicaciones de cara al cliente: entradas con errores gramaticales, entradas en lenguaje no estándar, casos límite de políticas de contenido. El conjunto de casos extremos es donde reside la brecha entre "95% en el benchmark" y "roto en producción".
Los casos de regresión previenen regresiones de capacidad. Mantenga un conjunto de 20 a 50 ejemplos extraídos de incidentes pasados: casos en los que su modelo actual produjo una salida incorrecta, casos en los que una actualización de modelo anterior causó regresiones de calidad, casos en los que patrones de entrada específicos causaron problemas de forma consistente. Cualquier nuevo modelo bajo evaluación debe pasar el conjunto de regresión antes de ser considerado para producción. Esto hace que las actualizaciones sean más seguras porque no se pueden reintroducir silenciosamente problemas previamente resueltos.
La verdad fundamental etiquetada permite la puntuación automatizada. Para los casos de uso donde la puntuación automatizada es factible (extracción estructurada, clasificación, generación de código), incluya etiquetas de verdad fundamental creadas por expertos humanos para cada caso de prueba. La puntuación automatizada contra la verdad fundamental escala mejor que la evaluación humana para grandes conjuntos de pruebas. Las etiquetas deben ser revisadas por al menos dos evaluadores independientes para resolver desacuerdos antes de ser establecidas como el estándar de evaluación.
Ejecución de pruebas A/B en producción: el benchmark más fiable
La evaluación comparativa offline en un conjunto de datos de prueba es un primer paso necesario. La señal más fiable generalmente proviene del tráfico de producción. Los usuarios reales generan una distribución de entradas que, según se informa, es más variada y desafiante que cualquier conjunto de pruebas curado manualmente. Las pruebas A/B en producción, que dirigen un porcentaje del tráfico en vivo a un nuevo modelo mientras se comparan los resultados con el modelo actual, es lo que hace que una decisión de modelo sea justificable.
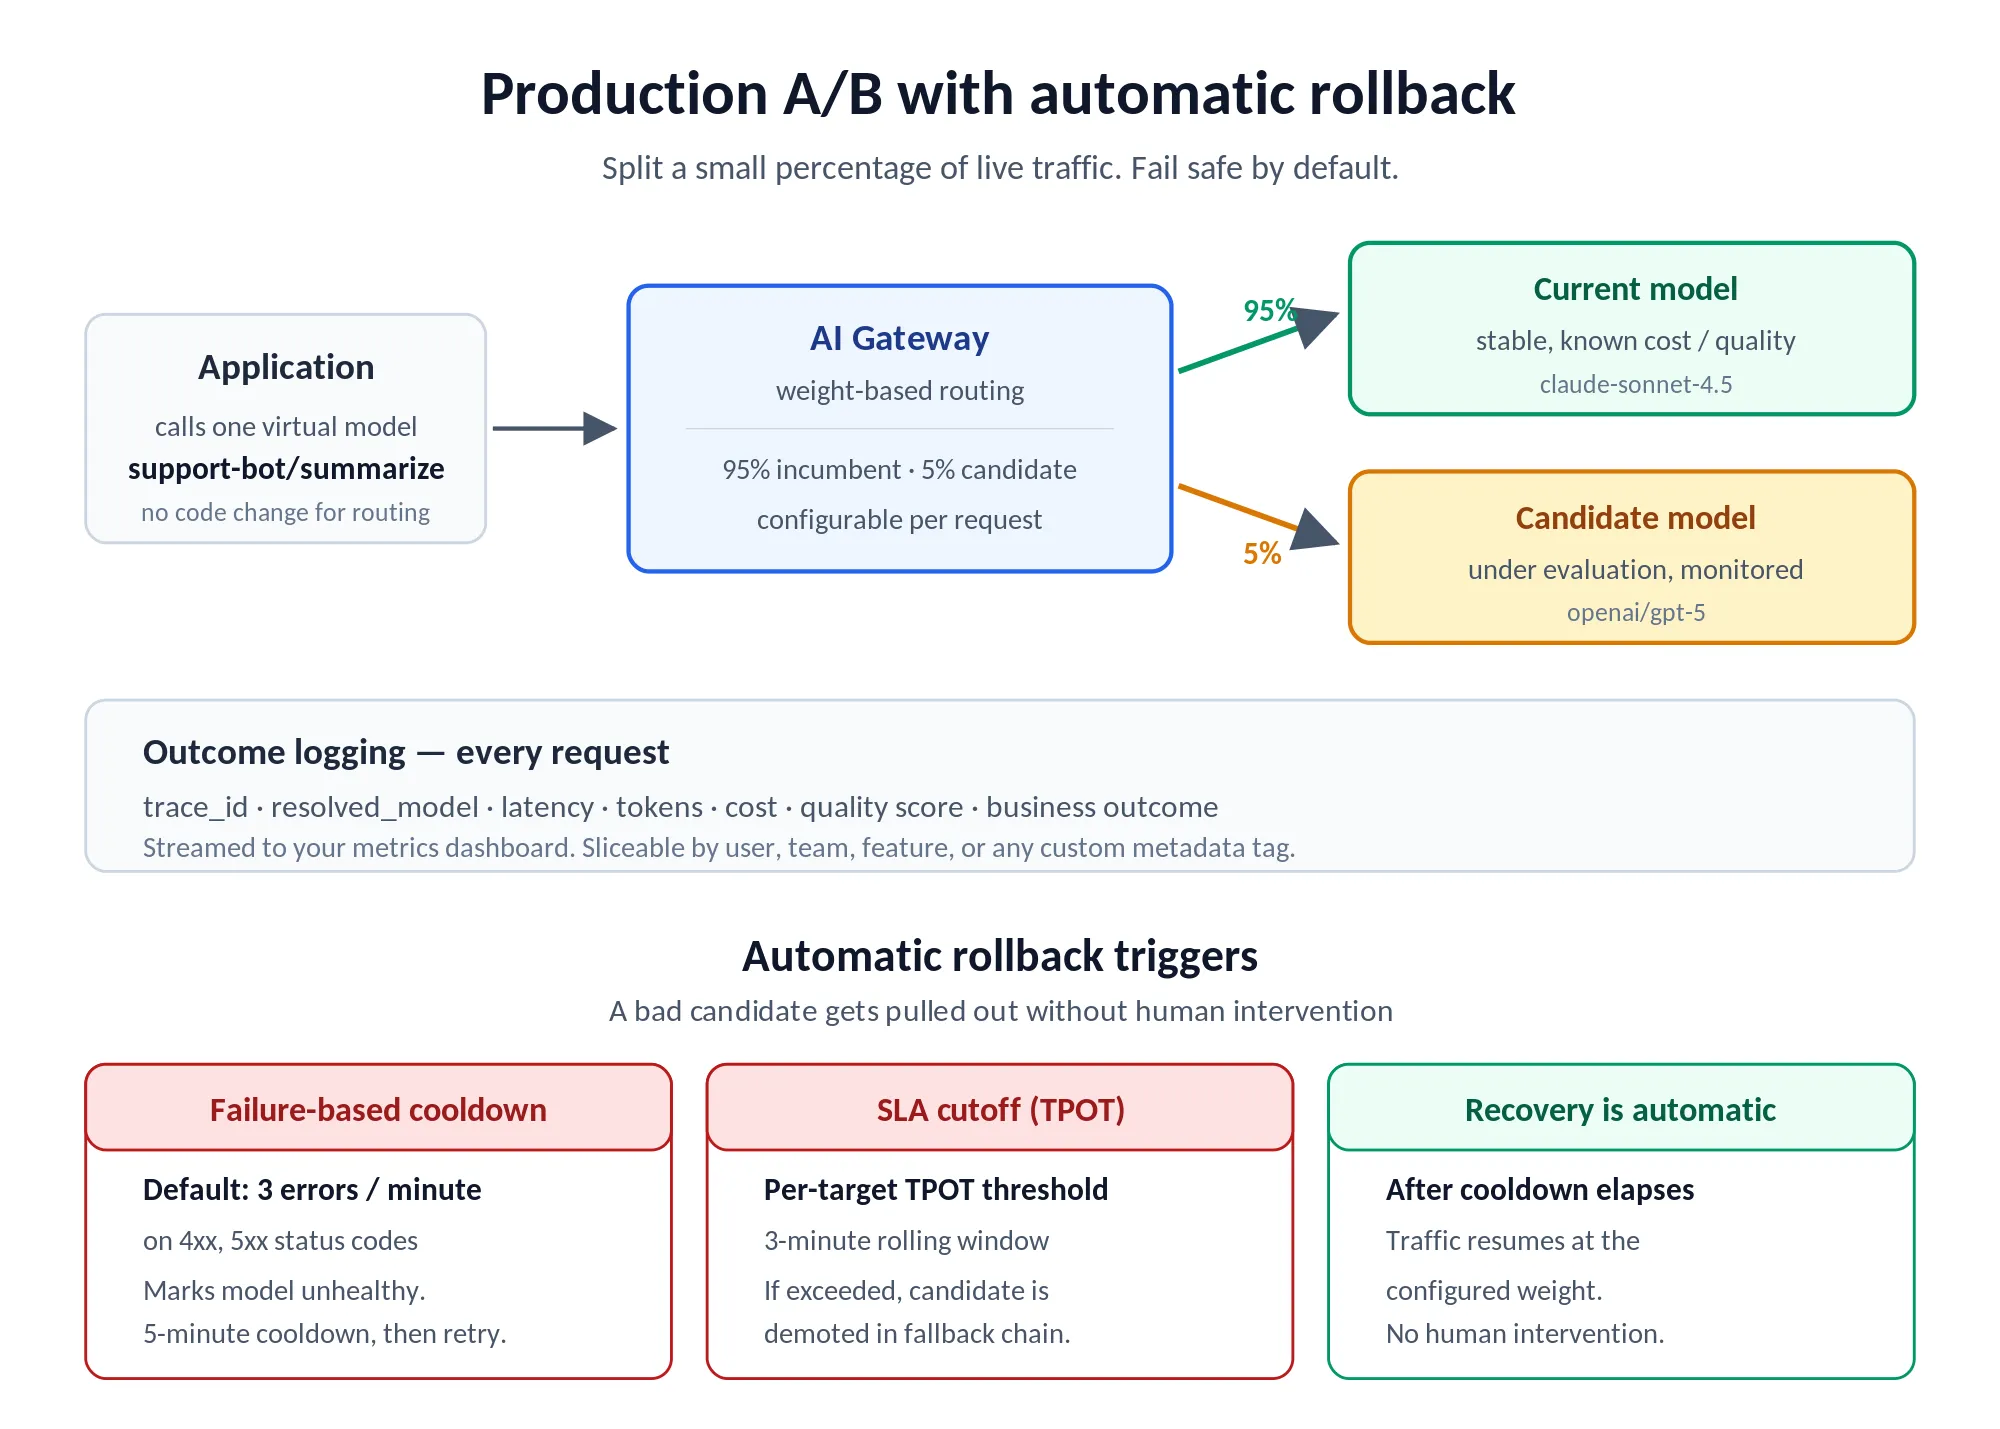
Comience con el 1-5% del tráfico de producción. Dirija un pequeño porcentaje de solicitudes en vivo al modelo candidato mientras el resto permanece en el actual. Monitoree la calidad de la salida, la latencia, el costo y la tasa de error durante un mínimo de dos semanas, tiempo suficiente para capturar la distribución completa de sus entradas de producción, incluyendo patrones semanales y casos extremos que solo aparecen ocasionalmente. En TrueFoundry, esto es un solo campo en una configuración de Virtual Model : weight: 5 en el candidato, weight: 95 en el modelo actual.
Defina los criterios de éxito antes de que empiece la prueba. Articule las condiciones específicas bajo las cuales el nuevo modelo será aceptado para su despliegue completo en producción. Ejemplo: el nuevo modelo debe alcanzar al menos el 97% de la puntuación de calidad del modelo actual con un coste por tarea no superior al 110% del modelo actual, y una latencia P95 no peor que la del modelo actual. Los criterios predefinidos evitan la racionalización post-hoc, donde los equipos aceptan un modelo de menor rendimiento porque otras métricas parecen buenas.
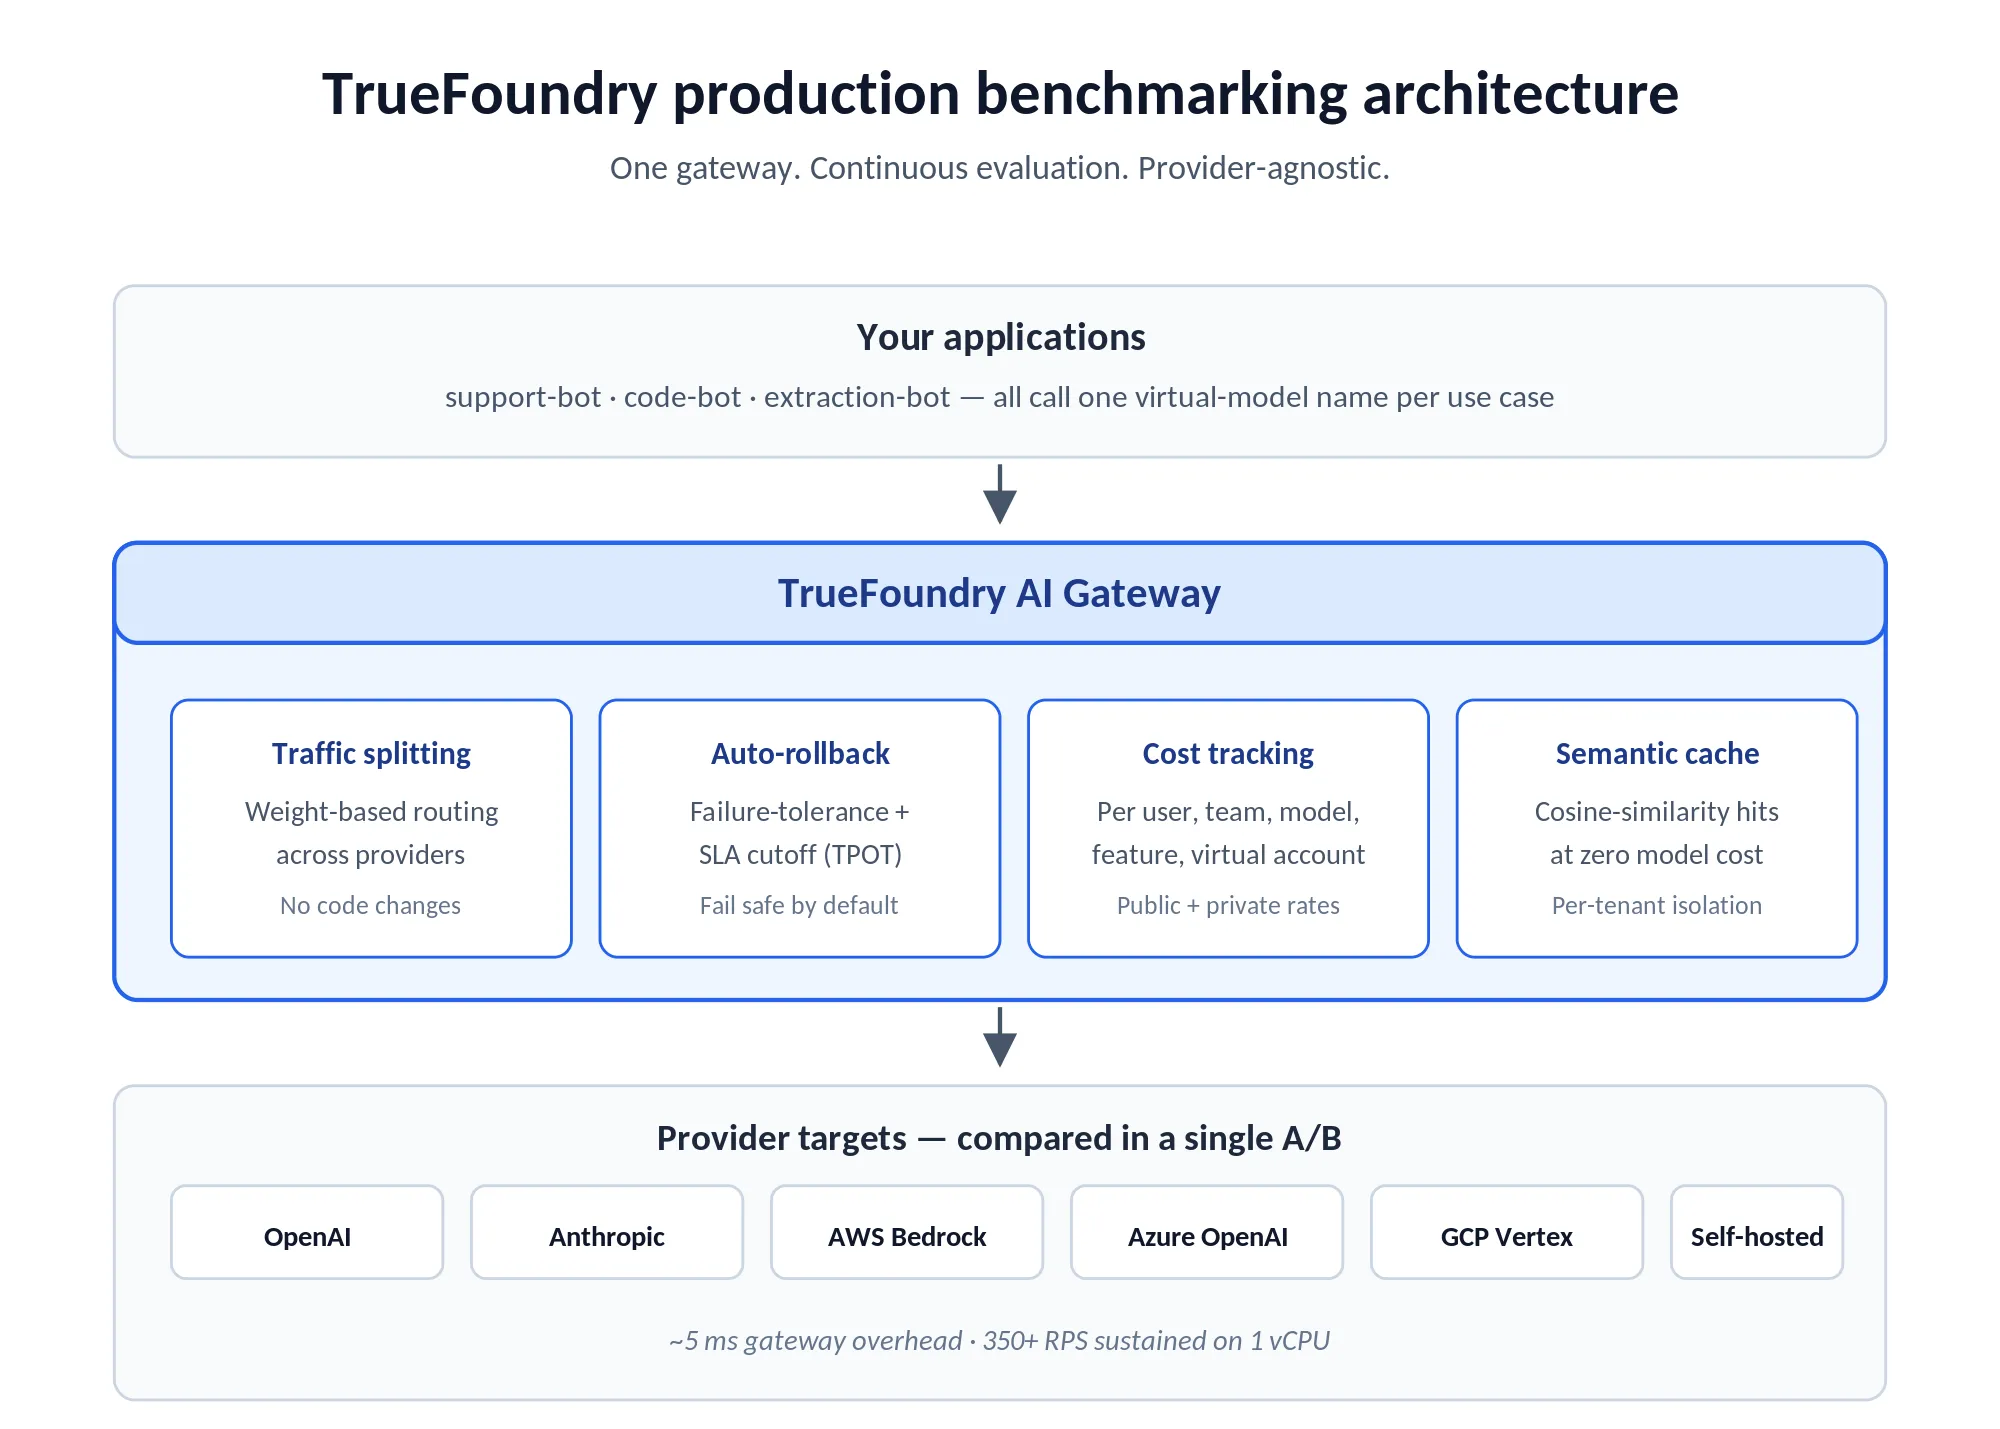
Utilice la capa de enrutamiento de la pasarela de IA para la división de tráfico. Configure la pasarela para dividir el tráfico entre modelos por porcentaje sin modificar ningún código de aplicación. La aplicación envía una solicitud estándar a un nombre de modelo virtual (algo como support-bot/summarize), y la pasarela decide qué modelo real utilizar basándose en la división configurada. Esto elimina la sobrecarga de ingeniería de desplegar ramas de código específicas del modelo para su evaluación. La configuración de balanceo de carga de TrueFoundry es un YAML declarativo, editable en la interfaz de usuario o enviado a través de la CLI de tfy para flujos de trabajo GitOps.
Establezca disparadores de reversión automática. Configure las condiciones que retiran automáticamente al candidato de la rotación: umbral de tasa de error, límite superior de latencia, límite inferior de puntuación de calidad. La configuración de tolerancia a fallos de TrueFoundry (allowed_failures_per_minute, cooldown_period_minutes, failure_status_codes) se establece por modelo, y un objetivo que supera el umbral se marca como no saludable y se excluye del enrutamiento durante el período de enfriamiento. The blog sobre balanceo de carga muestra una configuración típica con tres fallos por minuto que activan un período de enfriamiento de cinco minutos para [429, 500, 502, 503, 504]. Para la latencia, el enrutamiento basado en prioridades admite un límite de SLA en TPOT: configure time_per_output_token_ms por objetivo, y la pasarela monitoriza una ventana móvil de 3 minutos con hasta 10 muestras (mínimo 3) para decidir si el candidato cumple con su umbral de latencia. Las pruebas A/B en producción son a prueba de fallos. El peor de los casos es un pequeño porcentaje de tráfico atendido por un modelo defectuoso antes de que se active la recuperación automática.
Registre métricas de resultado que van más allá de las señales técnicas. Además de la latencia y la tasa de error, registre las señales de resultados de negocio cuando sean medibles: ¿aceptó o rechazó el usuario la salida del modelo? ¿Se completó la tarea del agente con éxito? ¿Se resolvió la interacción de servicio al cliente en la misma sesión? Estas métricas posteriores son más significativas para la selección de modelos que la calidad técnica por sí sola, y requieren instrumentación a nivel de aplicación para su recopilación. TrueFoundry's metadatos personalizados (enviados a través del encabezado X-TFY-METADATA) le permite etiquetar cada solicitud con la característica, el entorno, el ID de cliente o cualquier dimensión que le interese a su negocio, y desglosar el panel de métricas según esa dimensión más tarde.
Automatización de la selección de modelos: Más allá de las pruebas A/B manuales
El objetivo final de un programa maduro de evaluación de LLM empresariales es eliminar por completo la selección de modelos de la ruta crítica de las decisiones de ingeniería. En lugar de ejecutar pruebas A/B manuales cada vez que se lanza un nuevo modelo, la pasarela aplica automáticamente los criterios de selección configurados. Cada solicitud se dirige al modelo que probablemente produzca el mejor resultado, dados los datos de rendimiento actuales.
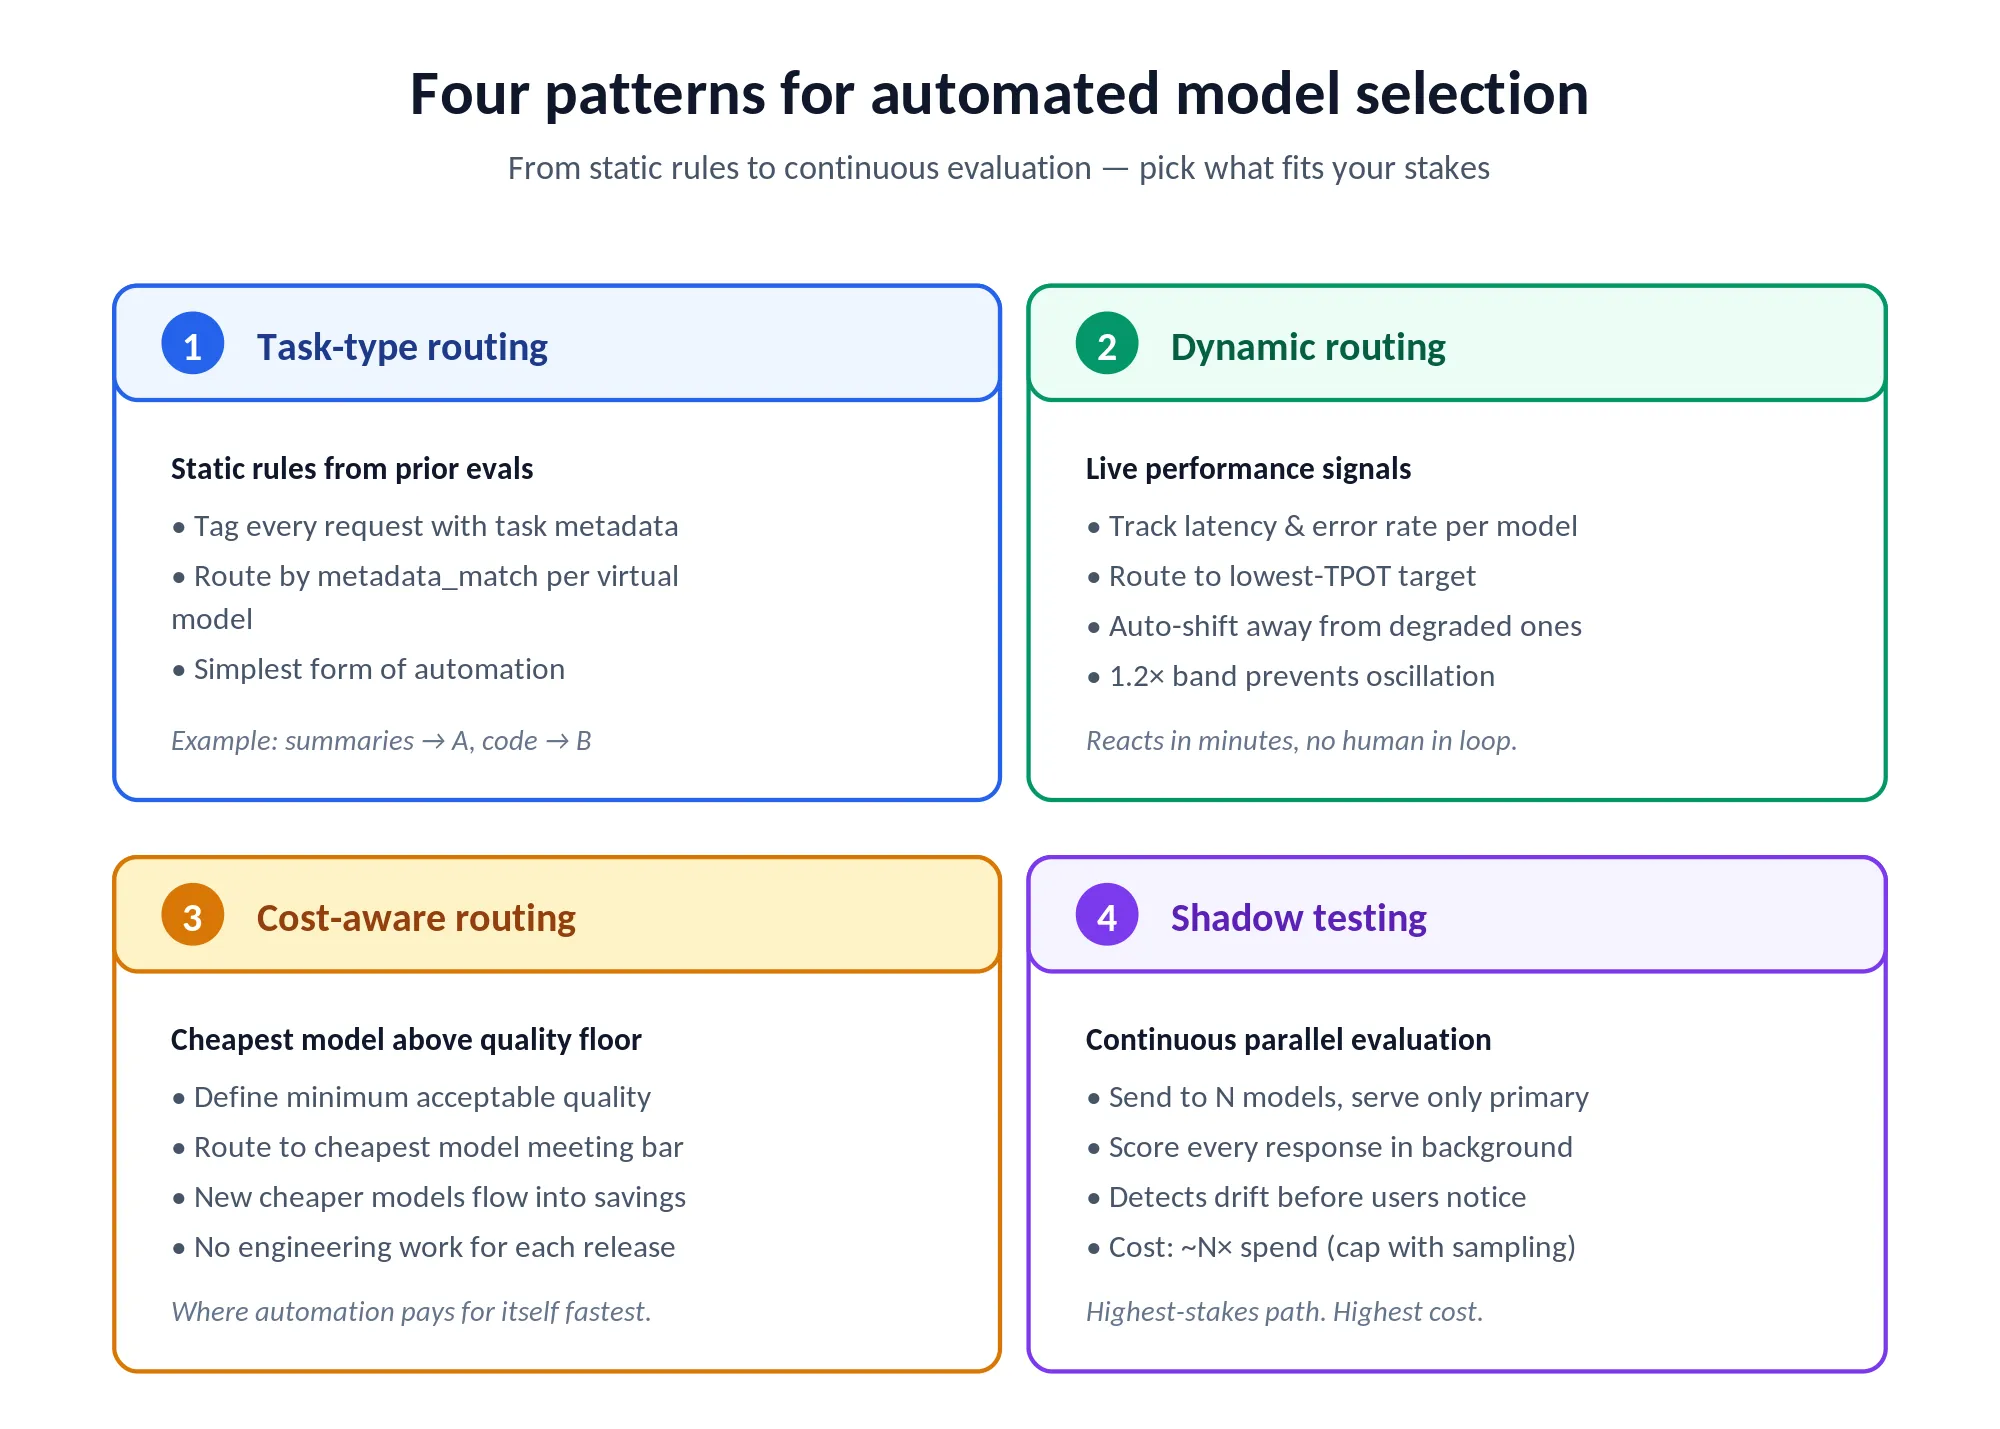
Enrutamiento por tipo de tarea basado en los resultados de la evaluación. Una vez que las evaluaciones han establecido que el Modelo A es mejor para la creación de resúmenes de documentos y el Modelo B para la generación de código, configure la pasarela para enrutar por la etiqueta de tipo de tarea adjunta a cada solicitud. Este es un enrutamiento estático basado en una evaluación previa, la forma más sencilla de selección automática de modelos. En los modelos virtuales de TrueFoundry, esto es un bloque metadata_match en cada objetivo: envíe solicitudes {task: "summarize"} a un proveedor, {task: "code_gen"} a otro, con metadatos rellenados por su aplicación a través del encabezado X-TFY-METADATA.
Enrutamiento dinámico basado en señales de rendimiento en tiempo real. Un enrutamiento más sofisticado utiliza los datos de latencia en vivo y tasa de error de la pasarela para desviar el tráfico de los modelos que están actualmente degradados. Cuando la API de un proveedor experimenta una latencia elevada, la pasarela desvía el tráfico al siguiente mejor modelo para ese tipo de tarea sin esperar a que un humano lo note. TrueFoundry's Enrutamiento basado en latencia enruta al TPOT más bajo en los últimos 20 minutos (o las últimas 100 solicitudes, lo que sea menor), con una banda de 1.2x para que los modelos dentro de ese rango se consideren igual de rápidos y el tráfico no oscile por diferencias menores.
Enrutamiento consciente del costo con umbrales de calidad. Configure reglas que envíen las solicitudes al modelo más económico que cumpla con un umbral de calidad definido. Para tareas en las que cualquier modelo por encima de un umbral es aceptable, la pasarela genera ahorros de costos a medida que los modelos más económicos cumplen con los requisitos sin necesidad de trabajo de ingeniería. Aquí es donde el enrutamiento automatizado se amortiza más rápidamente: cada modelo nuevo y más económico que alcance su umbral de calidad se traduce directamente en ahorros.
Evaluación continua con pruebas en sombra. Las pruebas en sombra enrutan cada solicitud de producción a múltiples modelos simultáneamente, sirven la respuesta del modelo principal y evalúan las salidas de todos los candidatos. Esto crea un flujo de evaluación continua que detecta cambios en el rendimiento del modelo en tiempo real, antes de que causen degradaciones visibles para el usuario. El costo adicional es aproximadamente N veces el gasto del modelo si se realizan pruebas en sombra con N modelos, lo cual es significativo, pero a menudo menor que el costo de implementar un modelo regresivo en producción. Puede gestionar ese costo adicional realizando pruebas en sombra solo con una fracción del tráfico, o solo con modelos más pequeños y económicos que se estén evaluando como candidatos para la reducción de costos.
Cómo TrueFoundry resuelve la evaluación comparativa de LLM empresariales y la selección de modelos
La pasarela de IA de TrueFoundry está diseñada para que la evaluación de modelos en producción sea una capacidad continua para los equipos de plataforma empresariales, no un proyecto puntual. Los elementos que se describen a continuación están documentados en la documentación en vivo de la pasarela de IA y han sido verificados con el producto implementado.
División de tráfico sin cambios en el código.Modelos virtuales gestionan la división del tráfico de producción entre cualquier número de objetivos reales por porcentaje. Los equipos de ingeniería configuran la división en el editor YAML de la interfaz de usuario o mediante tfy apply -f loadbalancer-config.yaml para GitOps. El código de la aplicación no cambia: llama a un nombre de modelo virtual como support-bot/summarize, y la pasarela decide qué proveedor real gestiona cada solicitud. Las divisiones se pueden ajustar en tiempo real, del 1% al 10% al 50%, a medida que aumenta la confianza en el candidato.
Activadores de reversión automática integrados. Dos mecanismos complementarios rigen cuándo un objetivo se retira de la rotación. La configuración de tolerancia a fallos (configurable por modelo mediante allowed_failures_per_minute, cooldown_period_minutes y una lista de failure_status_codes) marca un objetivo como no saludable una vez que la tasa de error supera el umbral, y luego lo restaura automáticamente una vez que transcurre el período de enfriamiento. El límite de SLA (solo enrutamiento basado en prioridad) permite establecer un umbral de TPOT por objetivo; la pasarela monitorea una ventana móvil de 3 minutos y degrada un objetivo que lo supera. Las pruebas A/B de producción fallan de forma segura sin requerir supervisión humana fuera del horario laboral.
Seguimiento del costo por resultado en todos los modelos.Seguimiento de costos admite tanto el costo público (rellenado automáticamente a partir de las tarifas del proveedor) como el costo privado (contratos personalizados, modelos ajustados). El panel de métricas desglosa los costos por usuario, modelo, equipo o cuenta virtual, con una opción de “Ver por metadatos” que permite segmentar el gasto por cualquier etiqueta personalizada que haya adjuntado su aplicación. La exportación a CSV y una API HTTP para métricas brutas y agregadas facilitan la inserción de los datos en su pila de finanzas o inteligencia de negocios.
Almacenamiento en caché semántico que sobrevive a los cambios de enrutamiento.Caché semántico devuelve respuestas generadas previamente para solicitudes semánticamente similares, utilizando la similitud de coseno en la incrustación del último mensaje del usuario con un umbral configurable (el punto de partida recomendado es 0.9). Otros parámetros de la solicitud (modelo, mensajes anteriores, temperatura) se codifican por separado y deben coincidir exactamente, por lo que los aciertos de caché tienen un alcance estricto. Las entradas de caché están aisladas por usuario/cuenta virtual por defecto, con espacios de nombres personalizados opcionales para aplicaciones multiusuario. Los aciertos de caché devuelven una respuesta en milisegundos sin coste de modelo, independientemente del objetivo que la capa de enrutamiento hubiera seleccionado de otro modo.
Amplitud de proveedores en una única evaluación. TrueFoundry enruta a través de OpenAI, Anthropic (directo y a través de AWS Bedrock), Azure OpenAI, AWS Bedrock, AWS SageMaker, GCP Vertex AI, Cohere, Together AI, Mistral, Groq, Cerebras, xAI, Databricks, modelos autoalojados y otros (la lista completa está en la página de descripción general de AI Gateway). Los equipos pueden comparar AWS Bedrock Claude Sonnet 4.5 con los equivalentes de Azure OpenAI en una única prueba A/B sin un trabajo de integración separado para cada proveedor. La sobrecarga declarada de la pasarela es "típicamente inferior a 5 ms" con un rendimiento sostenido de más de 350 RPS en 1 vCPU, lo que mantiene la pasarela fuera de la ruta crítica incluso a escala de producción.
Run your first production model A/B test in under 30 minutes with TrueFoundry.
TrueFoundry's AI Gateway handles traffic splitting, cost-per-outcome tracking, and automatic rollback for live model evaluations. Book a demo to see the setup.
TrueFoundry AI Gateway ofrece una latencia de entre 3 y 4 ms, gestiona más de 350 RPS en una vCPU, se escala horizontalmente con facilidad y está listo para la producción, mientras que LitellM presenta una latencia alta, tiene dificultades para superar un RPS moderado, carece de escalado integrado y es ideal para cargas de trabajo ligeras o de prototipos.
Diseñado para la velocidad: ~ 10 ms de latencia, incluso bajo carga
¿Cómo diseñamos un conjunto de pruebas de referencia para un caso de uso en el que aún no tenemos datos de producción de los que tomar muestras?
Arrancar con datos sintéticos más un pequeño conjunto inicial curado por expertos. Pida a expertos en la materia que escriban manualmente entre 30 y 50 entradas representativas, y luego amplíelas con variaciones sintéticas: paráfrasis, casos extremos, variaciones de formato, variaciones de longitud. Valide las entradas sintéticas con su distribución de producción esperada lo mejor posible. La primera oleada de tráfico de producción real le proporcionará los datos necesarios para refinar el conjunto de datos, así que planifique revisar el conjunto de pruebas después de que esté disponible el primer mes de datos de producción. Trate el conjunto de datos inicial como una versión 0, no como una verdad fundamental permanente, y utilice los registros de solicitudes de TrueFoundry para obtener una muestra estratificada de entradas reales una vez que existan.
¿Cuál es la duración mínima para una prueba A/B en producción antes de que los resultados sean lo suficientemente fiables como para tomar una decisión de selección de modelo?
Dos semanas es un mínimo razonable para la mayoría de las aplicaciones empresariales. La razón es que dos semanas abarcan tanto los ciclos semanales (diferentes patrones de tráfico de lunes a viernes frente al fin de semana) como un ciclo completo de despliegue de la aplicación invocadora. Para tener confianza estadística en la comparación, el modelo candidato debe procesar al menos unos pocos miles de solicitudes: esto suele ser suficiente para distinguir una diferencia real de calidad o latencia del ruido, asumiendo que su tráfico genera una distribución significativa de entradas. Las decisiones de mayor riesgo (reemplazar un modelo en una aplicación de cara al cliente) suelen requerir cuatro semanas. Para decisiones de menor riesgo (intercambio de modelo en una herramienta interna), una semana con un volumen adecuado puede ser suficiente.
¿Cómo maneja TrueFoundry la reversión automática, qué la activa y con qué rapidez el tráfico vuelve al modelo original?
Dos mecanismos cubren la ruta de reversión de fallos. La configuración de tolerancia a fallos se establece por modelo con tres parámetros: `allowed_failures_per_minute` (cuántos errores se toleran), `cooldown_period_minutes` (cuánto tiempo se excluye el modelo una vez que supera el límite) y `failure_status_codes` (qué códigos HTTP se consideran fallos). Un objetivo que excede el umbral se marca como no saludable y se excluye del enrutamiento durante la duración del período de inactividad, para luego ser restaurado automáticamente. El límite de SLA está disponible para el enrutamiento basado en prioridad: se establece `time_per_output_token_ms` en un objetivo, y si el promedio móvil de 3 minutos excede el umbral (con al menos 3 muestras), el objetivo se mueve al final de la cadena de respaldo. Ambos mecanismos funcionan sin intervención humana. El efecto práctico es que, durante un despliegue defectuoso, un pequeño porcentaje del tráfico recibe el modelo erróneo antes de que sea retirado automáticamente, y los objetivos saludables continúan prestando servicio.
¿Puede TrueFoundry enrutar diferentes tipos de solicitudes a distintos modelos simultáneamente, de modo que podamos realizar pruebas A/B en un caso de uso sin afectar a otros?
Sí. Esto se logra mediante dos patrones. Primero, cree un modelo virtual por cada caso de uso: por ejemplo, `support-bot/summarize`, `code-bot/generate` y `extraction-bot/parse` son modelos virtuales independientes con sus propias reglas de enrutamiento y ponderaciones, de modo que una prueba A/B en el flujo de trabajo de resumen no afecta a la generación de código. Segundo, utilice filtros `metadata_match` en objetivos individuales dentro de un modelo virtual para limitarlos a tipos de solicitud específicos: un objetivo con `metadata_match: {task: "code_gen"}` solo recibe tráfico cuando los metadatos de la solicitud incluyen ese par clave-valor. El mismo enfoque funciona para el enrutamiento sensible a la región o al entorno: etiquete las solicitudes con `X-TFY-METADATA: {"region": "eu-west"}` desde su aplicación y añada bloques `metadata_match` en los objetivos que solo deban atender a esa región.
¿Cómo debemos comparar modelos para cargas de trabajo de IA con agentes, donde la calidad de una tarea de agente de varios pasos es más difícil de medir que una respuesta de una sola interacción?
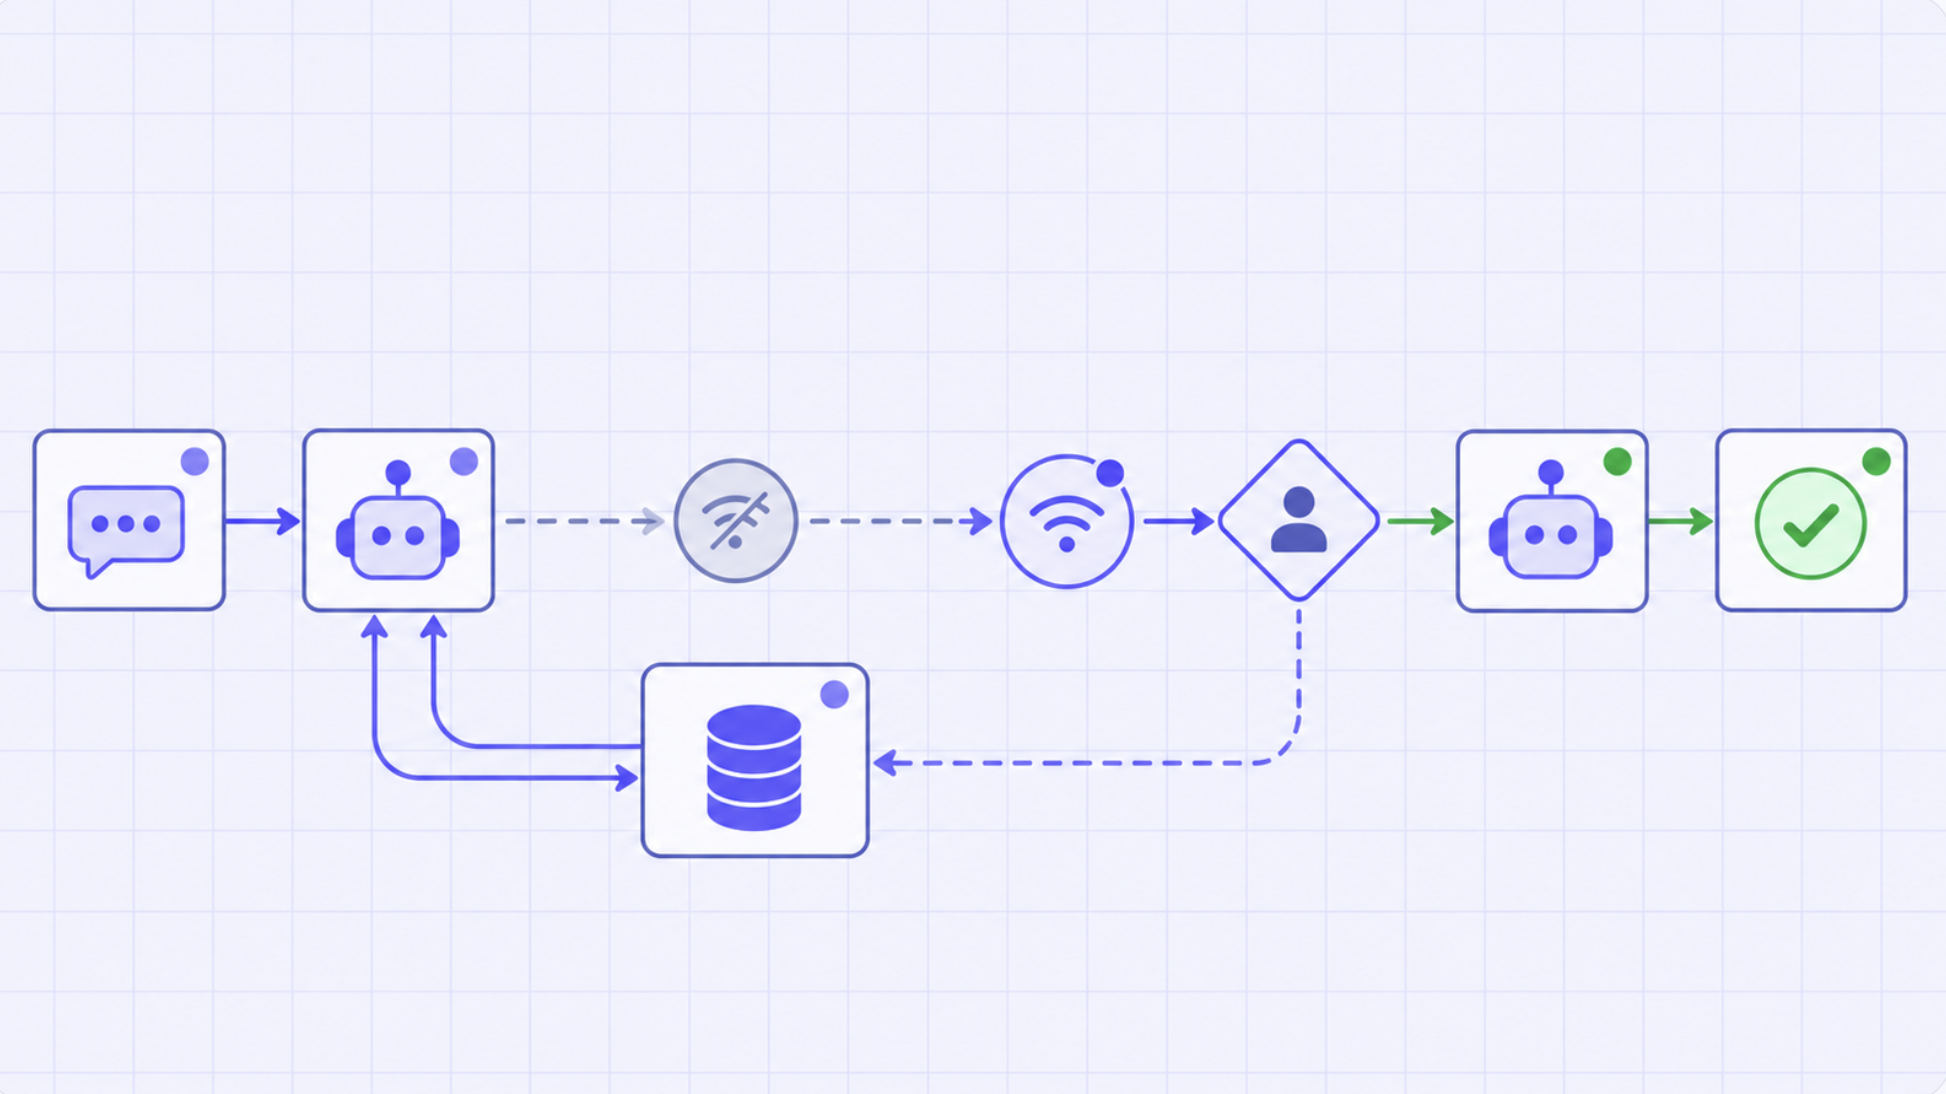
La calidad del agente debe medirse a nivel de resultado, no a nivel de cada interacción. Defina qué significa el éxito para la tarea de principio a fin (la reserva se realizó, el ticket se resolvió, el documento se extrajo correctamente) y mida eso como la señal principal. Las métricas por interacción son importantes para la depuración, pero no para la selección del modelo. Para la visibilidad a nivel de traza, el rastreo de solicitudes de TrueFoundry registra la solicitud completa y la respuesta de cada paso en la cadena, con un trace_id que las correlaciona, para que pueda reproducir una ejecución fallida del agente y ver dónde se interrumpió la cadena. Para la puntuación automatizada, un enfoque de "modelo juez" suele ser el más práctico: defina una rúbrica para "¿esta traza logró el objetivo declarado por el usuario?" y puntúe las trazas en función de ella. Ejecute el mismo ciclo de agente en múltiples modelos candidatos y compare las tasas de éxito de principio a fin en lugar de la precisión por paso. Sea más conservador con los porcentajes de implementación de pruebas A/B para cargas de trabajo de agentes (comience con el 1% en lugar del 5%), ya que los modos de fallo pueden acumularse a lo largo de los pasos.
¿Cuál es el sobrecoste de ejecutar pruebas en la sombra y vale la pena para la mayoría de los casos de uso empresariales?
Las pruebas en la sombra (shadow testing) duplican aproximadamente el gasto en modelos si se prueba cada solicitud contra una alternativa, por lo que el sobrecoste inicial es significativo. Hay tres formas de hacerlo más económico. Primero, prueba solo una fracción del tráfico: una tasa de prueba en la sombra del 10% te proporciona un flujo de evaluación continuo con una décima parte del sobrecoste de una prueba en la sombra completa. Segundo, prueba contra candidatos más pequeños y económicos en lugar de modelos premium: si estás evaluando si un modelo más pequeño podría reemplazar tu modelo premium actual, la prueba en la sombra en sí es económica. Tercero, ejecuta las pruebas en la sombra de forma asíncrona, donde la aplicación no necesita esperar, para que el presupuesto de latencia no se duplique. Si vale la pena o no, depende del coste de un despliegue de modelo defectuoso en tu contexto. Para aplicaciones de alto riesgo, el gasto suele justificarse al evitar incluso un solo incidente de regresión. Para casos de uso de menor riesgo, las pruebas A/B periódicas en el conjunto de candidatos probablemente te den suficiente información con un coste de estado estable mucho menor.


.png)






.png)
.png)
.png)
.png)
.png)
.png)
.png)
.png)
.png)
.png)