|
5 minutos de lectura


Obtenga acceso instantáneo a un entorno TrueFoundry en vivo. Implemente modelos, dirija el tráfico de LLM y explore la plataforma completa: su sandbox estará listo en segundos, sin necesidad de tarjeta de crédito.



Published:
.png)
¡Una forma increíblemente rápida de crear, rastrear e implementar sus modelos!
The Datadog MCP server is a remote Model Context Protocol server hosted by Datadog. It exposes your org as callable tools: an agent asks for logs matching a query, a metric series, a trace by ID or a monitor’s state, and gets structured data back.
It is organised into toolsets you enable per connection, so you spend model context only on the surface you need. core is the default.
Datadog’s tools reference lists well over two hundred tools — which is why the toolsets parameter exists, and why the tool-scoping section below matters here.
Because it is remote rather than local, there is no container to run: you point a client at a URL and authenticate, the same shape as the other remote MCP servers teams are standardising on. It is the observability MCP server most platform teams reach for first.
Single calls are not the interesting part — get_datadog_metric alone is a worse Datadog UI. The value shows up when tools chain:
The read/write split matters. Almost everything useful here is read. The write tools — creating monitors, upserting or deleting dashboards, updating cases, plus Remote Actions and Code Execution — are a smaller set with a far larger blast radius, and TrueFoundry labels them Destructive.
One SRE wiring Datadog into Claude Code during an on-call shift is fine. A whole platform org doing it is not.
Logs are the exfiltration path, and nobody treats them that way. This failure mode is specific to observability servers, and it belongs first. Application logs are where secrets go to die quietly: an API key in a request header logged wholesale, a connection string in a startup line, a customer’s address in a serialised order object. Teams accept that because log access is gated behind Datadog RBAC, and a human who greps for password is a known quantity. An agent calling search_datadog_logs is not. It pulls raw log lines into a model context, that context may reach a third-party inference provider, and it may end up quoted in a Slack summary. No credential was stolen, no policy broken — the data simply moved somewhere nobody modelled.
Query volume has a bill attached. Datadog pricing is usage-based and agents are good at looping. A poorly-prompted incident agent calls search_datadog_logs twenty times in one investigation, widening the window each round. Without per-tool call counts you find that on an invoice. [VERIFY — Datadog’s docs do not state that MCP tool calls are metered separately; treat this as a consequence of usage-based query pricing and confirm against your contract.]
Region mismatch produces useless errors. Datadog is site-specific, and the MCP URL plus every OAuth endpoint must point at your site. Get one wrong and you see a generic “Authentication failed” with nothing pointing at a hostname.
No attribution when it matters most. Datadog’s audit trail records that a query ran, not that your incident agent ran it on a prompt from a PagerDuty webhook. During a postmortem the trail stops at an API token.
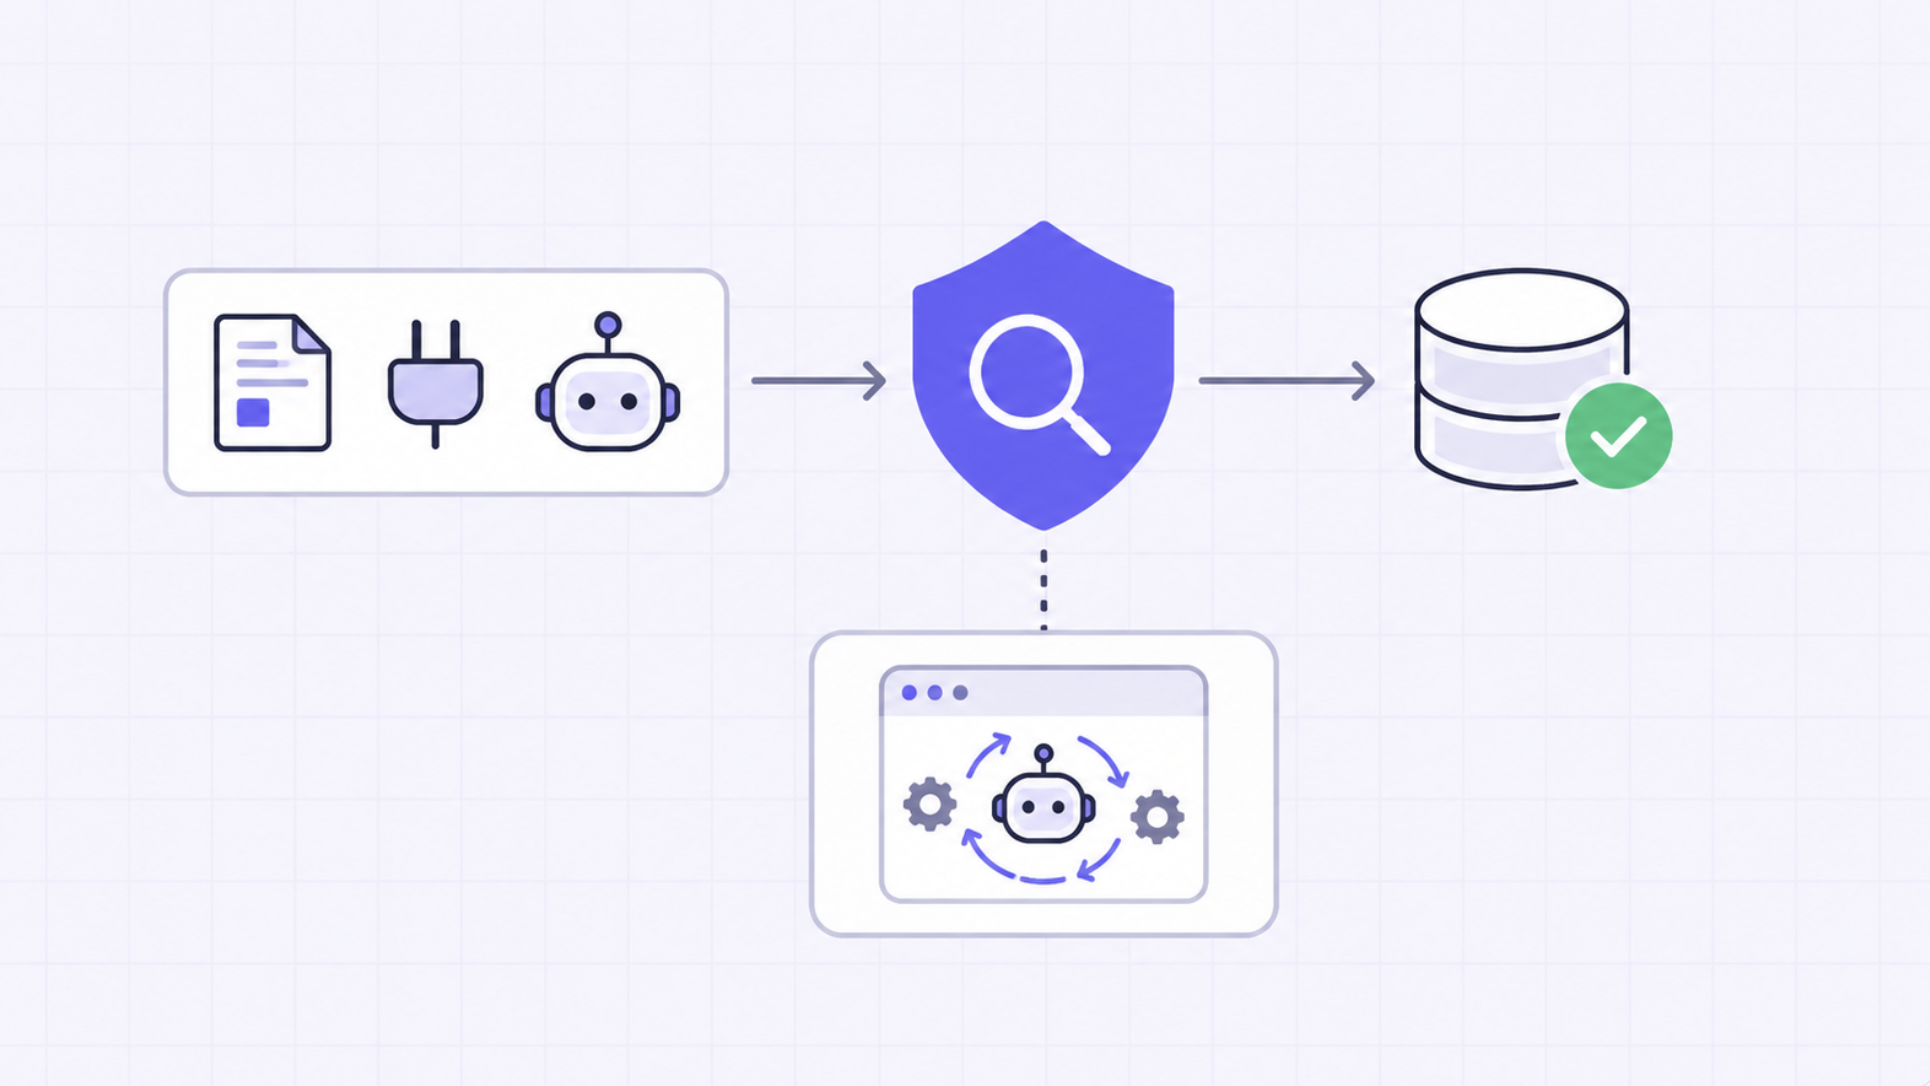
None of these argue against connecting Datadog. They argue for a control plane in front of it, which is what an MCP gateway is.
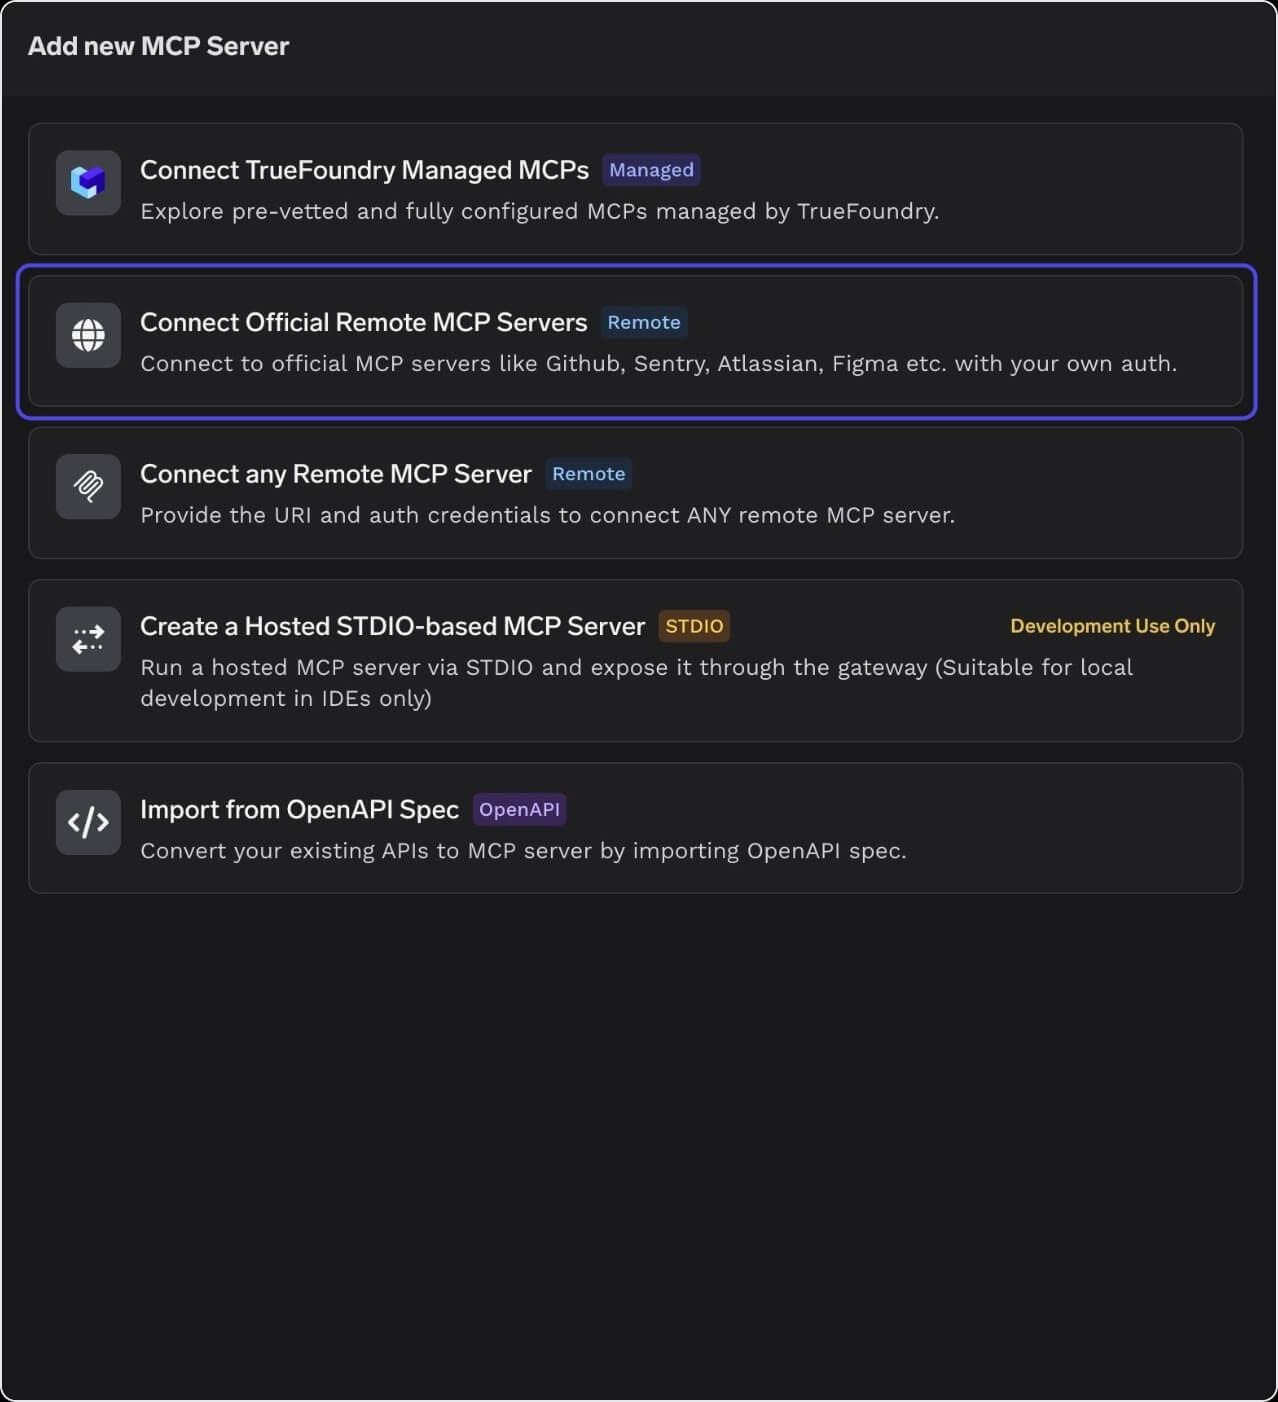
Datadog MCP setup does not run through the managed catalogue. It registers through Connect Official Remote MCP Servers — pre-vetted servers where the auth is templated but you own the connection. For Datadog that template includes OAuth2 with PKCE and Dynamic Client Registration (DCR): TrueFoundry registers the OAuth client automatically, so there is no OAuth app to build.
On the Datadog side you need MCP Access enabled on the org, mcp_read on your user (plus mcp_write for write tools), and your site domain. Government sites are not supported.
Step 1 — Open the picker. In MCP Servers, click Add new MCP Server and pick Connect Official Remote MCP Servers.
Step 2 — Find Datadog. Type data in the catalogue search and click the datadog card.
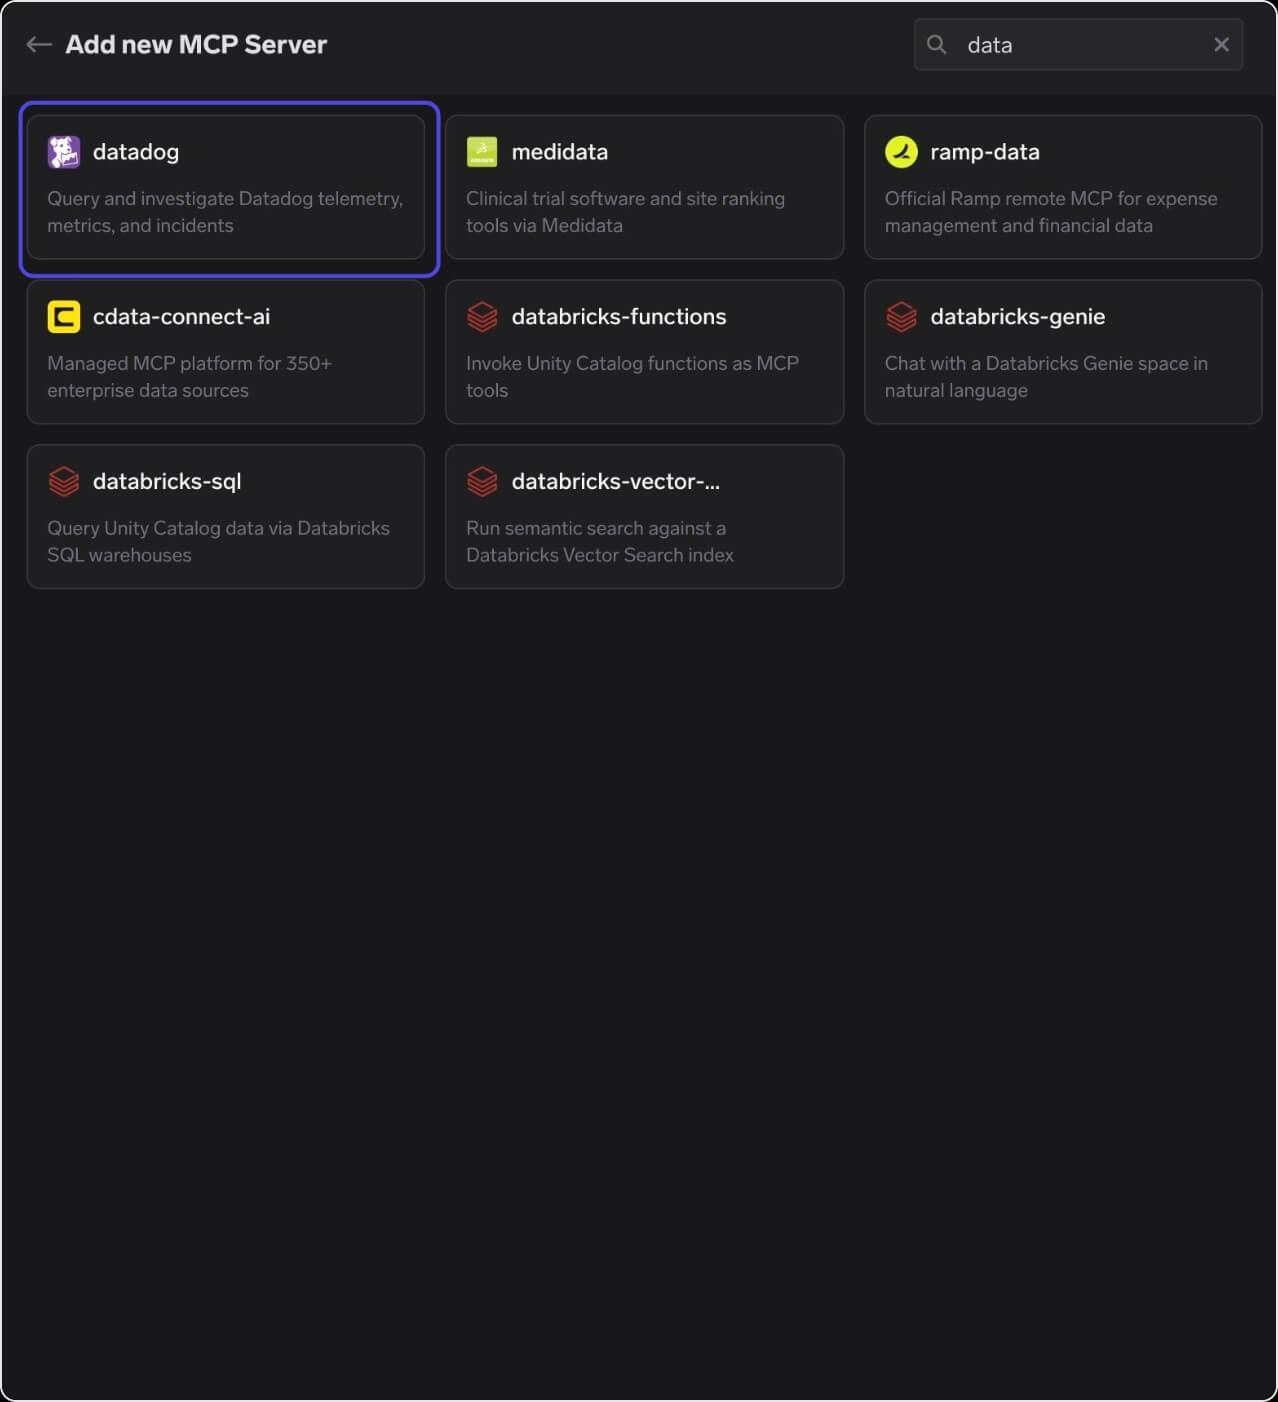
Official remote MCP catalogue search filtered to ‘data’, showing the datadog card next to medidata, ramp-data, cdata-connect-ai and databricks entries
Step 3 — Set your region in the URL. TrueFoundry pre-fills Name, Description and URL. The URL ships with a <region> placeholder that must be replaced with your Datadog site subdomain. Add yourself or your team under Collaborators as MCP Server Manager.
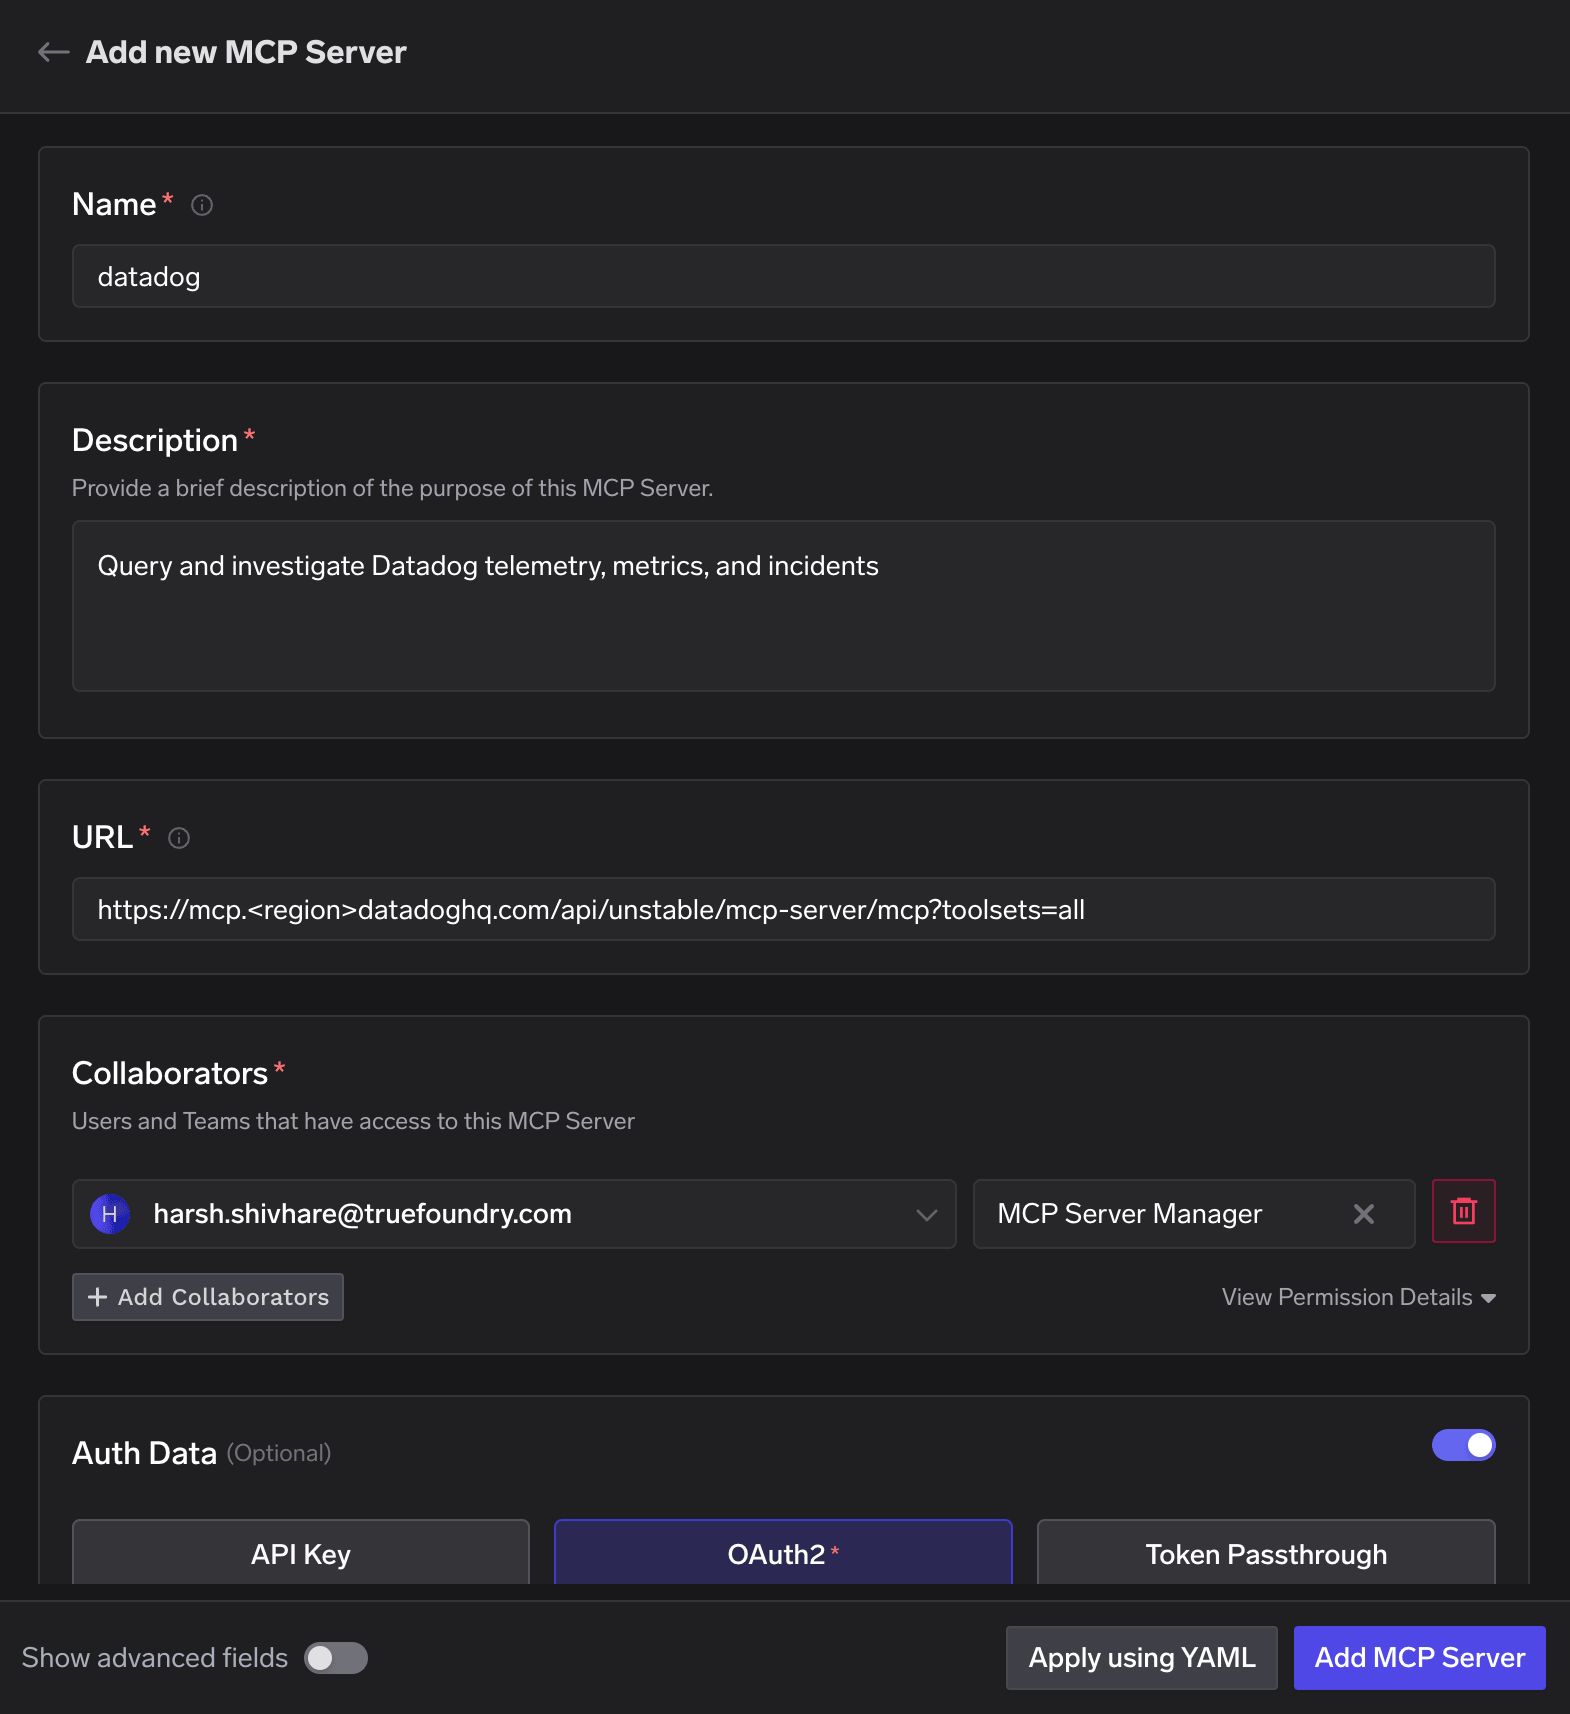
Add new MCP Server form showing Name datadog, the pre-filled description, the URL field containing a region placeholder, the Collaborators section, and Auth Data set to OAuth2
The shape is https://<mcp-host>/api/unstable/mcp-server/mcp?toolsets=all, with the host being mcp.datadoghq.com (US1), mcp.us3.datadoghq.com, mcp.us5.datadoghq.com, mcp.datadoghq.eu, mcp.ap1.datadoghq.com or mcp.ap2.datadoghq.com. The ?toolsets=all suffix is Datadog’s toolset selector — narrow it here (?toolsets=apm,core).
Step 4 — Confirm the OAuth2 / DCR details. TrueFoundry auto-populates the endpoints; click Refetch OAuth2 details if they are empty. Leave Client ID and Client Secret blank — DCR issues those at connection time.
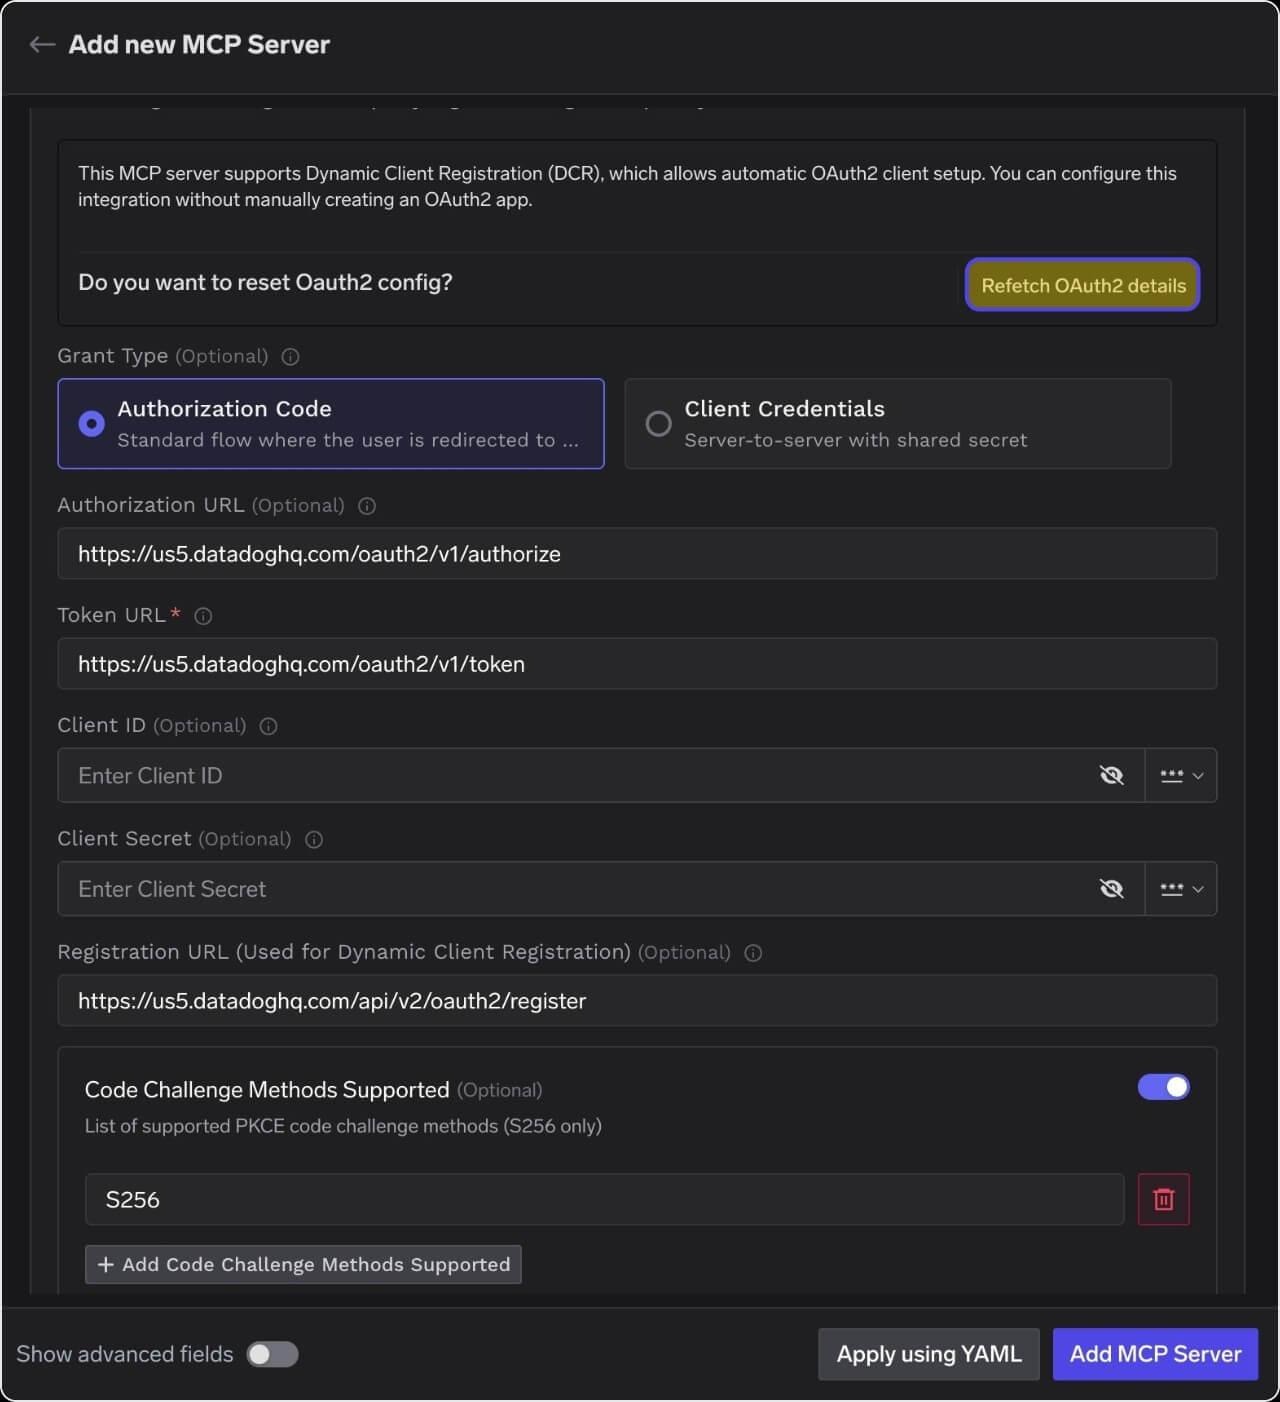
OAuth2 config panel showing the Dynamic Client Registration banner, the Refetch OAuth2 details button, Grant Type set to Authorization Code, Authorization URL, Token URL, Registration URL, and Code Challenge Methods Supported set to S256
For a US5 org:
TrueFoundry AI Gateway ofrece una latencia de entre 3 y 4 ms, gestiona más de 350 RPS en una vCPU, se escala horizontalmente con facilidad y está listo para la producción, mientras que LitellM presenta una latencia alta, tiene dificultades para superar un RPS moderado, carece de escalado integrado y es ideal para cargas de trabajo ligeras o de prototipos.


Datadog’s hosted remote Model Context Protocol server, exposing Datadog as tools an agent can call — searching and analysing logs, querying metrics, fetching traces and spans, reading monitors, dashboards, incidents, hosts and services, creating notebooks. Agents connect over a region-specific URL with OAuth2.
The Datadog MCP server tools are grouped into toolsets. core covers logs, metrics, traces, dashboards, monitors, incidents, hosts, services, events and notebooks. Product-specific toolsets add APM, Alerting, Database Monitoring, Error Tracking, Security, Cases, RUM, Synthetics, Kubernetes, Profiling, DDSQL and Audit Trail — several hundred in total. The full list appears on the Tools tab after authorization.
Yes, with two controls. Datadog’s model helps: MCP permissions grant no resource access on their own, so every user operates under their existing Datadog role. Add post-tool guardrails on log responses — logs carry secrets and PII you do not want reaching a model unfiltered — plus per-tool scoping so agents cannot reach write or code-execution tools.
Yes. TrueFoundry runs in your VPC, on-prem, air-gapped, or hybrid, so prompts and responses never leave your domain even as you route across many providers.
Yes. It includes an MCP Gateway, an Agent Gateway, and an MCP & Agents Registry with tool-level access control. Agents on LangGraph, CrewAI, AutoGen, or a custom framework can all be governed centrally.
Sí. La pasarela es compatible con OpenTelemetry y se integra con Grafana, Datadog, Prometheus o tu pila preferida. Rastrea cada solicitud desde la instrucción (prompt) hasta la ejecución de la herramienta y el modelo, así obtienes un registro unificado sin tener que reemplazar lo que ya tienes en funcionamiento.



Las últimas noticias, artículos y recursos enviados a tu bandeja de entrada
.png)
.png)
.png)
.png)
.webp)
.webp)