.webp)
July 4, 2026
|
5 min read

Published: July 4, 2026
Blazingly fast way to build, track and deploy your models!
Gateways are becoming the operational control plane of GenAI systems. They unify traffic for third‑party APIs (OpenAI, Anthropic, Mistral, Bedrock) and self‑hosted models, enforce policy, and expose a single pane of glass for latency, errors, token consumption, and spend. That same choke point is the ideal place to capture traces, compute model‑level and user‑level analytics, and trigger guardrails and alerts—without adding latency to the request path.
Real organizations have learned this the hard way. Consider a support copilot serving thousands of agents. One afternoon, an innocuous prompt update increases output length by ~40%. Agent satisfaction falls as responses lag; finance notices the bill. With gateway observability, you would see p95 latency and output tokens climbing for the affected route, correlate it to the deployment or prompt version, and roll back—ideally with an automated alert set to catch it next time.
This post recaps what an AI Gateway is, why observability is critical, and the concrete metrics, dashboards, and workflows teams should put in place. We’ll also show how TrueFoundry’s AI Gateway ships the observability stack out of the box: unified analytics (latency, TTFT/ITL, errors), granular cost tracking, customer/user‑level breakdowns, healthy/failed routing visibility, and scalable, low‑overhead collection built into the architecture.
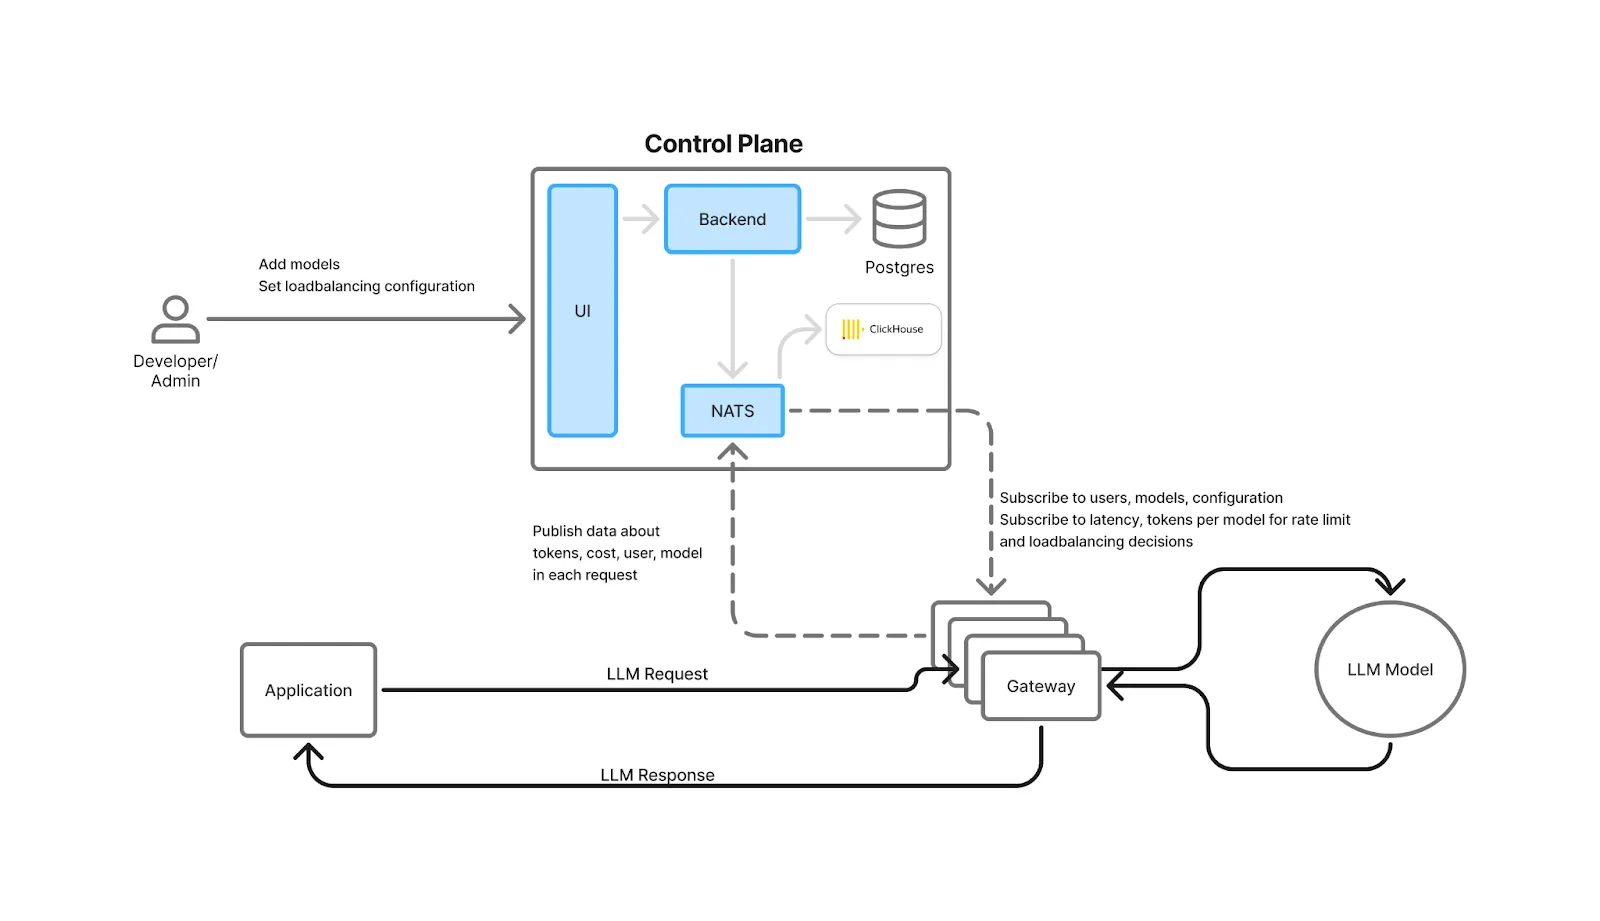
An AI Gateway is a thin, high‑performance layer that proxies application requests to one or more LLM providers or self‑hosted models. It unifies APIs, centralizes authentication and RBAC (Role Based Access Control) , applies rate limits and guardrails, performs load balancing and failover, and captures observability and cost data for every request. Think of it as the “ingress + policy + telemetry” layer for GenAI.
Operationally, modern gateways support weighted and latency‑based routing, health checks, and automatic fallbacks when a model or region is unhealthy—so requests continue even through provider hiccups. Because every request passes through the gateway, teams can compare providers by latency and cost, making OpenRouter vs AI gateway a practical evaluation when deciding how to manage routing, observability, and control at scale.
TrueFoundry’s architecture is designed so these controls and metrics add minimal overhead: checks for auth, rate limiting, and load balancing are done in‑memory; logs/metrics are written asynchronously to a queue; and the request path avoids external calls (unless you opt into caching). The gateway is horizontally scalable and CPU‑bound, keeping end‑to‑end latency overhead to single‑digit milliseconds.
LLM latency is multi‑modal: there’s time to first token (TTFT), inter‑token latency (ITL) for streaming, and total request latency. Each affects perceived UX differently. Gateways that track all three help you diagnose whether slowdowns come from provider queues, model compute, network, or prompt length—and choose the best routing strategy.
Tokens are the new CPU cycles. A single prompt can fan out to multiple tools or retrieval steps, and costs accumulate across providers. Observability must attribute spend by model, provider, environment, application, tenant, and user and stay current with providers’ public pricing to avoid manual spreadsheets.
Production apps need guardrails against provider outages, throttling, and model regressions. Observability tied to health checks, 4xx/5xx code breakdowns, retry/fallback rates, and rate‑limit utilization lets you enforce SLOs and automatically fail over when performance deteriorates.
Enterprises need full request/response trails with access controls and PII/content moderation policies. A gateway centralizes this enforcement and logging so teams can prove who called which model, with what data, and what it returned—without sharing provider API keys broadly.
Model quality, pricing, and quotas change frequently. Organizations that instrument gateways can compare providers head‑to‑head and shift traffic based on fresh latency/cost/error data—maintaining performance and margins as the market evolves.
External guidance echoes these needs: industry leaders emphasize AI observability for rapid response to drift, outages, and cost spikes; OpenAI and Azure recommend structured logging and exponential backoff for rate limits, which a gateway can standardize across apps.
Below are capabilities you should expect from a production‑grade AI Gateway—and that TrueFoundry provides natively.
Key Metrics for Evaluating Gateway
| Criteria | What should you evaluate ? | Priority | TrueFoundry |
|---|---|---|---|
| Latency | Adds <10ms p95 overhead for time-to-first-token? | Must Have | ✅ Supported |
| Data Residency | Keeps logs within your region (EU/US)? | Depends on use case | ✅ Supported |
| Latency-Based Routing | Automatically reroutes based on real-time latency/failures? | Must Have | ✅ Supported |
| Key Rotation & Revocation | Rotate or revoke keys without downtime? | Must Have | ✅ Supported |
| Key Rotation & Revocation | Rotate or revoke keys without downtime? | Must Have | ✅ Supported |
| Key Rotation & Revocation | Rotate or revoke keys without downtime? | Must Have | ✅ Supported |
| Key Rotation & Revocation | Rotate or revoke keys without downtime? | Must Have | ✅ Supported |
| Key Rotation & Revocation | Rotate or revoke keys without downtime? | Must Have | ✅ Supported |

Here is how TrueFoundry bakes observability into the core request path and ships a full analytics stack out of the box—without slowing down production traffic.
.webp)
The Analytics dashboard exposes: Request Latency (p50/p95/p99), Time to First Token (TTFT/TTFS), Inter‑Token Latency (ITL), cost per model/provider, input/output tokens, error codes, and policy activity (rate‑limit, load‑balancing, fallbacks, guardrails, budgets). Views slice by model, user, team, ruleId, and custom metadata; you can also download raw CSVs.
Enable Public Cost to auto‑populate per‑token pricing from providers’ published rates (OpenAI, Anthropic, Bedrock, etc.). For negotiated or fine‑tuned models, set Private Cost with custom input/output token prices. Both flow into per‑request and aggregate cost analytics.
Attach business context (customer, feature, environment) and break down tokens, latency, and spend by any dimension—ideal for chargebacks, noisy‑neighbor detection, and prioritizing optimizations.
.webp)
Define quotas by tokens or requests per minute/hour/day, scoped to users, models, or segments identified via metadata. Dashboards show utilization and throttles so you can right‑size limits and protect shared capacity.
Use weight‑based splits for experiments or latency‑based routing for steady‑state. Health checks mark backends unhealthy on error/latency thresholds and exclude them automatically. Fallback chains retry on failure, with spans and metrics that show which path was taken and its latency/cost impact.
Centralize provider keys, issue scoped access tokens, enforce RBAC, and retain immutable request/response logs for compliance—across LLMs and MCP servers
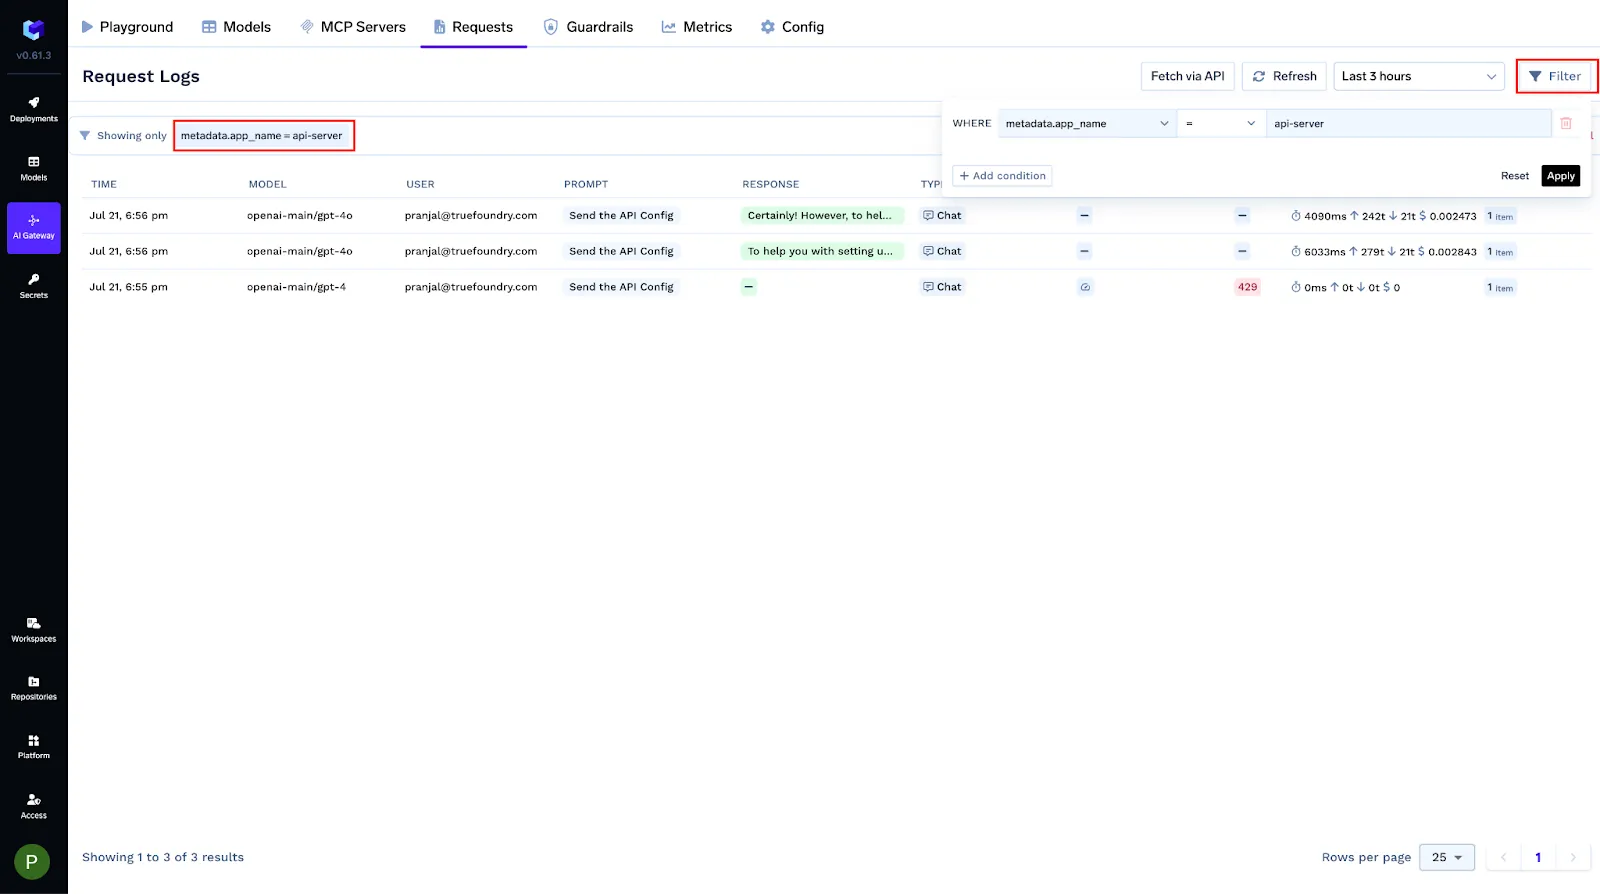
You can tag every request with structured metadata via the X-TFY-METADATA header. Logged keys become queryable filters, Grafana labels, and conditions in gateway configs (rate limits, load balancing, fallbacks, guardrails). Values are strings (≤128 chars).
X-TFY-METADATA: {"tfy_log_request":"true","environment":"staging","feature":"countdown-bot","customer_id":"acme-42"}


Use this to isolate logs, group cost/latency by tenant or feature, and roll out policy changes safely to a subset of traffic.

Example — rate‑limit by metadata

name: ratelimiting-config
type: gateway-rate-limiting-config
rules:
  - id: openai-gpt4-dev-env
    when:
      models: ["openai-main/gpt4"]
      metadata:
        env: dev
    limit_to: 1000
    unit: requests_per_day
The same when metadata pattern applies to load balancing and fallback rules
The gateway is OpenTelemetry‑compliant. Turn on OTLP export and send traces to any backend (Tempo, Jaeger, Datadog/New Relic via Collector, TrueFoundry Tracing). Spans include genai attributes—model, tokens, TTFT, ITL, parameters, tool calls, errors—and detailed spans for rate limiting, load balancing, fallbacks, and MCP server/tool calls, letting you correlate provider behavior with app‑level spans.
Enable tracing
ENABLE_OTEL_TRACING="true"
OTEL_SERVICE_NAME=<your_service>
OTEL_EXPORTER_OTLP_TRACES_ENDPOINT="https://<otel-collector>/v1/traces"
OTEL_EXPORTER_OTLP_TRACES_HEADERS="Authorization=Bearer <token>"
Representative spans
.webp)
Expose /metrics for Prometheus or push OTEL metrics by setting:

ENABLE_OTEL_METRICS="true"
OTEL_EXPORTER_OTLP_METRICS_ENDPOINT="https://<otlp-endpoint>/v1/metrics"
OTEL_EXPORTER_OTLP_METRICS_HEADERS="Authorization=Bearer <token>"
LLM_GATEWAY_METADATA_LOGGING_KEYS='["customer_id","request_type"]'

Metadata keys listed in LLM_GATEWAY_METADATA_LOGGING_KEYS become Prometheus labels llm_gateway_metadata_<key>, enabling per‑customer/per‑feature cost and latency charts. (Truefoundry Docs)
Metadata keys listed in LLM_GATEWAY_METADATA_LOGGING_KEYS become Prometheus labels llm_gateway_metadata_<key>, enabling per‑customer/per‑feature cost and latency charts. (Truefoundry Docs)
Key metric families (subset)
Tokens & cost: llm_gateway_input_tokens, llm_gateway_output_tokens, llm_gateway_request_cost.
Latency: llm_gateway_request_processing_ms, llm_gateway_first_token_latency_ms, llm_gateway_inter_token_latency_ms.
Errors: llm_gateway_request_model_inference_failure, llm_gateway_config_parsing_failures.
Policy activity: llm_gateway_rate_limit_requests_total, llm_gateway_load_balanced_requests_total, llm_gateway_fallback_requests_total, llm_gateway_budget_requests_total, llm_gateway_guardrails_requests_total.
Agent/MCP: llm_gateway_agent_request_duration_ms, llm_gateway_agent_llm_latency_ms, llm_gateway_agent_tool_latency_ms, llm_gateway_agent_tool_calls_total, llm_gateway_agent_mcp_connect_latency_ms, llm_gateway_agent_request_iteration_limit_reached_total.
A pre‑built Grafana dashboard JSON is published by TrueFoundry, organized into モデル、 ユーザー、 設定、および MCP呼び出し ビューです。カスタムメタデータ用の変数を追加します。例:
label_values(llm_gateway_input_tokens, llm_gateway_metadata_customer_id).webp)
Anthropicのモデルコンテキストプロトコル(MCP)は、2024年11月25日に発表され、アシスタントがツール、プロンプト、リソースに接続する方法を標準化します。このエコシステムは、2025年を通じて、多くの事前構築済みサーバー(GitHub、Slack、Googleマップ、Puppeteerなど)によって加速しました。
TrueFoundryはMCPをネイティブに統合します。
これにより、ゲートウェイはエージェントワークロードの運用制御プレーンとなり、ポリシー、認証、ルーティング、およびLLM呼び出しとツール実行の両方におけるエンドツーエンドの可視性を統合します。
以下は実用的なチェックリストです。各メトリクスには、それが示す内容、使用方法、およびTrueFoundryがそれをどのように表示するかが含まれています。
プロンプトの変更により、エンタープライズ顧客向けの出力の冗長性が増加しました。症状:出力トークンの増加、p95レイテンシの上昇、日次支出の増加。TrueFoundryでの対応:分析により、「support‑prod」環境での出力トークンの急増と、プライマリモデルのコスト急上昇が示されました。TTFTが低く、出力トークンが安価な代替プロバイダーと比較し、重みベースのルーティングでトラフィックの30%をシフトし、「会話あたりのコスト」にアラートを設定します。
IST午前10時、エラー率が429に上昇しました。 TrueFoundryでの対応: レート制限ダッシュボードにより、アップストリームからのスロットリングが確認されました。フォールバックチェーンが作動し、ルーティングはより健全なバックエンドにシフトします。ユーザーエクスペリエンスを安定させ、その後、トークンクォータとバックオフパラメータを調整します。
ユーザーは「回答は速く始まるが、その後はもたつく」と報告します。 TrueFoundryでの対応: TTFTは問題ないものの、プライマリモデルではITLが高くなっています。レイテンシベースのルーティングにより、ストリーミングスループットがより優れたプロバイダーが自動的に優先されます。また、ITL p95にアラートを設定します。
ある顧客のバッチジョブがトークンを占有し、他のすべてのユーザーの処理を遅らせます。 TrueFoundryでの対策: 顧客ごとのトークンベースのレート制限により、公平な利用が保証され、SLOが保護されます。分析機能で利用状況と拒否された回数を確認できるため、より高いクォータをアップセルできます。
LLMアプリケーションは動的なシステムです。モデルは進化し、プロバイダーはクォータや価格を変更し、プロンプトは変化し、ユーザーの行動は予期せぬものとなることがあります。最も 最適なAIゲートウェイ は、適切なシグナルを収集し、それらをアクションに変えることができれば、それらすべてを監視、制御、最適化できる場所です。
TrueFoundryのAIゲートウェイは、その運用コマンドセンターを提供します。低オーバーヘッドでレイテンシー(TTFT/ITL)、トークン、コスト、エラーを捕捉し、トークンを考慮したレート制限、RBAC、ガードレールを適用します。また、ルーティング、ヘルス、フォールバックの可視性を提供することで、高速で信頼性が高く、費用対効果の高いエクスペリエンスを維持できます。詳細な顧客/ユーザー分析と自動化された最新のコスト配分により、チームは事後的な問題解決から事前的な最適化へと移行できます。
GenAIスタックを集中管理している場合、または散在する単発の統合を整理している場合は、まずゲートウェイ経由でトラフィックをルーティングし、上記のダッシュボードを有効にし、SLOに合わせたアラートをいくつか設定してください。これにより、より迅速なデプロイ、コスト抑制、エージェントとユーザーの満足度維持に必要な可視性を得られます。
AIゲートウェイにおける可観測性は、そうでなければ不透明な複雑な多段階推論やツール呼び出しを追跡するのに役立ちます。エージェントの実行パスを監視することで、無限ループ、ハルシネーション、非効率なツール使用をリアルタイムで検出できます。この可視性により、自律型エージェントが多様な外部システムやAPIと連携する際に、信頼性、予測可能性、予算内での運用を維持できます。
AIゲートウェイの可観測性は、異なるモデルプロバイダー間でのレイテンシー、スループット、エラー率をリアルタイムで追跡することで、LLMのパフォーマンスを最適化します。Time to First Token (TTFT) や Inter-Token Latency (ITL) のような詳細なメトリクスを捕捉することで、チームは推論チェーン内の特定のボトルネックを特定できます。これらの洞察により、開発者はモデルの速度を客観的に比較し、スマートルーティングを実装して、エンドユーザーに高速なパフォーマンスを保証できます。
AIゲートウェイの可観測性は、モデル、チーム、ユーザー全体でのトークン消費に関する詳細な可視性を提供することで、コストを削減します。リクエストごとおよびワークスペースごとの費用を追跡することで、チームは暴走するプロンプトや非効率なワークフローを即座に特定できます。このデータは、セマンティックキャッシュ、トークンを考慮したレート制限、より安価なモデルへのクエリルーティングなど、手動介入なしで自動化されたコスト削減戦略をサポートします。
AIゲートウェイの可観測性は、すべてのリクエストとレスポンスの一元化された不変のログを保持することで、コンプライアンス監査をサポートします。最新のシステムは、ユーザーID、タイムスタンプ、PIIマスキングイベントなど、機密データを保護するための詳細な監査証跡を記録します。これらのログは、モデルのインタラクションに対する完全な透明性を提供することで、企業がGDPRやSOC 2などの規制基準を満たすことを保証し、多くの場合、すべてのテレメトリーは組織のセキュアなクラウド環境内に保持されます。
TrueFoundryは、AIゲートウェイの可観測性を通じて複数のモデルプロバイダーを単一のコントロールプレーンに統合することで、AIインフラ管理を簡素化します。TrueFoundryは、リクエストレベルのテレメトリーとGPUおよびCPUの使用率を関連付け、リソース割り当てを最適化し、無駄を削減します。この統合されたアプローチにより、プラットフォームチームは、AWS、GCP、またはAzureアカウント内で、多様な環境にわたるデプロイ、スケーリング、およびセキュリティポリシーをネイティブに管理できます。
TrueFoundry AI Gateway delivers ~3–4 ms latency, handles 350+ RPS on 1 vCPU, scales horizontally with ease, and is production-ready, while LiteLLM suffers from high latency, struggles beyond moderate RPS, lacks built-in scaling, and is best for light or prototype workloads.


最新のニュース、記事、リソースをメールでお届けします
© 2026 無断複写・転載を禁じます。


.png)


.webp)
.webp)