August 27, 2025
|
Lesedauer: 5 Minuten


Erhalten Sie sofortigen Zugriff auf eine TrueFoundry-Live-Umgebung. Stellen Sie Modelle bereit, leiten Sie den LLM-Verkehr weiter und erkunden Sie die gesamte Plattform — Ihre Sandbox ist in Sekundenschnelle einsatzbereit, ohne dass eine Kreditkarte erforderlich ist.


Published: June 4, 2026
Unglaublich schnelle Methode zum Erstellen, Verfolgen und Bereitstellen Ihrer Modelle!
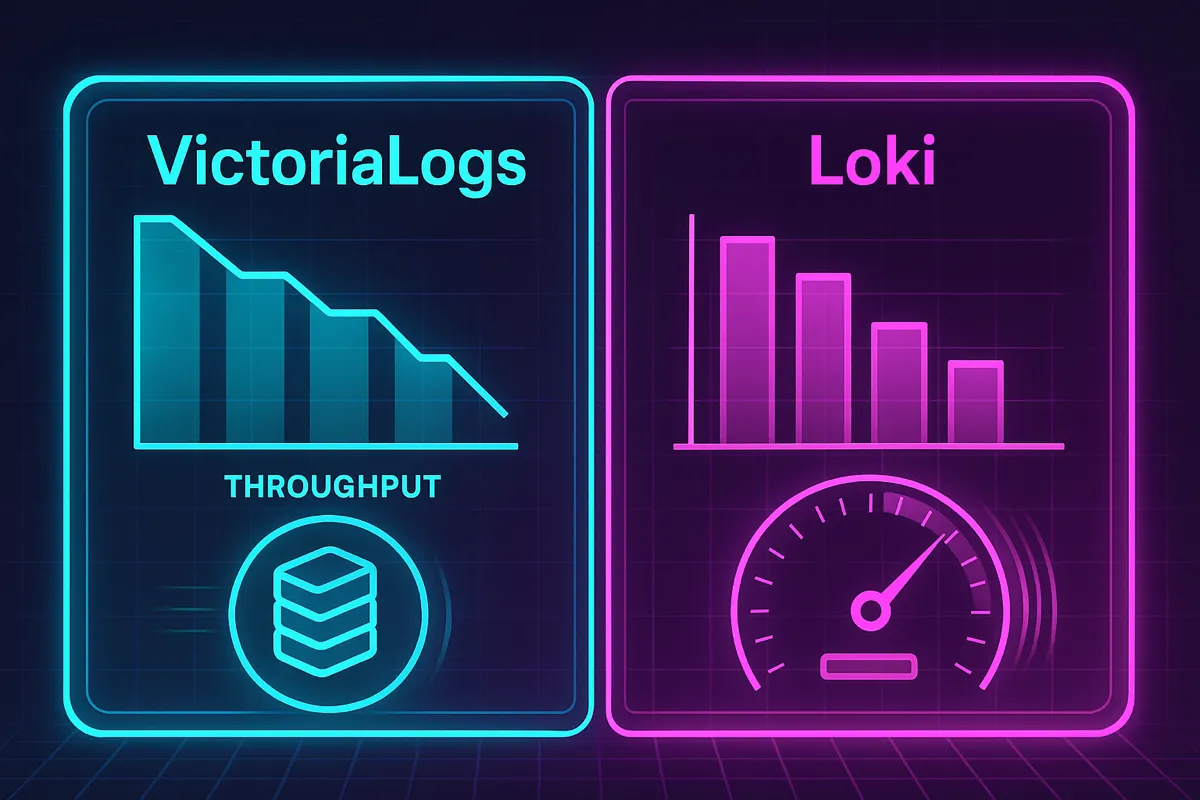
TL; DR — Nach Paralleltests mit einem Workload von 500 GB/7 Tagen verkürzte VictoriaLogs die Abfragelatenzen um 94%, Speicherplatz verkleinert um ≈ 40%, und verbrauchte < 50% der CPU und des Arbeitsspeichers, die wir zuvor Loki zugewiesen hatten. Dieser Beitrag erklärt warum wir haben gewechselt.
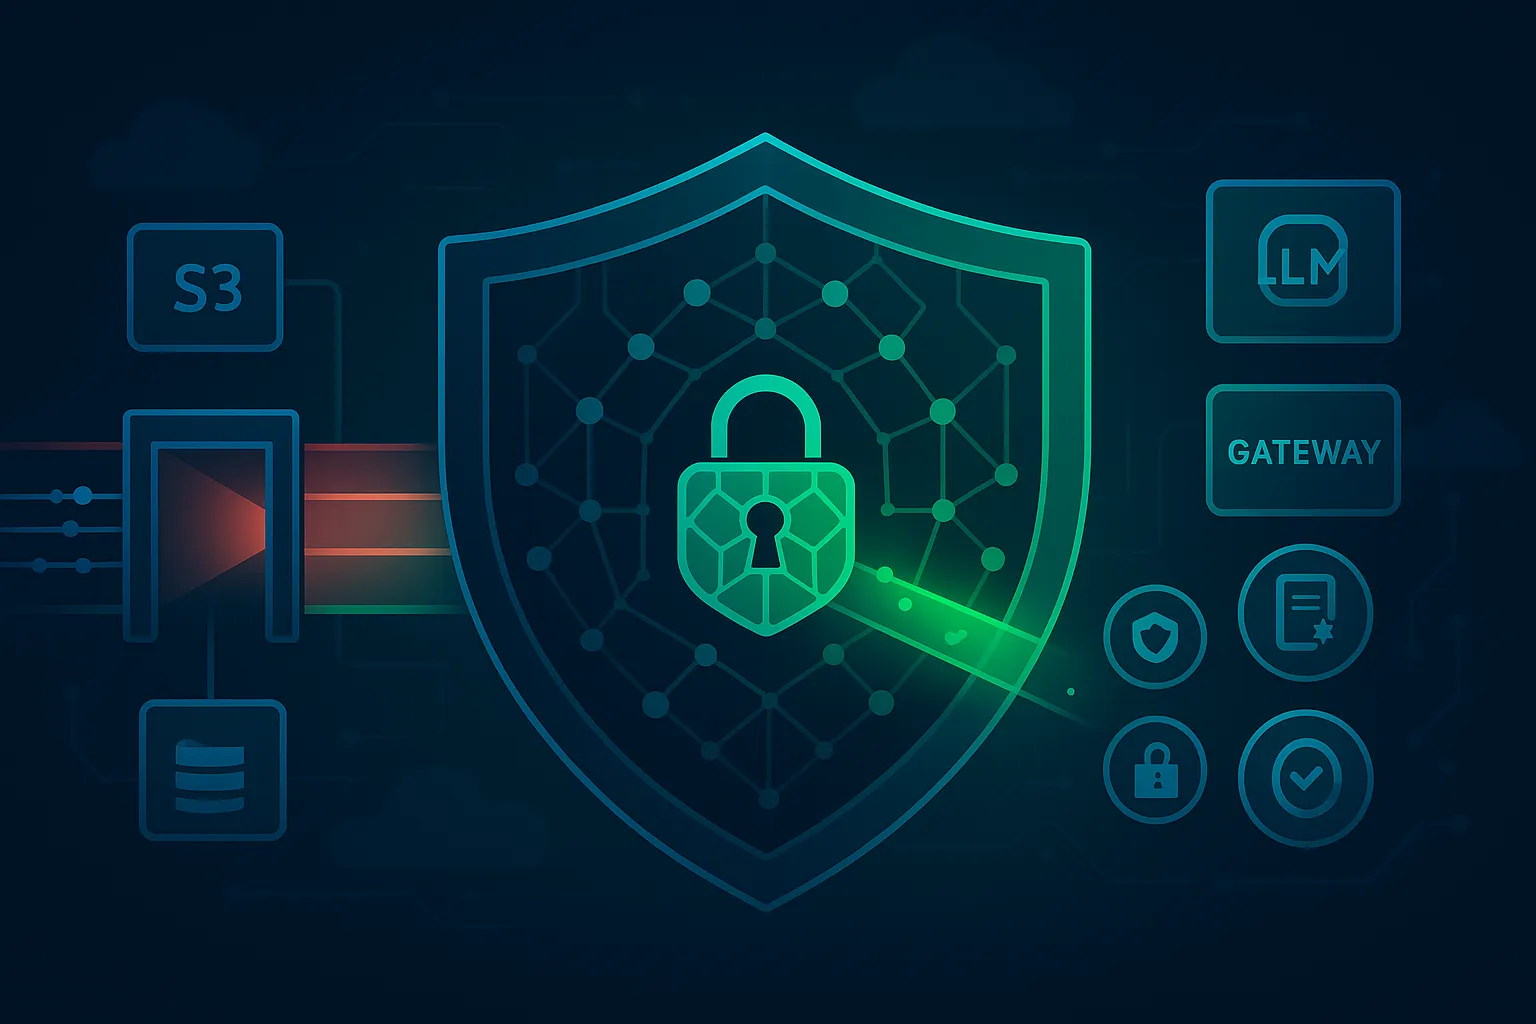
Truefoundry hilft Entwicklern dabei, mehrinstanzenfähige ML-Workloads auf Kubernetes auszuführen.
Entwickler benötigen:
Loki hat uns anfangs gute Dienste geleistet, aber als das Volumen zunahm, sahen wir Suchlatenzen von >30 s und eine hohe I/O-Verstärkung. Dies löste eine Evaluierung von VictoriaLogs aus.
Loki ist das Log-Aggregationssystem von Grafana‑Labs, das Logs in komprimierten Blöcken zusammen mit einem Index speichert, der aus Beschriftungen (Schlüssel-Wert-Paare). Abfragen werden ausgedrückt in LogQL und verlassen sich stark auf Etikettenfilter, gefolgt von Zeilenfiltern.
Victoria Logs ist eine Protokolldatenbank des VictoriaMetrics-Teams. Sie verwendet spaltenförmig LSM‑Stil Speicher mit Indizes pro Feld, SIMD-beschleunigter Suche und SQL-ähnliches LogSQL Syntax.

[UNIQUE-STATIC-LOG] ID=ABC123 XYZ in einem mit vielen Protokollen gefüllten Namespace über 7 Tage.Zweck: Gesamtzahl der Log-Zeilen von app="servicefoundry-server“
Zweck: Suche nach einer eindeutigen statischen Log-Zeile in echte Gießerei Namensraum
Zweck: Suche nach bekanntem Neustartmuster :3000 in einer kleinen Teilmenge von Protokollen (die auf einen einzelnen Shard abzielen)
Es wurde verifiziert, dass die Ergebnissätze identisch sind.
Zweck: Sucht nach einem nicht existierenden Protokoll und löst eine vollständige Datensuche aus
Es wurde verifiziert, dass die Ergebnissätze identisch sind.
Bei 500 GB Verarbeitungsdaten verhielt sich Loki seltsam. Die Ressourcen waren erstickt. und die Abfrageantwort wurde gestoppt.
Unsere Bewertung konzentrierte sich auf drei Dimensionen, die für Plattformingenieure täglich von Bedeutung sind:
Warum die Lücke? VictoriaLogs verwaltet einen Index pro Token, sodass selbst Regex‑ähnliche Scans indexunterstützt werden. Loki hingegen filtert nach einer Labelabfrage Zeile für Zeile, was zu einem Brute-Force-Scan wird, wenn der Labelsatz breit ist.
Wir haben auch die Einnahme mit 120 Replikaten unserer auspeitschen Generator.
Die Ergebnisse waren augenöffnend:
Loki:
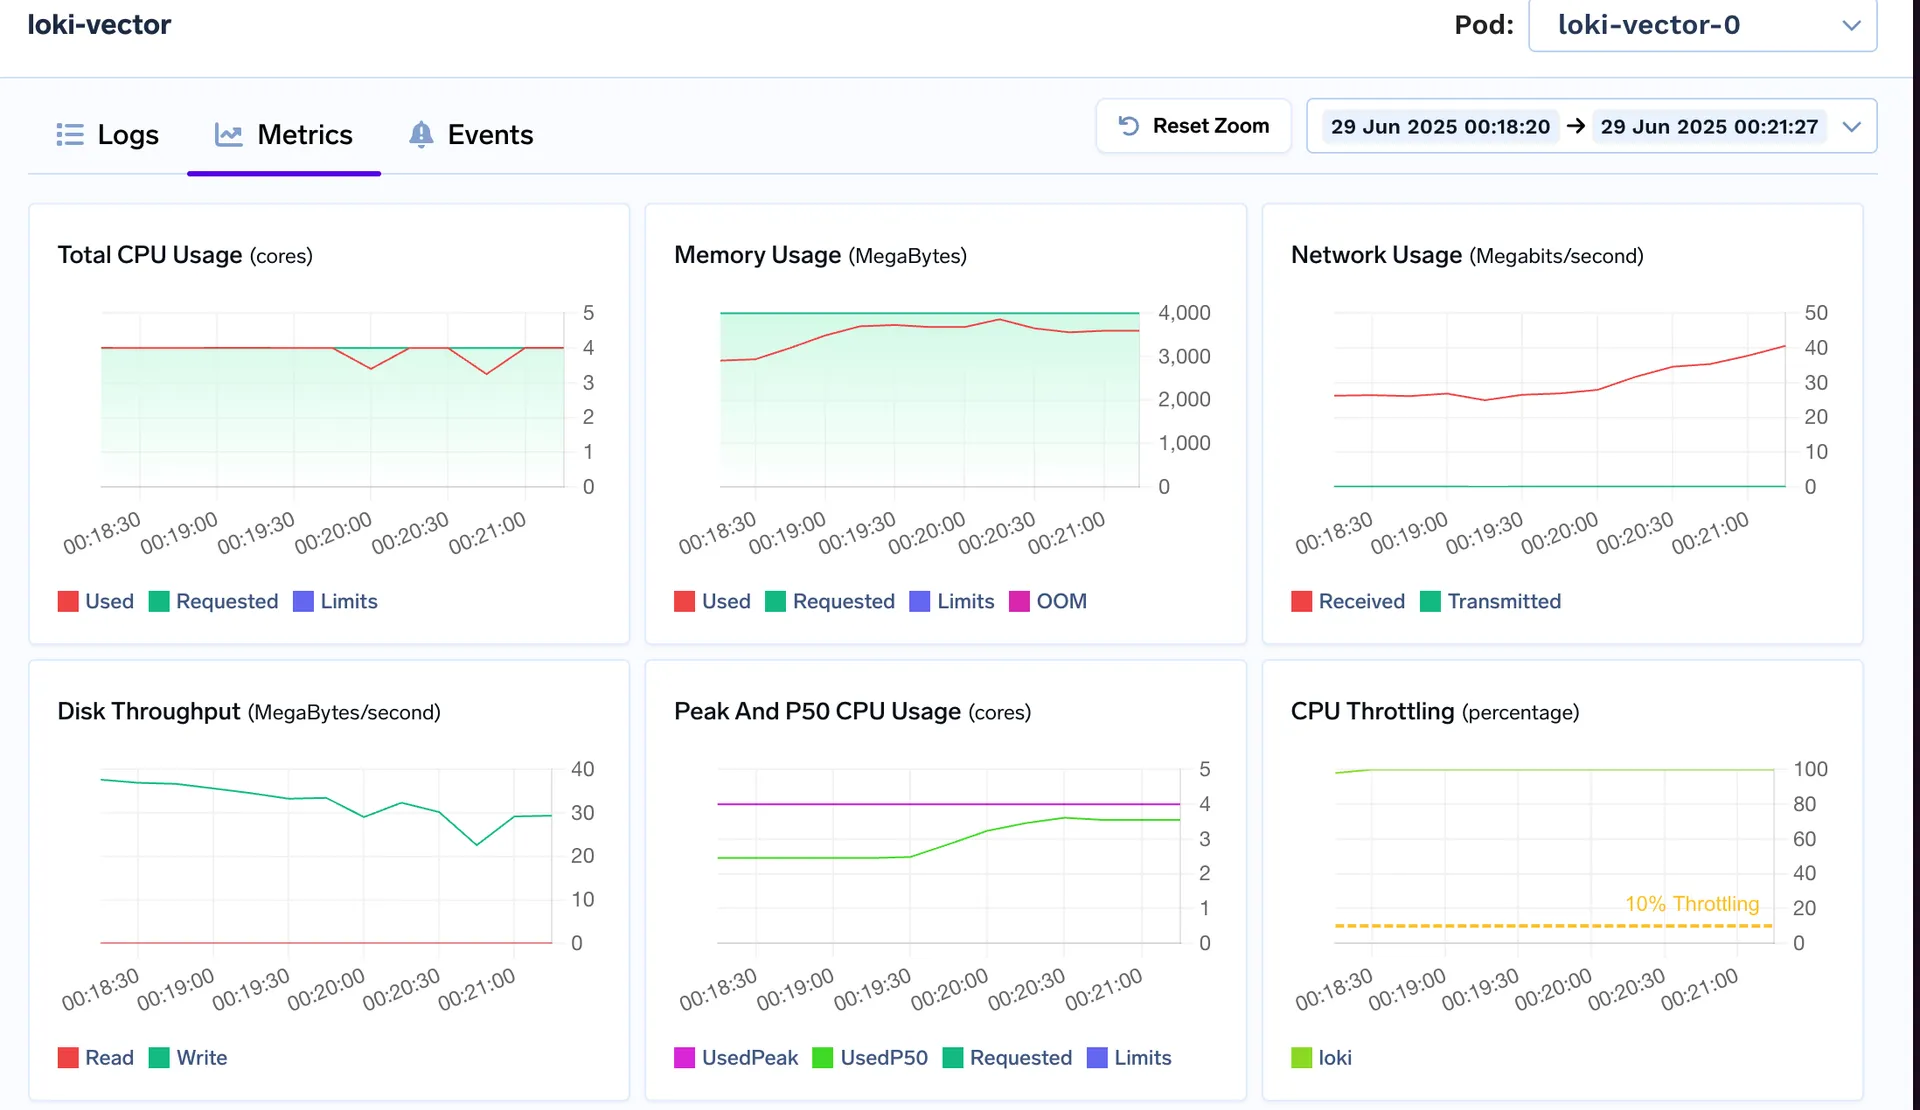
Loki erreicht Spitzenwerte von 3—4 vCPU, nähert sich seinem 8-GiB-Limit und zeigt Drosselung bei gleicher Arbeitslast
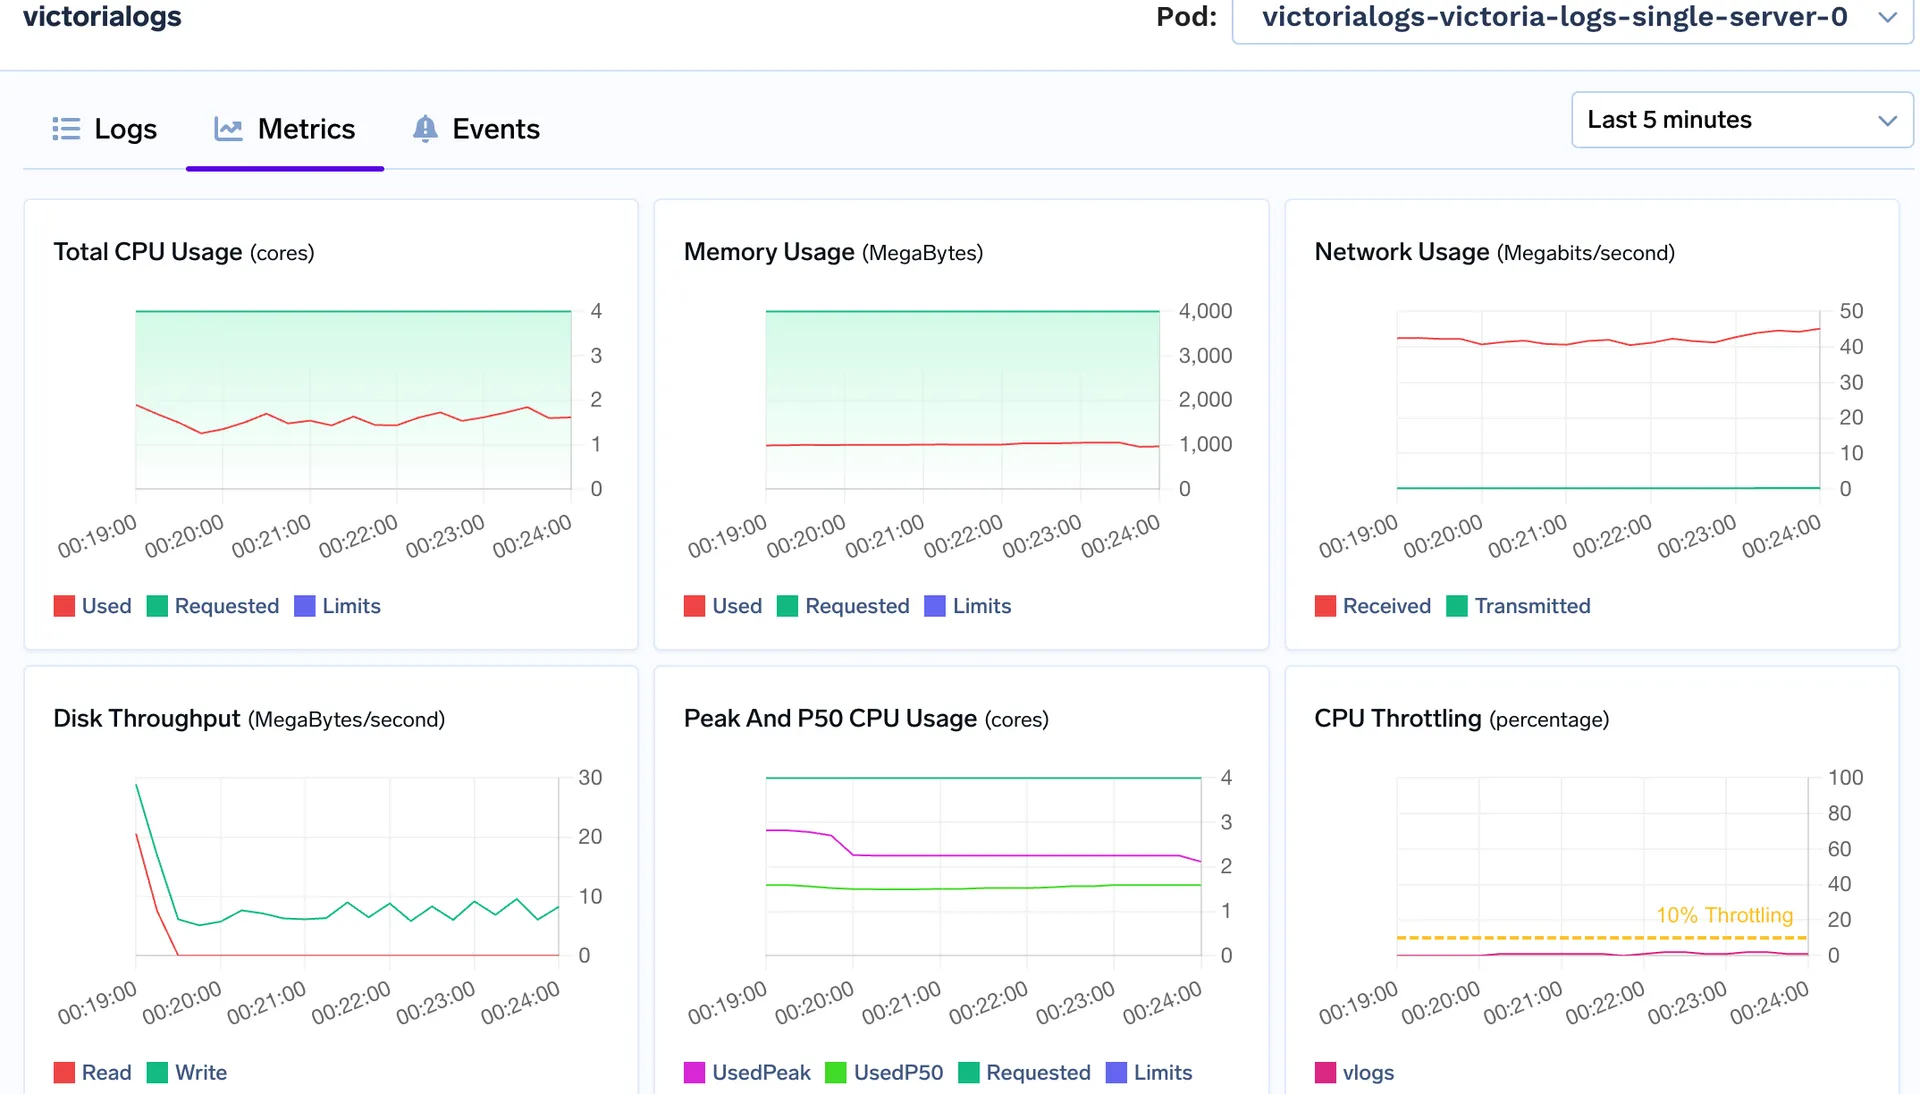
Victoria Logs:
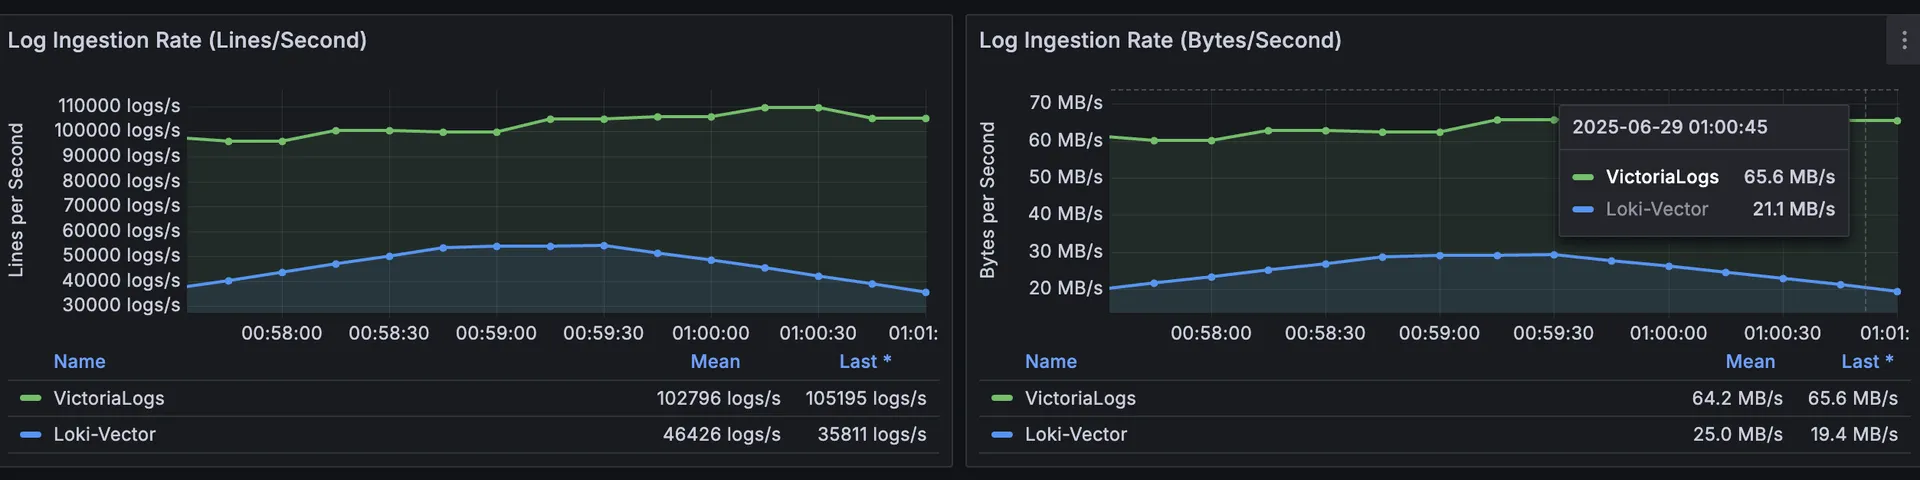
👉 Wichtiger Imbiss: VictoriaLogs geliefert 3× höhere Aufnahmegeschwindigkeit beim Konsum 72% weniger CPU und 87% weniger Speicher im Vergleich zu Loki.
VictoriaLogs bleibt auch bei Ingestion-Bursts bequem unter seinen Grenzwerten von 4 vCPU/ 8 GiB
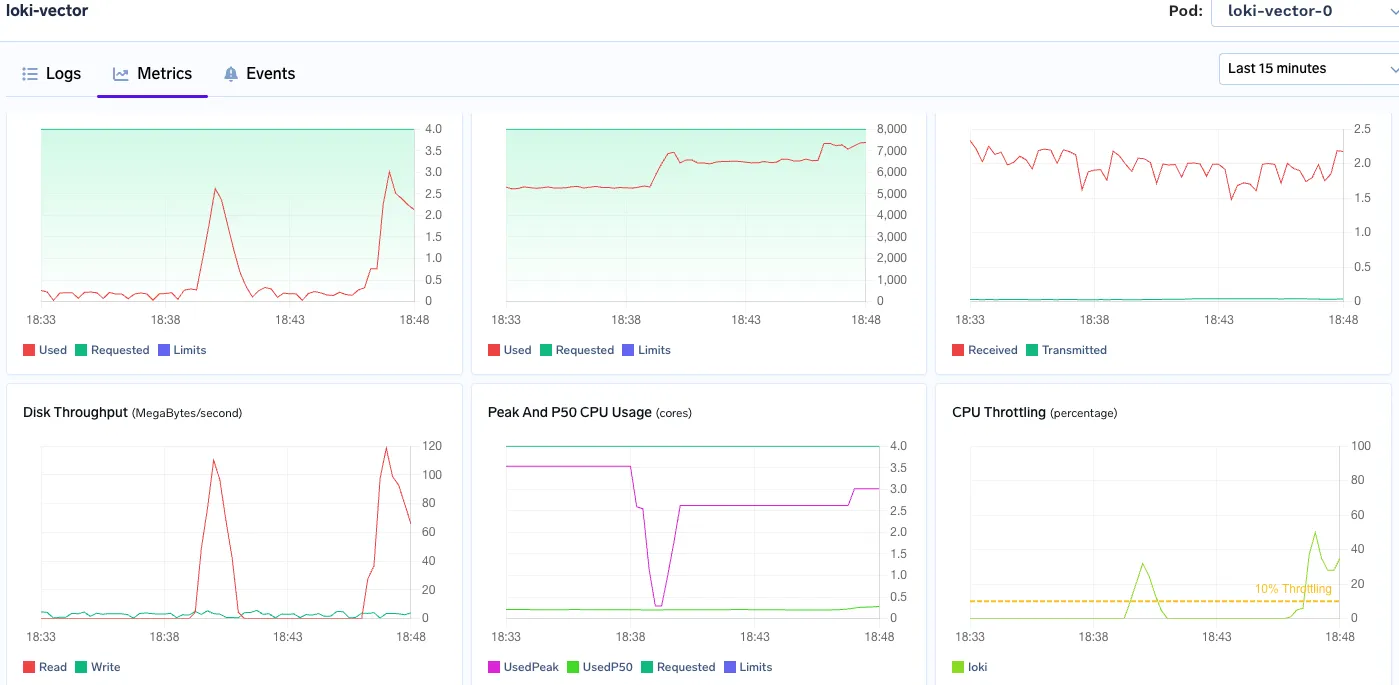
Verwendeter Speicher: durchgehend mit 6-7 GB RAM
CPU-Spitze: 3 vCPU
Victoria Logs
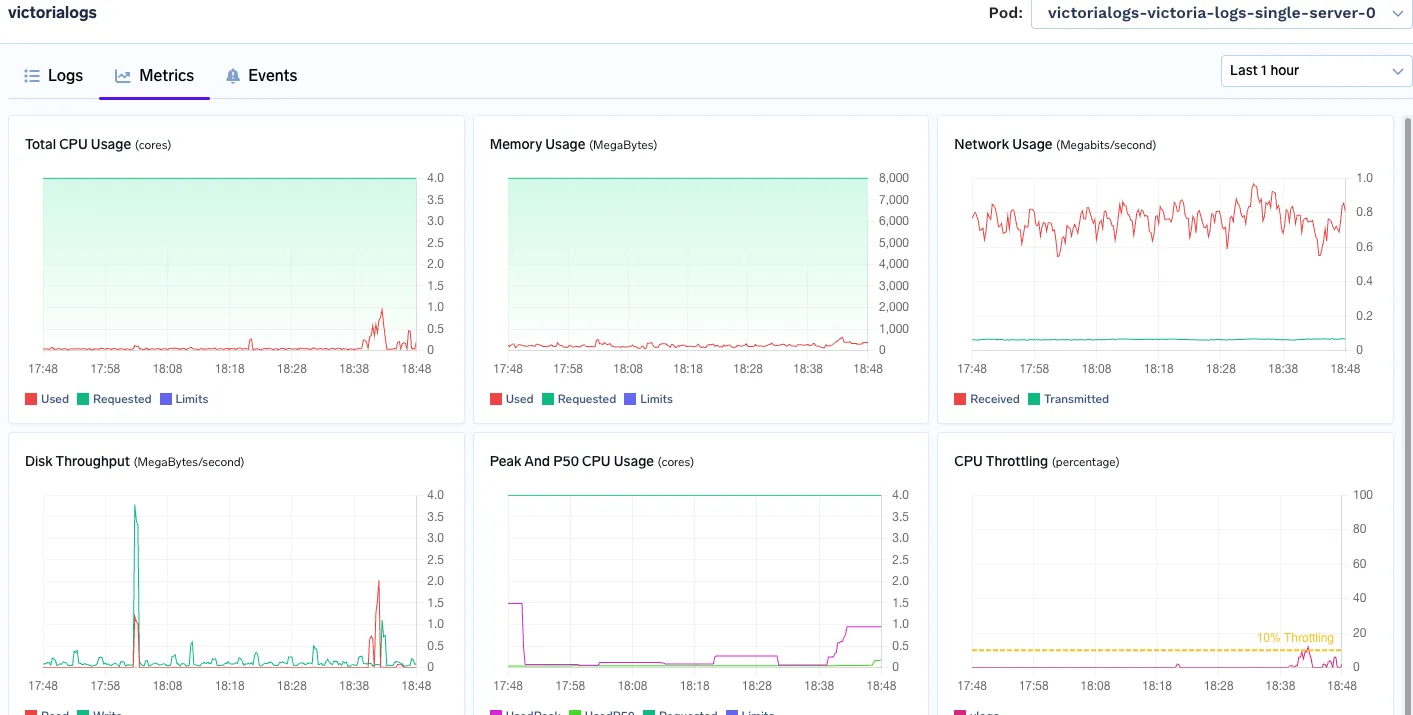
Verwendeter Speicher: 800 MB — 900 MB
CPU-Spitzenauslastung: 1,1 vCPU
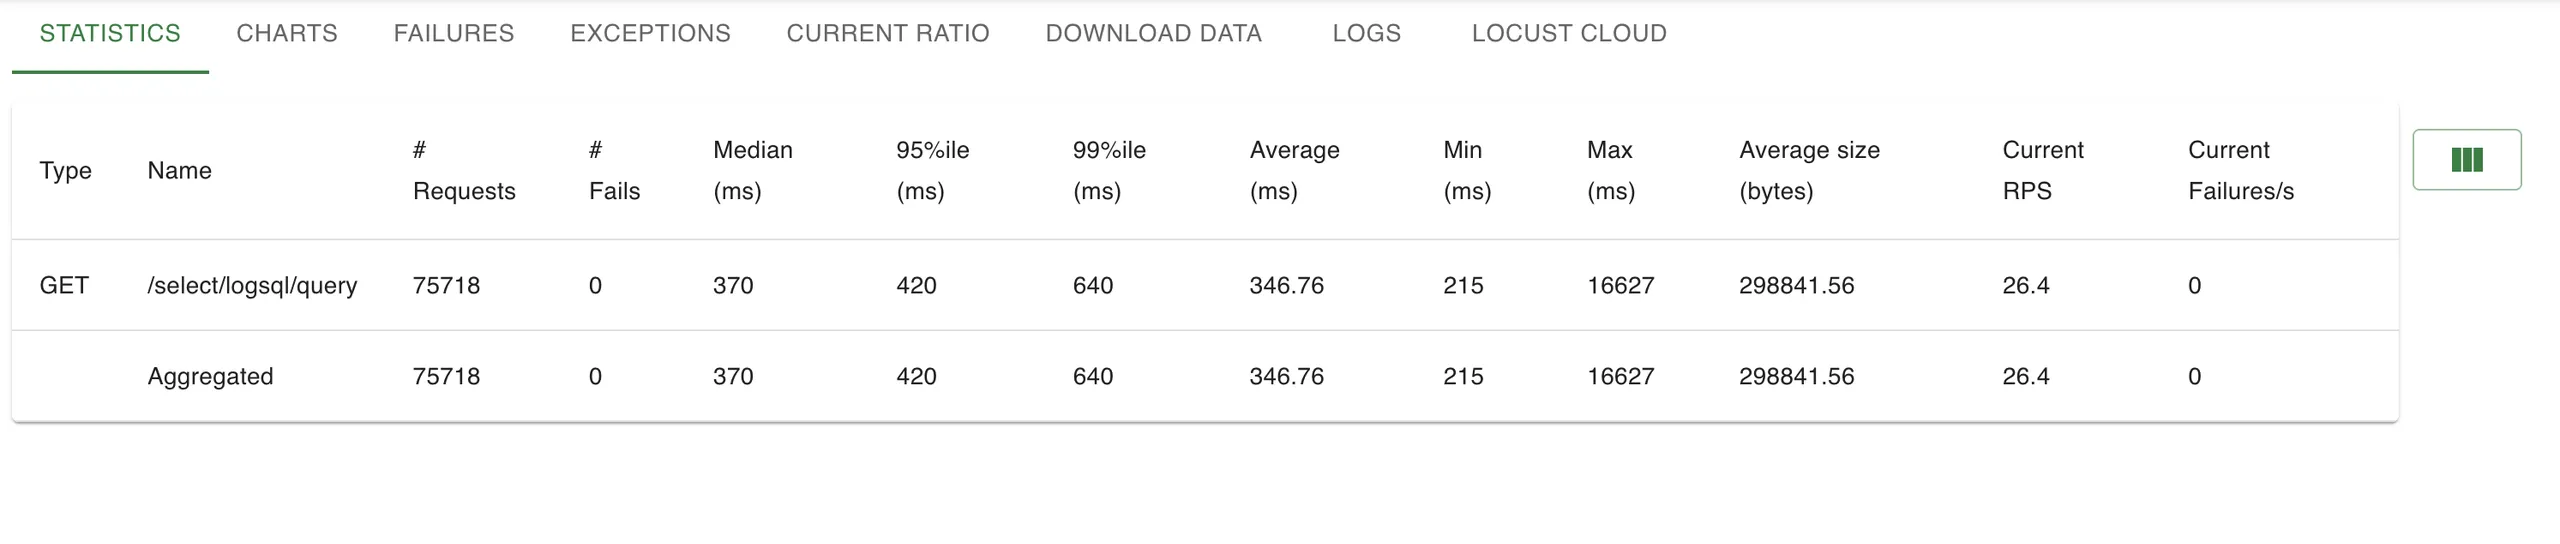
Die Abfragen waren ähnlich, mit Random Limits und Random Time-Range, um Cache-Bursts zu gewährleisten.
Victoria Logs
Loki
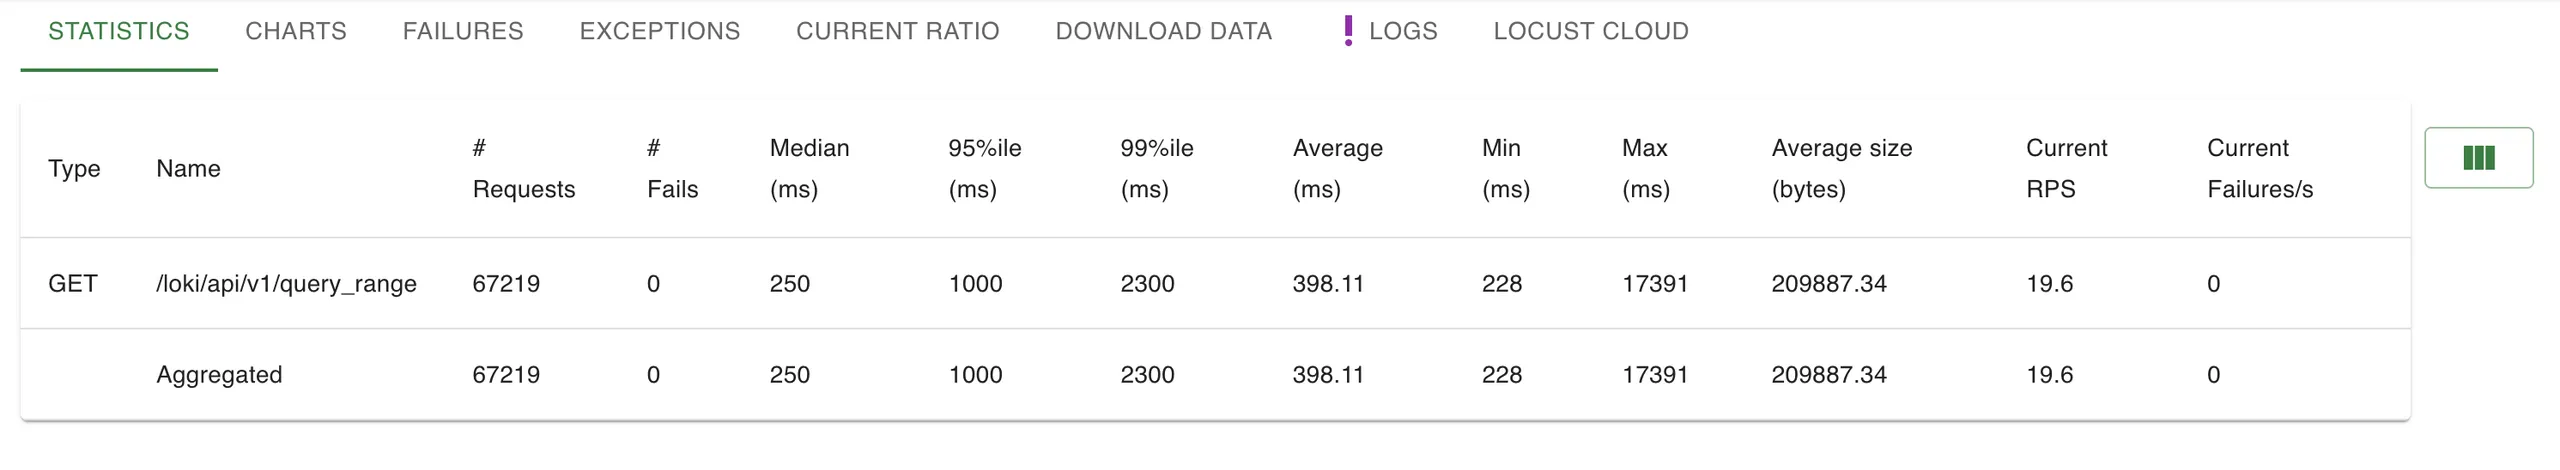
📌 Trotz Handhabung 36% höherer RPS, VictoriaLogs wies einen niedrigeren p 95% und niedrigere Latenzen auf — ein Beweis dafür, dass sein Indexierungsmodell dem Druck standhält 3,6x schneller Bis zu 99% Datei
Dieser Test bestärkte unsere Entscheidung: VictoriaLogs ist nicht nur theoretisch schneller — es skaliert auch besser, wenn Stress bei produktionsähnlichen Workloads anfällt.
Fazit: Für einen protokollintensiven, suchzentrierten Anwendungsfall können wir mit VictoriaLogs Fragen in Sekunden statt in Minuten beantworten und gleichzeitig die Infrastrukturkosten senken.
Für Workload-Profile, die viel Ad-hoc-Textsuche benötigen, stellte VictoriaLogs zur Verfügung Größenordnung schnellere Abfragen und Materialkosteneinsparungen. Loki ist nach wie vor eine hervorragende Wahl, wenn eine enge Grafana-Integration und Label-First-Abfragen dominieren, aber VictoriaLogs ist jetzt unser Standard für entwicklerorientierte Cluster mit hoher Datenaufnahme.
Der Hauptunterschied zwischen Victorialogs und Loki besteht in der fortschrittlichen Indizierung pro Token und der spaltenweisen Speicherung von VictoriaLogs. Dies ermöglicht eine viel schnellere Abfrageleistung und einen deutlich geringeren Ressourcenverbrauch im Vergleich zur reinen Label-Indizierung von Loki, was häufig zu langsameren Vollscan-Suchen und einem höheren Betriebsaufwand für die Protokollverwaltung führt.
Ja, in unserem strengen Benchmarking zeigte VictoriaLogs im Vergleich zu Loki eine überlegene Geschwindigkeit. Bei Vergleichen zwischen Victorialogs und Loki reduzierte VictoriaLogs die Abfragelatenzen um 94% und erzielte bei komplexen Abfragen 12-mal schnellere Suchzeiten. Es bot auch eine dreimal höhere Erfassungsleistung und war damit deutlich effizienter.
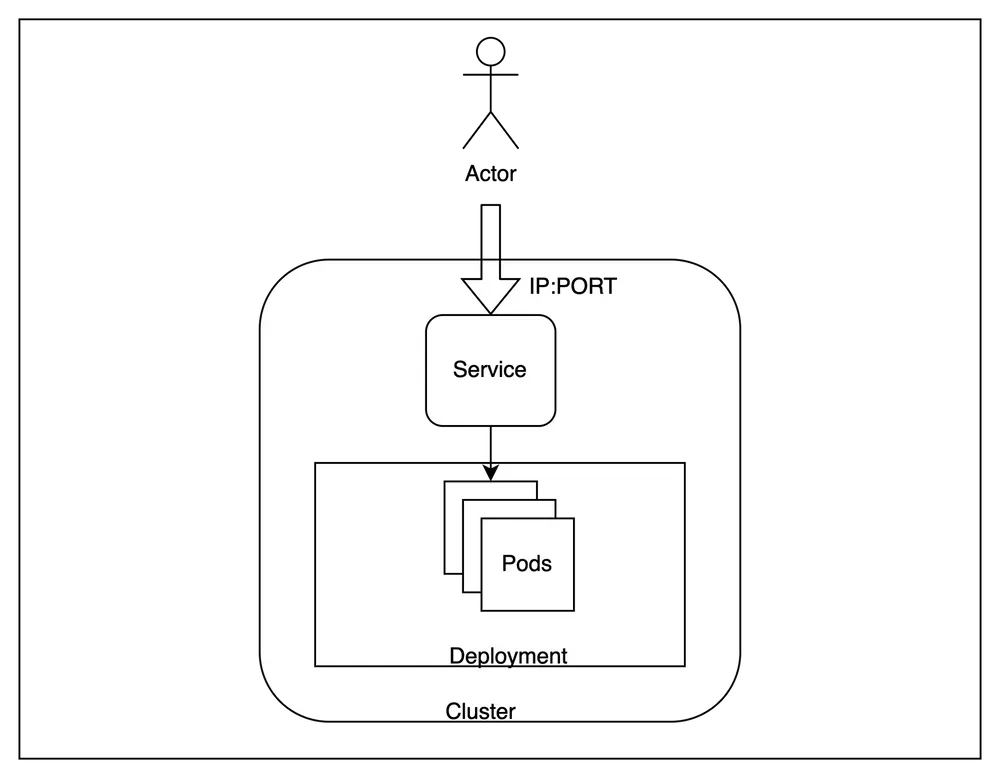
Bei der Bewertung von Victorialogs im Vergleich zu Loki ist es hilfreich, die Einrichtungsdetails zu kennen. VictoriaLogs verwendet normalerweise Port 8428 für seine Standard-HTTP-API und Scraping-Endpunkte. Dieser Port ermöglicht den Zugriff und die Interaktion mit der Protokolldatenbank. Unser Blog konzentriert sich zwar auf die Leistung, aber das Verständnis der Grundlagen der Bereitstellung, wie z. B. des Standardanschlusses, ist für die Systemkonfiguration von entscheidender Bedeutung.
In Benchmarks, in denen Victorialogs mit Loki verglichen wurde, lieferte VictoriaLogs eine überragende Leistung. Es erzielte eine Reduzierung der Abfragelatenzen um 94%, verringerte die Speichernutzung um etwa 40% und verbrauchte weniger als 50% der zugewiesenen CPU und des Arbeitsspeichers. VictoriaLogs wies außerdem einen dreimal höheren Datendurchsatz auf und war damit äußerst effizient.
In unserem Benchmark Victorialogs gegen Loki erwies sich VictoriaLogs als überlegen. Es senkte die Abfragelatenzen um 94%, reduzierte den Speicherplatz um 40% und verbrauchte über 50% weniger CPU/RAM. TrueFoundry in den USA entschied sich aufgrund der verbesserten Leistung und Effizienz bei der Verwaltung von ML-Workloads für VictoriaLogs.
TrueFoundry AI Gateway bietet eine Latenz von ~3—4 ms, verarbeitet mehr als 350 RPS auf einer vCPU, skaliert problemlos horizontal und ist produktionsbereit, während LiteLM unter einer hohen Latenz leidet, mit moderaten RPS zu kämpfen hat, keine integrierte Skalierung hat und sich am besten für leichte Workloads oder Prototyp-Workloads eignet.


Die neuesten Nachrichten, Artikel und Ressourcen werden in Ihren Posteingang gesendet
© 2026 Alle Rechte vorbehalten.


.png)
.webp)
.webp)

.webp)
.webp)
.webp)
.png)