October 19, 2026
|
Lesedauer: 5 Minuten


Erhalten Sie sofortigen Zugriff auf eine TrueFoundry-Live-Umgebung. Stellen Sie Modelle bereit, leiten Sie den LLM-Verkehr weiter und erkunden Sie die gesamte Plattform — Ihre Sandbox ist in Sekundenschnelle einsatzbereit, ohne dass eine Kreditkarte erforderlich ist.



Published: October 19, 2026

Unglaublich schnelle Methode zum Erstellen, Verfolgen und Bereitstellen Ihrer Modelle!
Claude in production fails quietly in two ways: the bill drifts up for reasons no dashboard explains, and a bad response is impossible to reconstruct after the fact. Both are observability gaps, and both have a Claude-specific wrinkle. The cost gap is specific because Claude’s token usage is not a single figure — it splits into normal input, cache writes, and cache reads, each priced differently — so naive token counting produces a number that does not match the invoice. The debugging gap is specific because the interesting failures (a refusal, a tool error, a cache that silently stopped hitting) often leave nothing in application logs.
This post is about closing both gaps: what to account for in Claude’s token usage, what to trace, and how to get complete coverage at the gateway instead of instrumenting every service by hand. The usage-field details are from Anthropic’s documentation, as of October 2026.
The first thing to get right is that “input tokens” on Claude is three numbers that each cost something different.
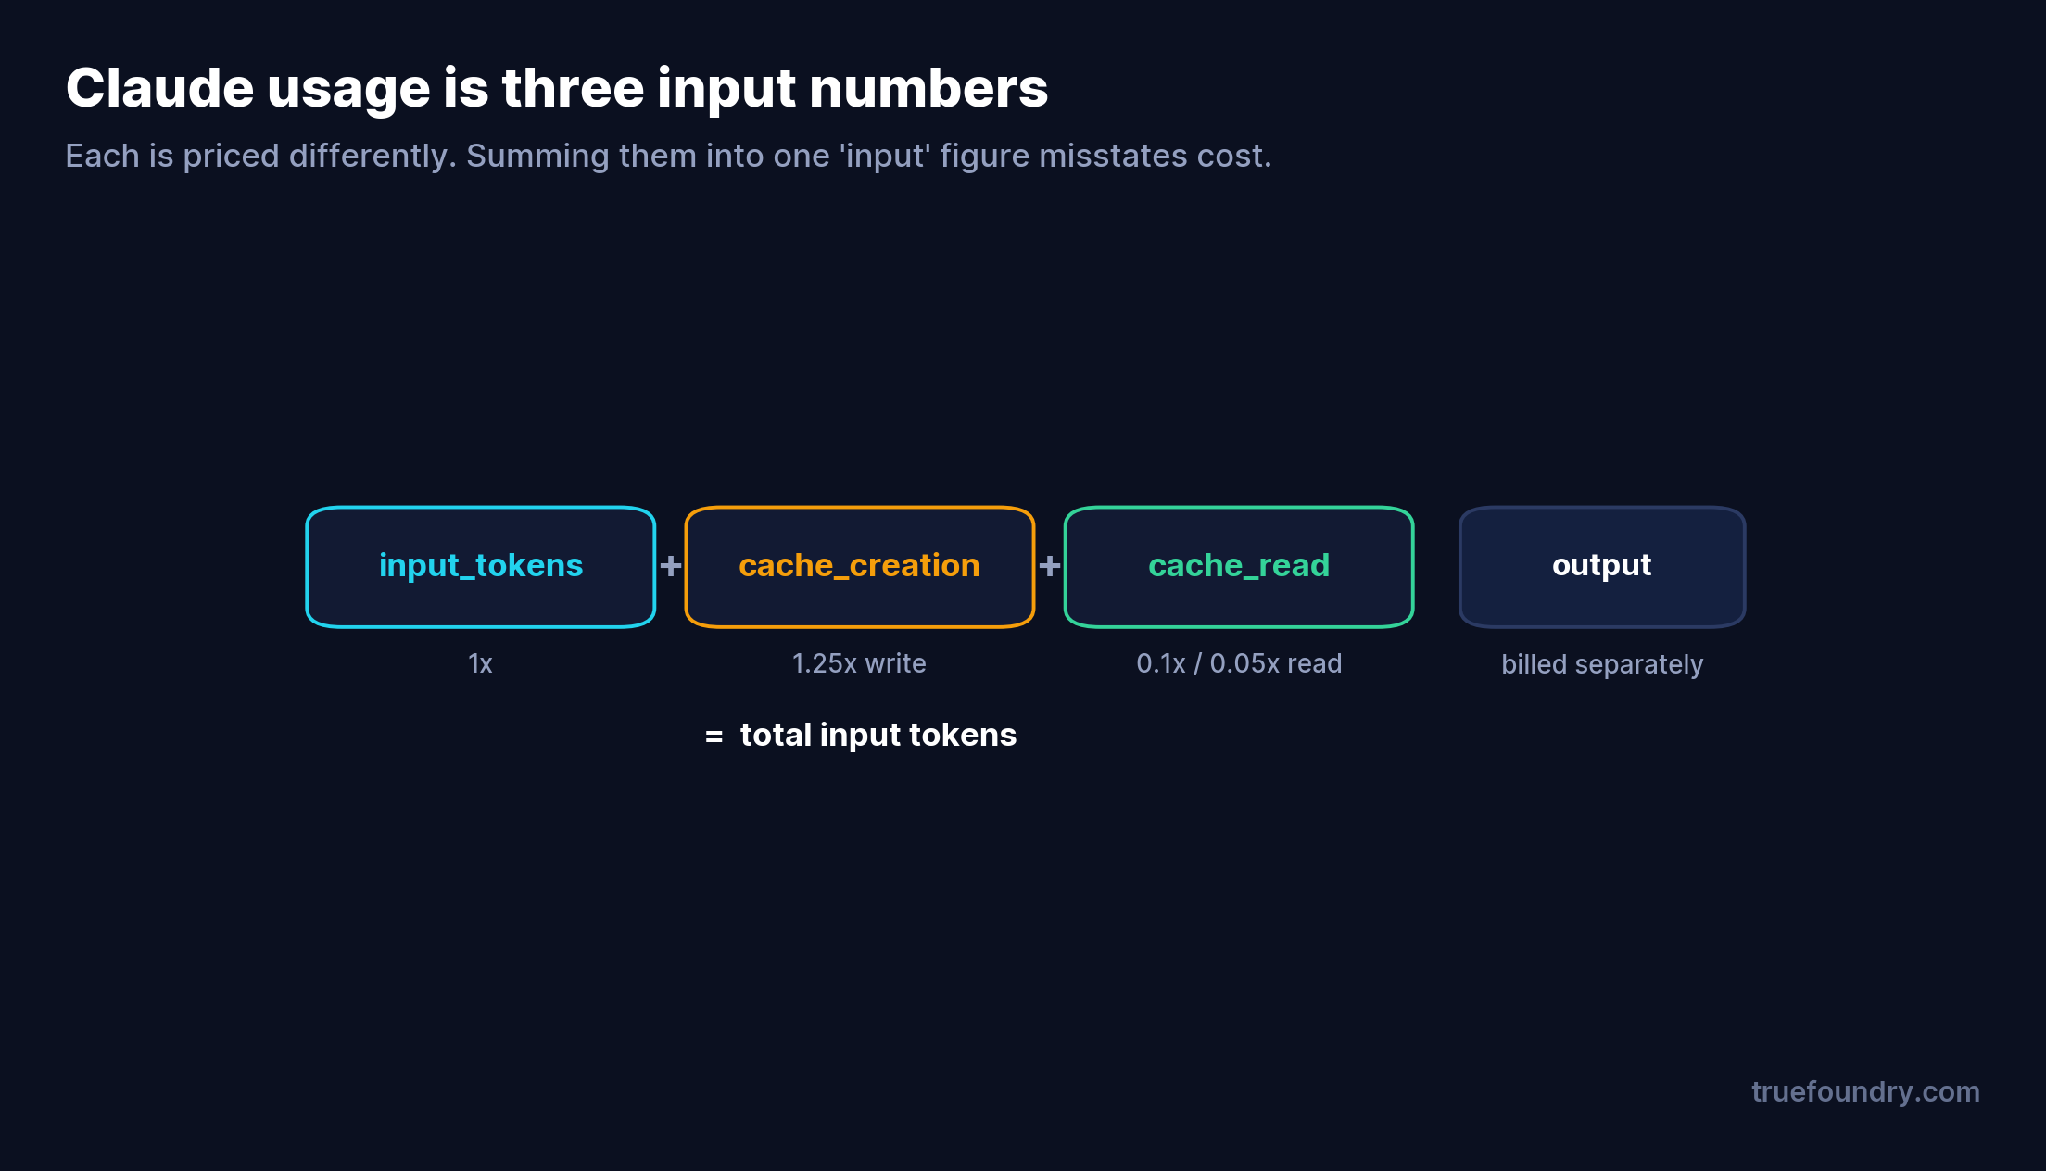
Every Claude response reports input_tokens, cache_creation_input_tokens, and cache_read_input_tokens, and the true total input is the sum of all three. They are not interchangeable for cost: a normal input token is 1x, a cache write is 1.25x (2x for the 1-hour TTL), and a cache read is 0.1x — or 0.05x on Opus 5.5 and Sonnet 5.5. So two requests with identical total token counts can cost very differently depending on how those tokens split. An accounting system that only sums “input tokens” will both misreport spend and hide the single most useful signal: whether your cache is being read or just written.
That signal is cache hit rate, and it is the number that tells you prompt caching is actually paying off. If cache_creation is high and cache_read stays near zero, you are paying the write premium and collecting no discount — a problem invisible to anything that does not break input tokens into its parts.
TrueFoundry AI Gateway bietet eine Latenz von ~3—4 ms, verarbeitet mehr als 350 RPS auf einer vCPU, skaliert problemlos horizontal und ist produktionsbereit, während LiteLM unter einer hohen Latenz leidet, mit moderaten RPS zu kämpfen hat, keine integrierte Skalierung hat und sich am besten für leichte Workloads oder Prototyp-Workloads eignet.



Sum the three input buckets separately: input_tokens (1x), cache_creation_input_tokens (1.25x, or 2x for the 1-hour TTL), and cache_read_input_tokens (0.1x, or 0.05x on Opus 5.5 and Sonnet 5.5), plus output tokens. Collapsing them into one “input” figure misstates cost.
Cache hit rate, alongside cost and error rate. It’s the only signal that distinguishes a cache that’s actually being read from one that only pays the write premium.
Metrics tell you a number moved; a trace reconstructs a single request — including refusals, tool errors, guardrail blocks, and fallbacks that app-side logs usually miss.
Not if Claude goes through a gateway. Every call is recorded there as a side effect, so coverage is complete — including refused requests — without per-service instrumentation.
Yes. Export Claude traces and metrics over OpenTelemetry into Datadog, Grafana, or your current stack rather than running a separate one.



Die neuesten Nachrichten, Artikel und Ressourcen werden in Ihren Posteingang gesendet