


.png)
October 9, 2026
|
5 min read


Published: October 9, 2026
.png)
Blazingly fast way to build, track and deploy your models!
When an LLM call is slow, expensive, or wrong, you need to see what actually happened. Did a guardrail redact the prompt? How long did the model take versus the network? What did the gateway send to the provider? Request logging and tracing on the AI Gateway answer these questions for every call.
Because every request already flows through the gateway, you get this visibility without instrumenting each application by hand.
The request logging docs let you control which requests are logged. The simplest control is per request, using the X-TFY-LOGGING-CONFIG header with a stringified JSON value. Set enabled to true to log the request or false to skip it.
One gotcha worth noting: the value of that header is stringified JSON, not a raw JSON object, because most SDKs serialize headers as strings. The older global logging modes are being replaced by rule based logging configuration, which lets you control logging per subject, model, or metadata and redact sensitive values.
To see logged requests in the UI, go to AI Gateway, then Monitor, then Requests. This gives you the list of all logged calls, which you can open to inspect a single request in detail.
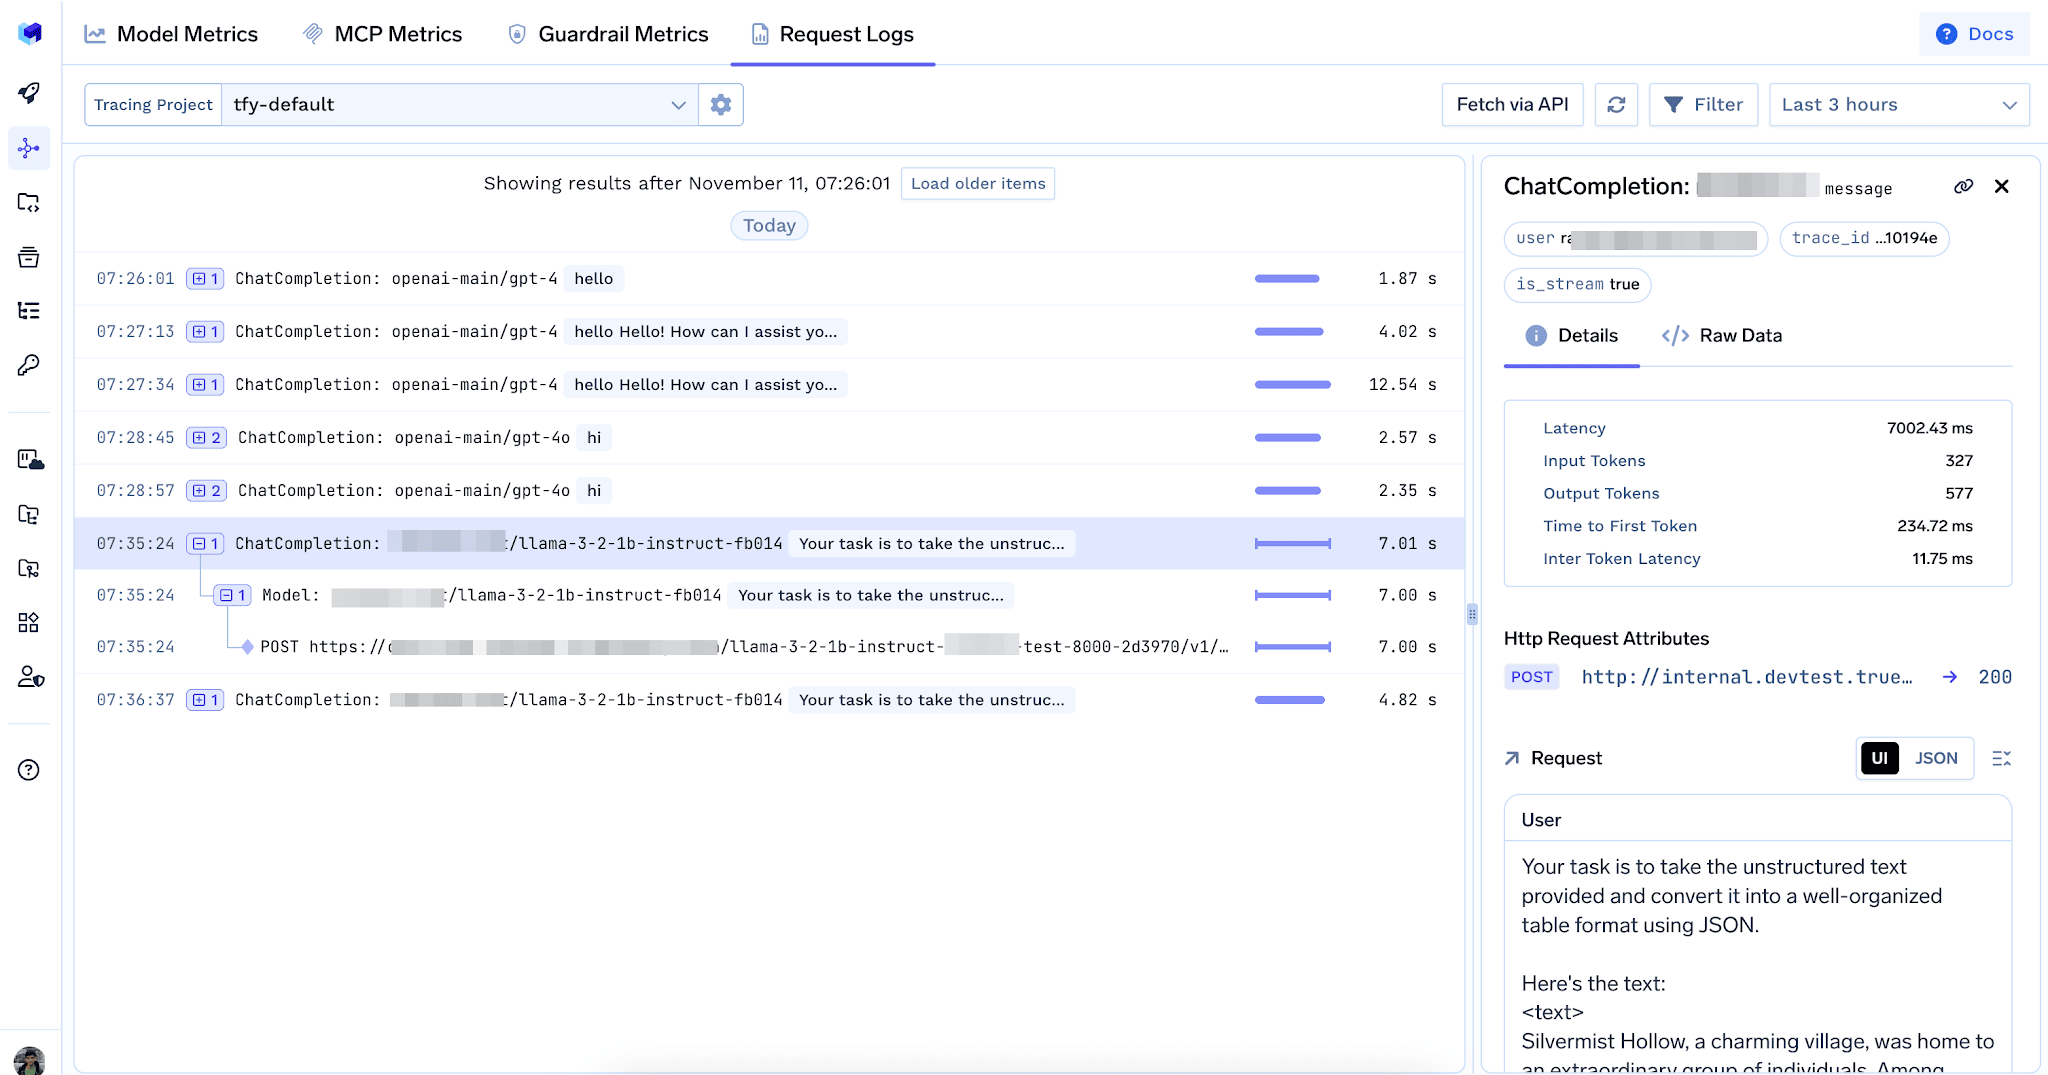
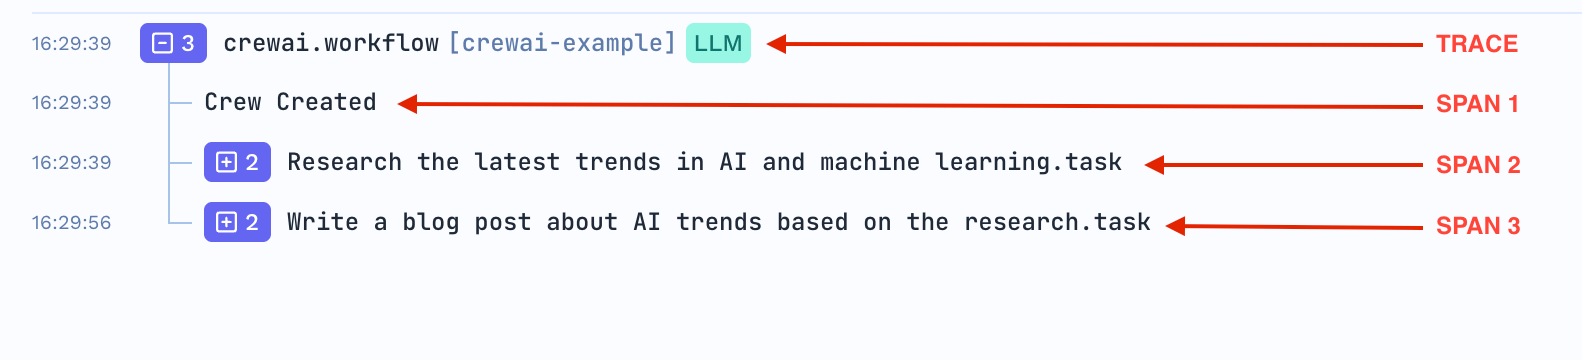
The tracing docs describe a trace as the complete lifecycle of a request as it flows through the services that interact with the LLM. Usually a trace corresponds to a single API call of an application.
A span is an individual unit of work within that trace, such as a function call, an HTTP request, or a model inference. A trace is a tree of spans with parent and child relationships, where a child span is usually caused by its parent. TrueFoundry provides an OpenTelemetry collector backend that stores these traces and a UI to query and analyze them, and it can receive traces from any OpenTelemetry compatible SDK.
The trace inspection docs walk through a real example: a chat completion with a PII redaction guardrail, captured as five spans that form a hierarchy.
In that same example the input is visibly redacted from a name to a placeholder, which shows the PII guardrail working end to end inside the trace.

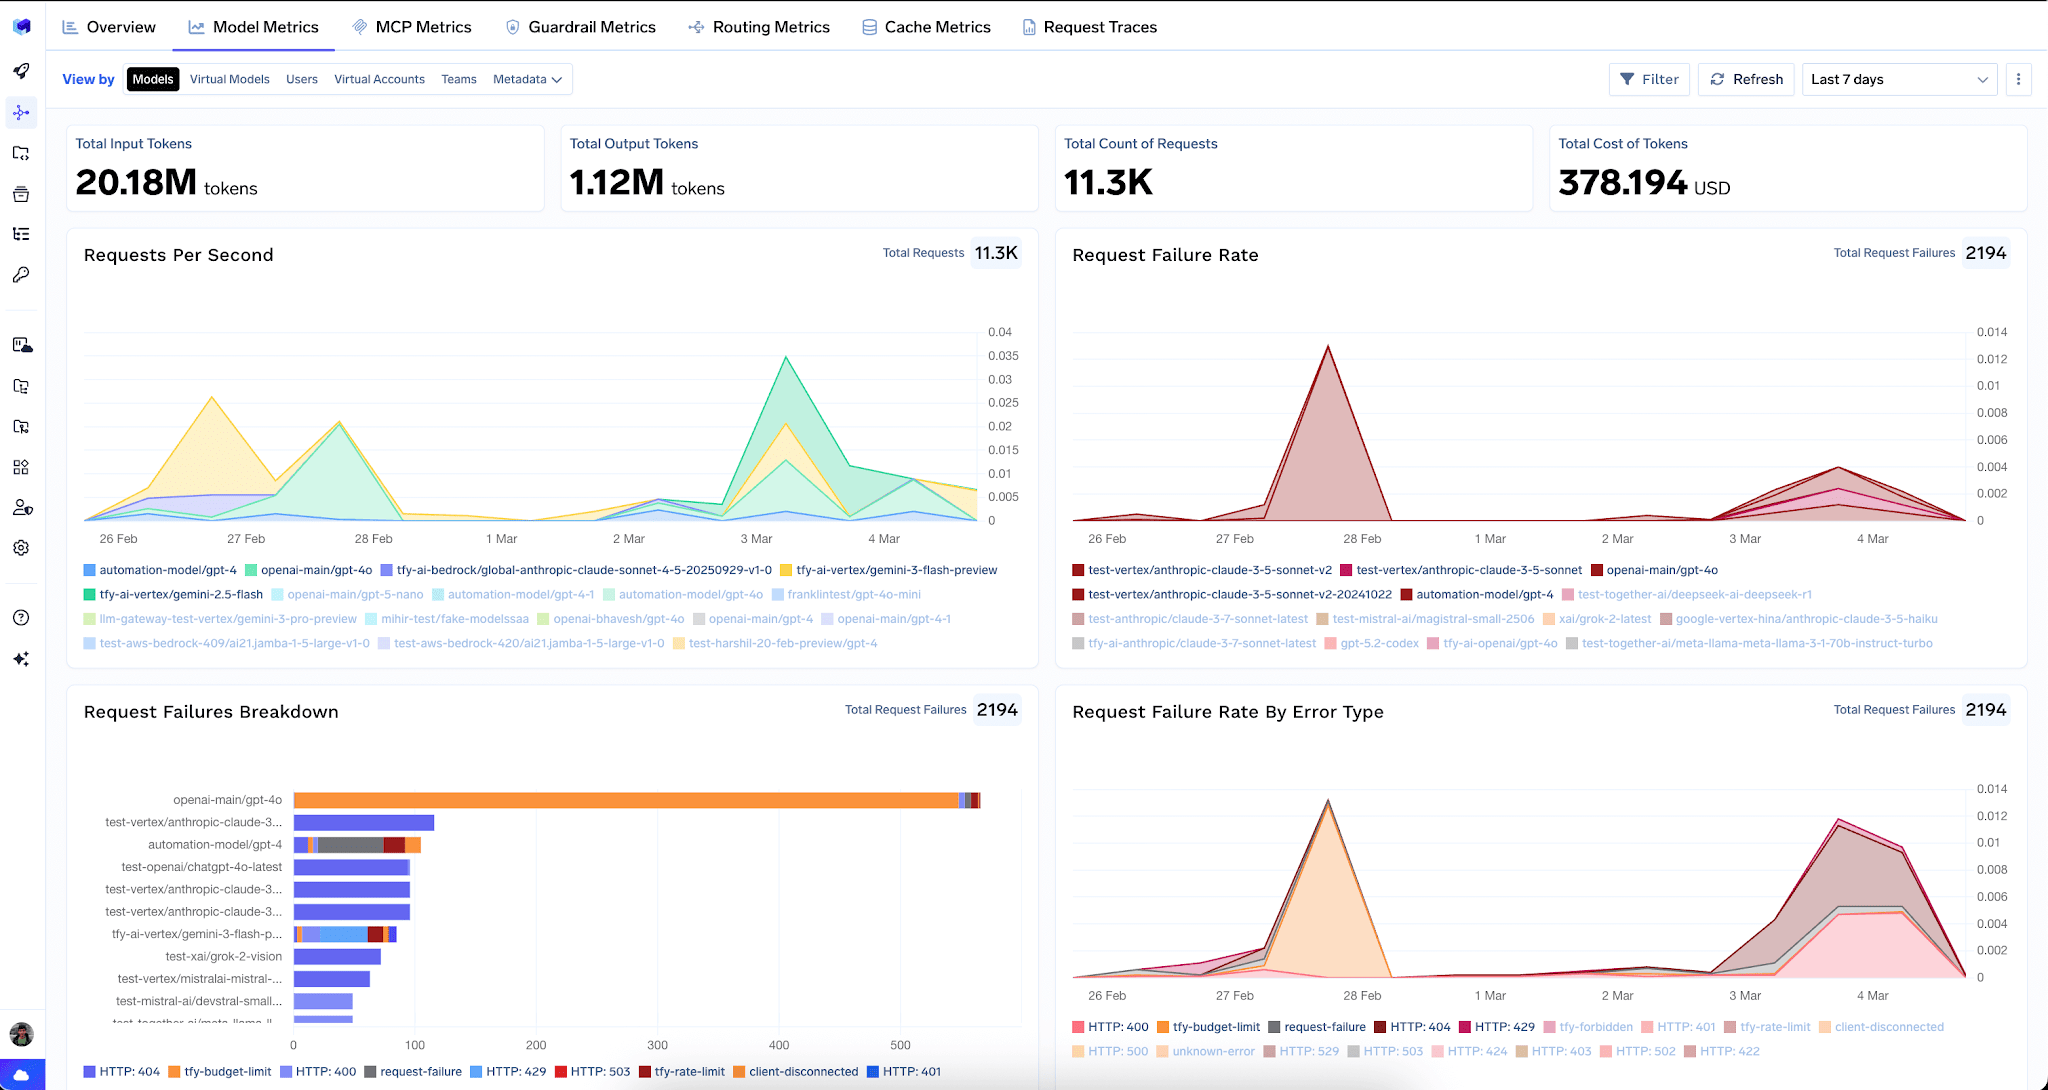
Individual traces are for debugging. For trends, the analytics dashboard aggregates the same data. Tabs cover Overview, Model Metrics, MCP Metrics, Guardrail Metrics, Routing Metrics, and Cache Metrics.
Model metrics can be grouped by models, virtual models, users, virtual accounts, teams, or metadata, and the latency views break down request latency, time to first token, inter token latency, and time per output token. Together with per request traces, this gives you both the microscope and the dashboard.
TrueFoundry AI Gateway delivers ~3–4 ms latency, handles 350+ RPS on 1 vCPU, scales horizontally with ease, and is production-ready, while LiteLLM suffers from high latency, struggles beyond moderate RPS, lacks built-in scaling, and is best for light or prototype workloads.

Send the X-TFY-LOGGING-CONFIG header with a stringified JSON value and set enabled to true or false. Remember that the value is stringified JSON, not a raw object, because most SDKs serialize headers as strings.
Logged requests appear under AI Gateway, then Monitor, then Requests. Opening a request shows its trace, which is the tree of spans covering guardrails, the model, and the outbound provider calls.
A trace is the full lifecycle of a single request. A span is one unit of work inside that trace, such as a guardrail check or a model inference. Spans form a parent and child tree within the trace
Yes. TrueFoundry runs an OpenTelemetry collector backend and can receive traces from any OpenTelemetry compatible SDK. For LLM use cases the docs recommend an LLM focused SDK that captures model specific traces and metrics.



The latest news, articles, and resources sent to your inbox
.png)
.png)
.png)
.png)
.png)


