October 19, 2026
|
5 min de lecture


Accédez instantanément à un environnement TrueFoundry en direct. Déployez des modèles, acheminez le trafic LLM et explorez la plateforme complète : votre sandbox est prête en quelques secondes, aucune carte de crédit n'est requise.



Published: October 19, 2026

Une méthode incroyablement rapide pour créer, suivre et déployer vos modèles !
Claude in production fails quietly in two ways: the bill drifts up for reasons no dashboard explains, and a bad response is impossible to reconstruct after the fact. Both are observability gaps, and both have a Claude-specific wrinkle. The cost gap is specific because Claude’s token usage is not a single figure — it splits into normal input, cache writes, and cache reads, each priced differently — so naive token counting produces a number that does not match the invoice. The debugging gap is specific because the interesting failures (a refusal, a tool error, a cache that silently stopped hitting) often leave nothing in application logs.
This post is about closing both gaps: what to account for in Claude’s token usage, what to trace, and how to get complete coverage at the gateway instead of instrumenting every service by hand. The usage-field details are from Anthropic’s documentation, as of October 2026.
The first thing to get right is that “input tokens” on Claude is three numbers that each cost something different.
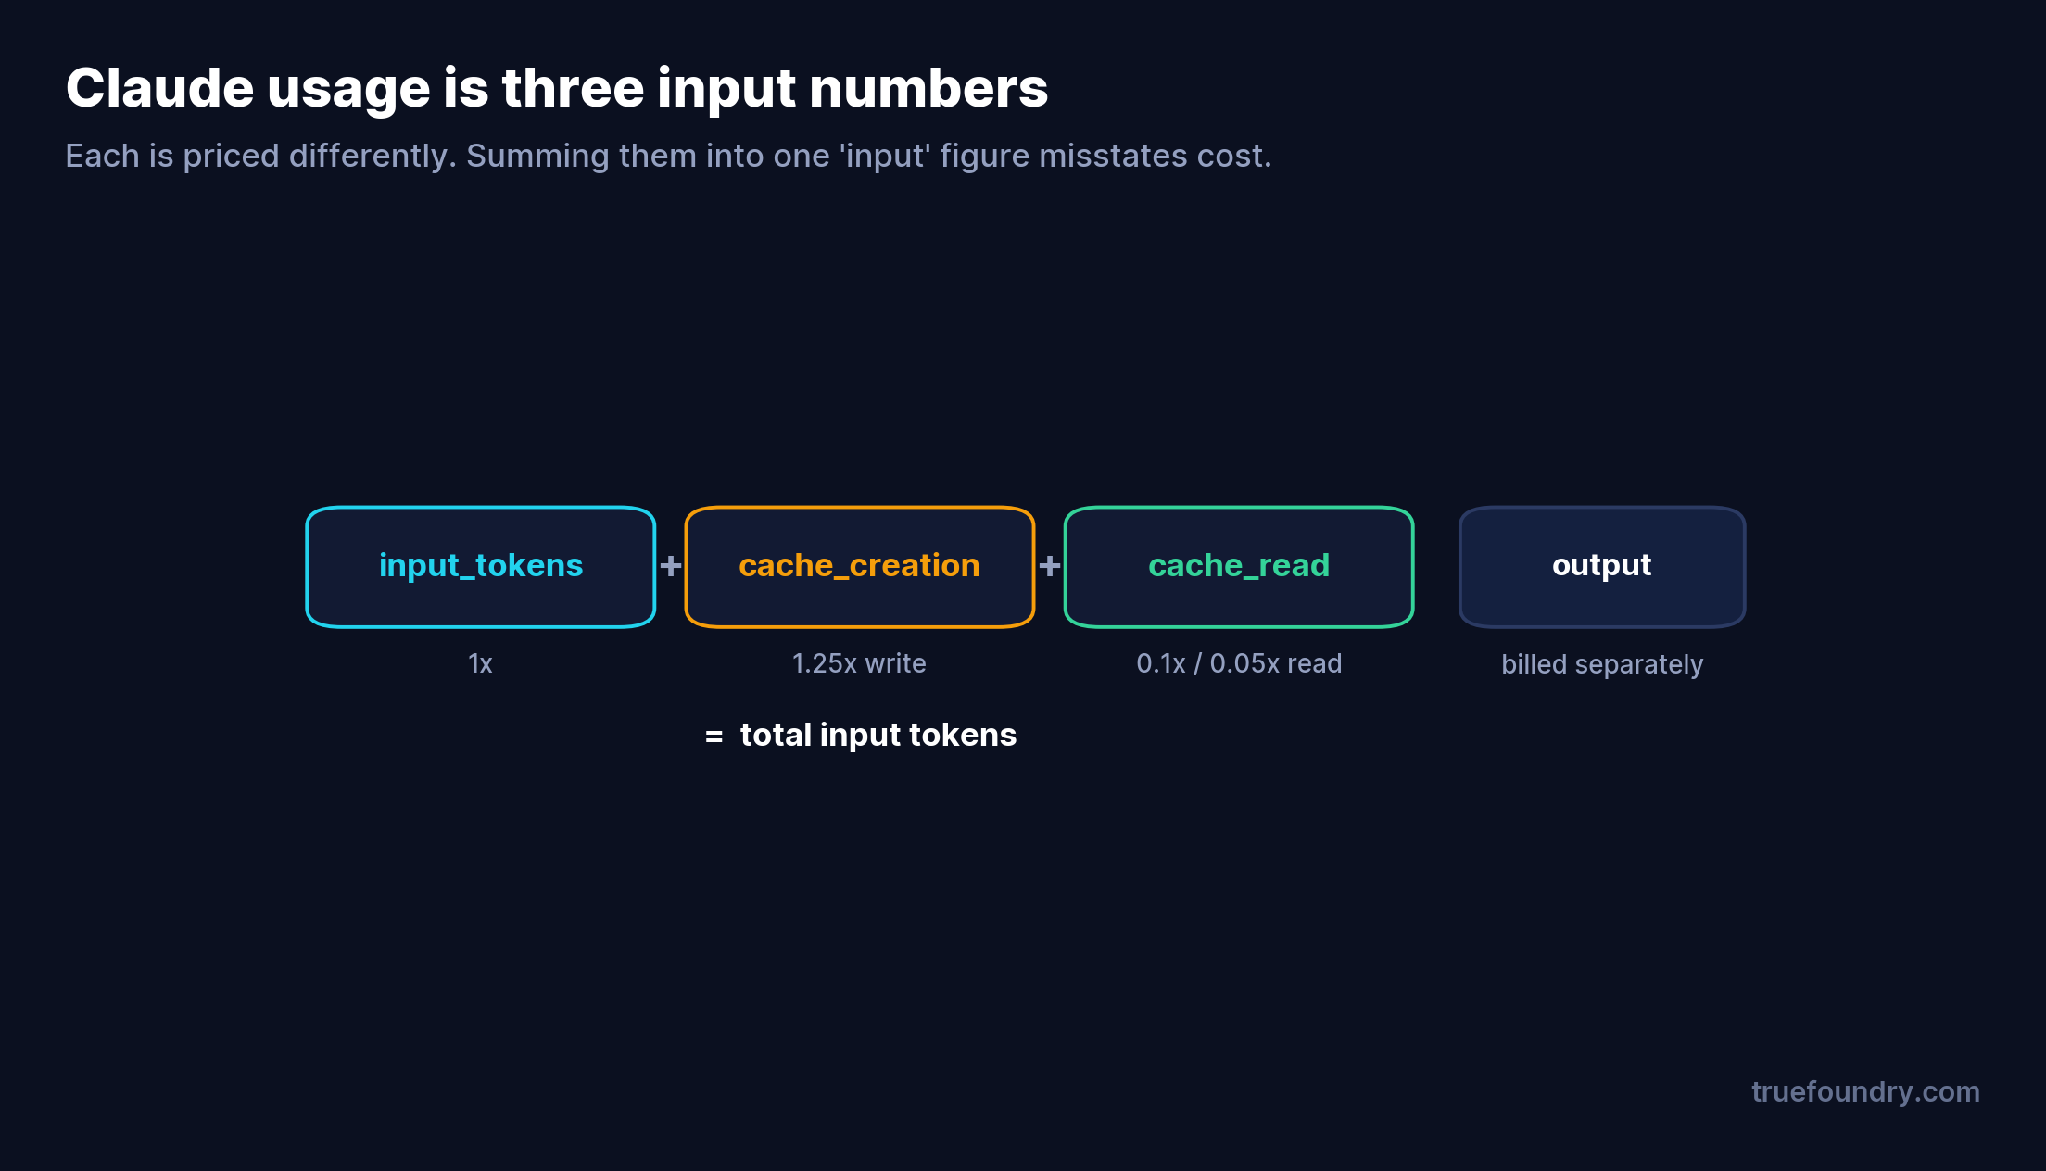
Every Claude response reports input_tokens, cache_creation_input_tokens, and cache_read_input_tokens, and the true total input is the sum of all three. They are not interchangeable for cost: a normal input token is 1x, a cache write is 1.25x (2x for the 1-hour TTL), and a cache read is 0.1x — or 0.05x on Opus 5.5 and Sonnet 5.5. So two requests with identical total token counts can cost very differently depending on how those tokens split. An accounting system that only sums “input tokens” will both misreport spend and hide the single most useful signal: whether your cache is being read or just written.
That signal is cache hit rate, and it is the number that tells you prompt caching is actually paying off. If cache_creation is high and cache_read stays near zero, you are paying the write premium and collecting no discount — a problem invisible to anything that does not break input tokens into its parts.
Beyond the token split, a small, fixed set of signals covers the Claude failure modes that matter.
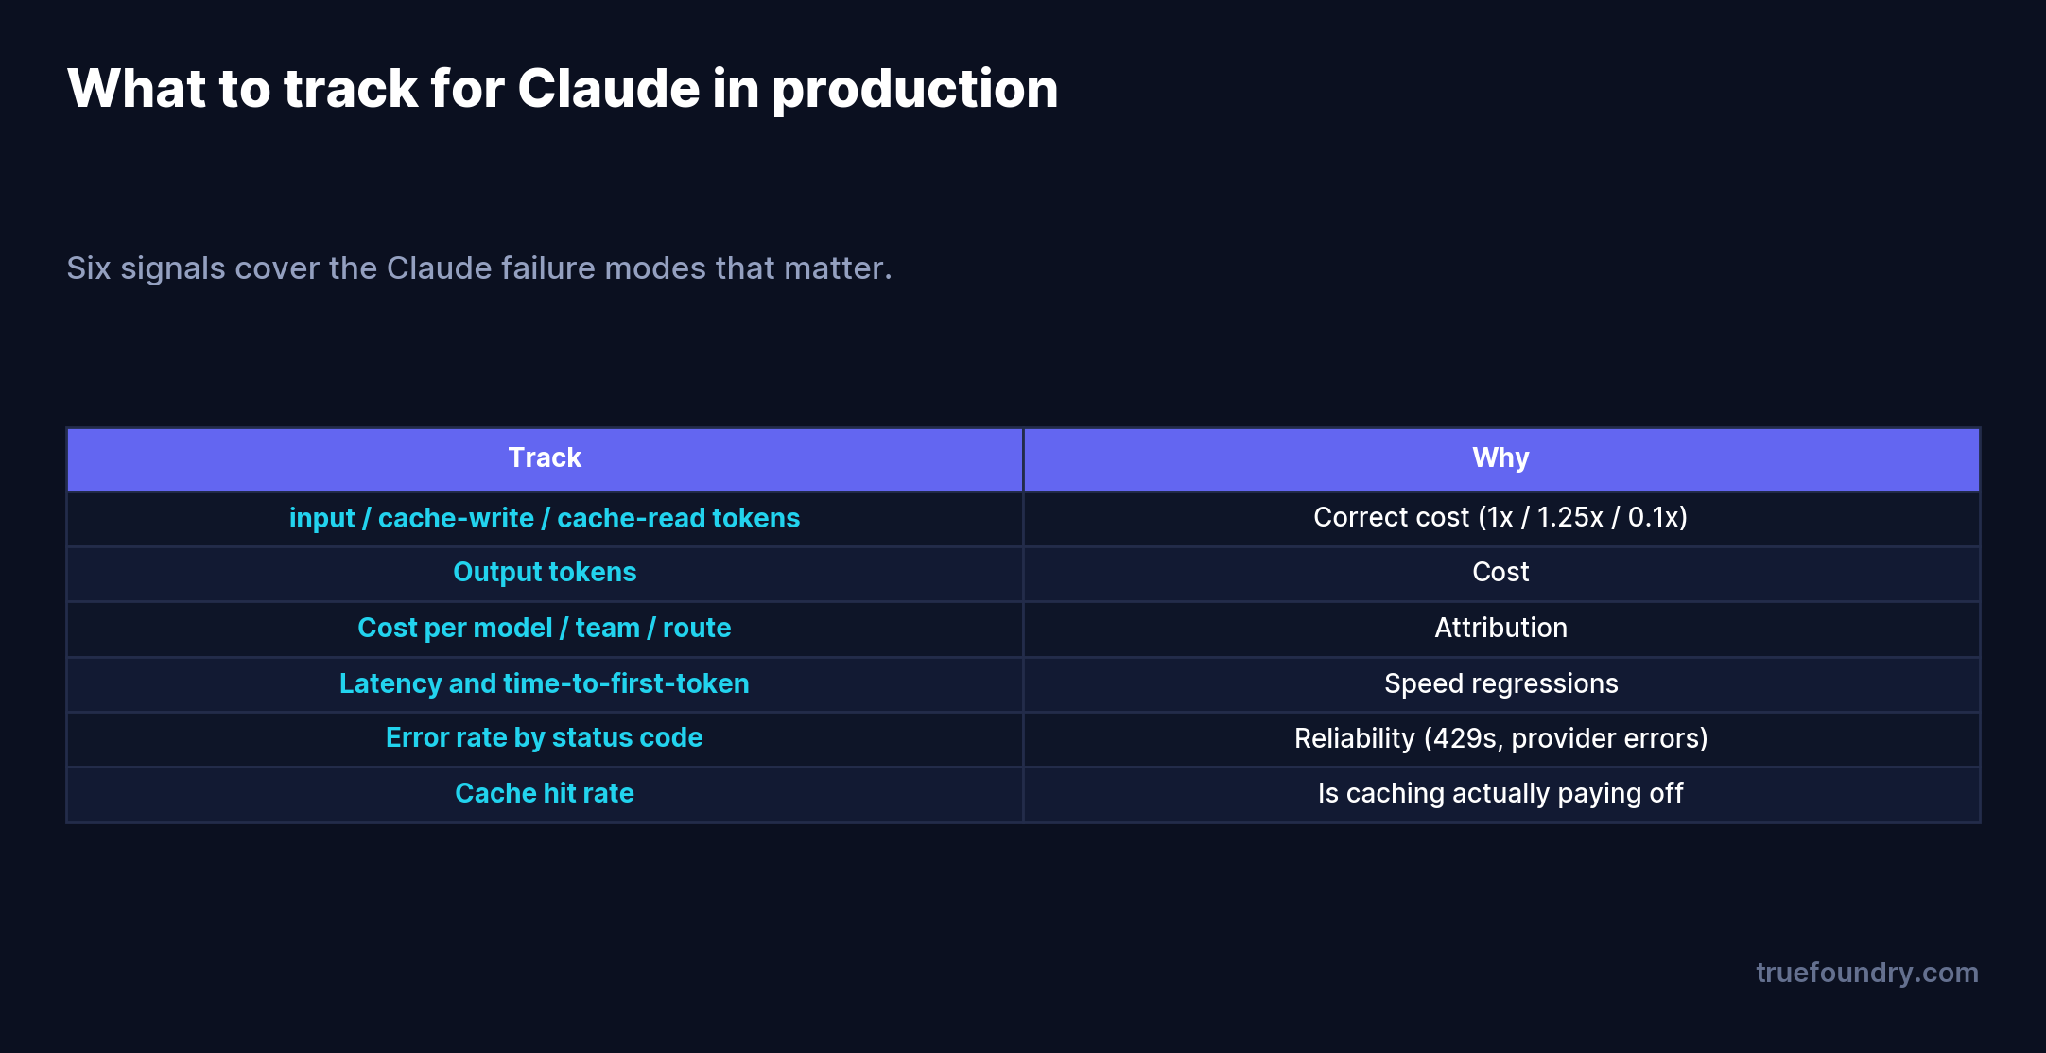
Track, per request and aggregated by model, team, and route: the three input token buckets plus output tokens (for correct cost), cost itself, latency (and time-to-first-token for streaming), error rate by status code (429s and provider errors are your reliability signal), and cache hit rate (your caching-is-working signal). That is enough to answer the three questions that actually come up — why did the bill move, why is this slow, and why did this request fail — without drowning in metrics nobody reads.
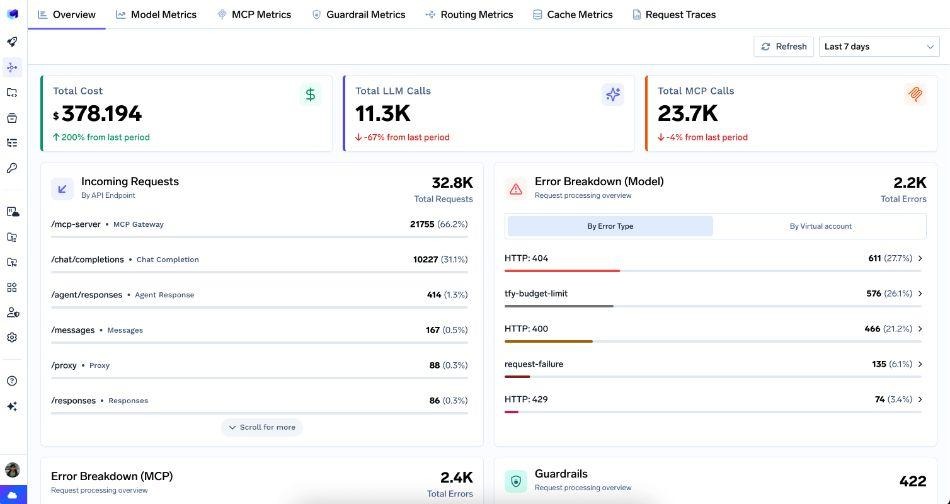
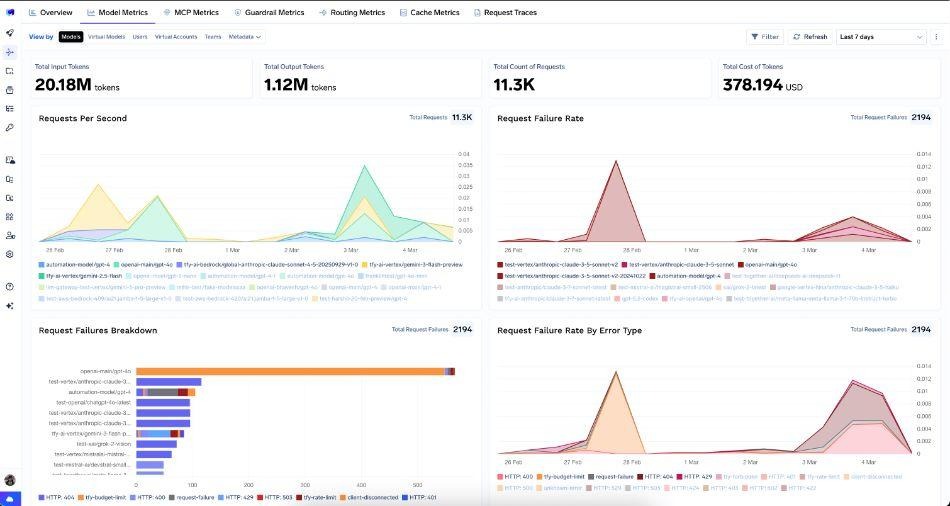
Requests per second, failure rate, latency percentiles, and cost per Claude model. Source: TrueFoundry docs.
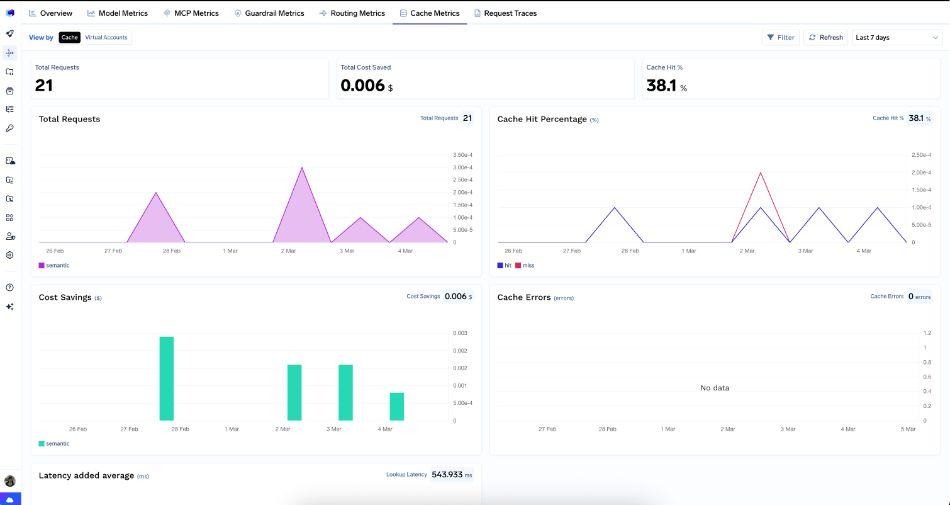
Cache hit rate, dollars saved, and lookup latency — the signal that caching is paying off. Source: TrueFoundry docs.
Metrics tell you something moved; traces tell you what happened to a specific request. For Claude, the traces worth having are the ones application logging tends to miss: a request that was refused, a tool call that errored, a guardrail that blocked the prompt, or a request that fell back to a different model. If your instrumentation lives in the application and only logs successful completions, those cases leave no record — and they are exactly the cases you get paged about.
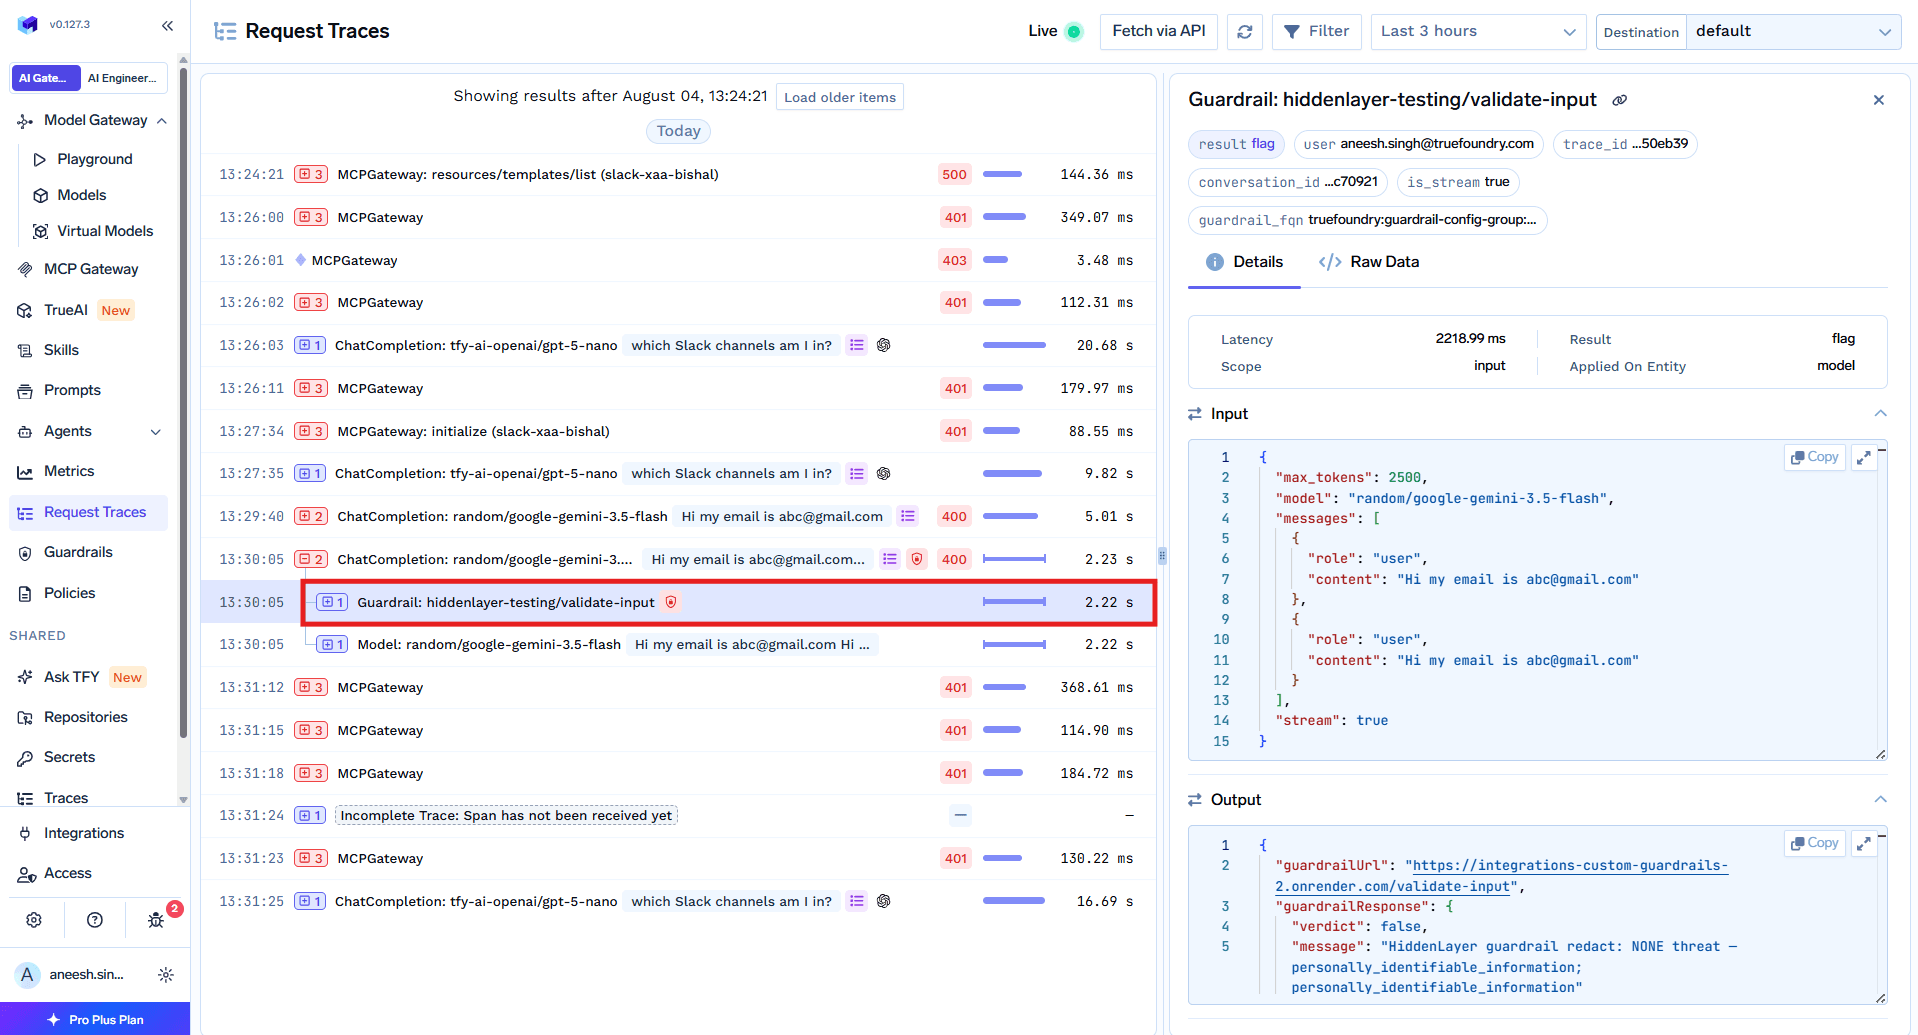
A per-request trace with its latency, outcome, and what each step did — including blocks and errors. Source: TrueFoundry docs.
A trace should carry the full story of the call: which model served it (after any fallback), the token split, the latency of each step, any guardrail or tool outcome, and the final status — refusals and errors included. With that, reconstructing “why did this user get this answer” is reading a trace, not guessing from partial logs.
The reason observability becomes a project is coverage: an SDK in every service, gaps from the team that forgot, and nothing at all for refused requests. Routing Claude through a gateway removes that, because every request passes through one place and is recorded as a side effect — cost, the token split, latency, errors, cache outcomes, and guardrail results, for every call, with no per-service instrumentation.
That does not mean a second monitoring stack. If you already run Datadog, Grafana, or similar, the gateway should export rather than replace: Claude traces and metrics over OpenTelemetry into the tools you already use. You get complete, Claude-aware coverage at the gateway and keep your existing dashboards and alerts.
They sum “input tokens” and call it cost. Claude input splits into normal, cache-write, and cache-read at 1x, 1.25x, and 0.1x. Collapse them and your cost number is wrong and your cache signal is gone.
They don’t track cache hit rate. Without it you can’t tell a working cache from one that writes on every request and never reads. It’s the highest-value Claude-specific metric.
They only log successful calls. Refusals, errors, blocks, and fallbacks are the requests you debug. Capture them — which is why gateway-side tracing beats app-side logging.
They build a parallel monitoring stack. You don’t need one. Export Claude telemetry over OpenTelemetry into the observability tools you already run.
TrueFoundry AI Gateway offre une latence d'environ 3 à 4 ms, gère plus de 350 RPS sur 1 processeur virtuel, évolue horizontalement facilement et est prête pour la production, tandis que LiteLM souffre d'une latence élevée, peine à dépasser un RPS modéré, ne dispose pas d'une mise à l'échelle intégrée et convient parfaitement aux charges de travail légères ou aux prototypes.



Sum the three input buckets separately: input_tokens (1x), cache_creation_input_tokens (1.25x, or 2x for the 1-hour TTL), and cache_read_input_tokens (0.1x, or 0.05x on Opus 5.5 and Sonnet 5.5), plus output tokens. Collapsing them into one “input” figure misstates cost.
Cache hit rate, alongside cost and error rate. It’s the only signal that distinguishes a cache that’s actually being read from one that only pays the write premium.
Metrics tell you a number moved; a trace reconstructs a single request — including refusals, tool errors, guardrail blocks, and fallbacks that app-side logs usually miss.
Not if Claude goes through a gateway. Every call is recorded there as a side effect, so coverage is complete — including refused requests — without per-service instrumentation.
Yes. Export Claude traces and metrics over OpenTelemetry into Datadog, Grafana, or your current stack rather than running a separate one.



Les dernières nouvelles, articles et ressources envoyés dans votre boîte de réception