What is Honeycomb?
Honeycomb is an observability platform designed for debugging and understanding complex distributed systems. It ingests OpenTelemetry data natively over OTLP (HTTP and gRPC) and provides a query builder, trace viewer, and dashboards for analysing LLM gateway behaviour in production.Key Features of Honeycomb
- Trace Query Builder: Slice and filter spans by any attribute, including TrueFoundry-emitted fields like
tfy.span_typeandgen_ai.request.model. - Metrics Explorer: Visualise OTLP metrics over time with aggregations and groupings across models, users, and environments.
- Environments and Datasets: Organise telemetry into named datasets per service or team, with the
x-honeycomb-datasetheader controlling routing.
Prerequisites
Before integrating Honeycomb with TrueFoundry, ensure you have:- TrueFoundry Account: Create a TrueFoundry account and follow the instructions in our Gateway Quick Start Guide.
- Honeycomb Account: Sign up at honeycomb.io and create an ingest API key with Send Events permission.
Understanding the Honeycomb Endpoint
Honeycomb exposes two regional base URLs:| Region | Base URL |
|---|---|
| US (default) | https://api.honeycomb.io |
| EU | https://api.eu1.honeycomb.io |
/v1/traces or /v1/metrics. For example, a US traces endpoint is https://api.honeycomb.io/v1/traces.
Your account region is shown in the Honeycomb UI URL — ui.honeycomb.io indicates US; ui.eu1.honeycomb.io indicates EU.
Integration Steps
Create a Honeycomb Ingest API Key
- Log into your Honeycomb account and navigate to Team Settings → API Keys.
- Click Create API Key and select the Send Events permission scope.
- Copy the generated API key — you will need it in the next step.
Configure OTEL Export in TrueFoundry
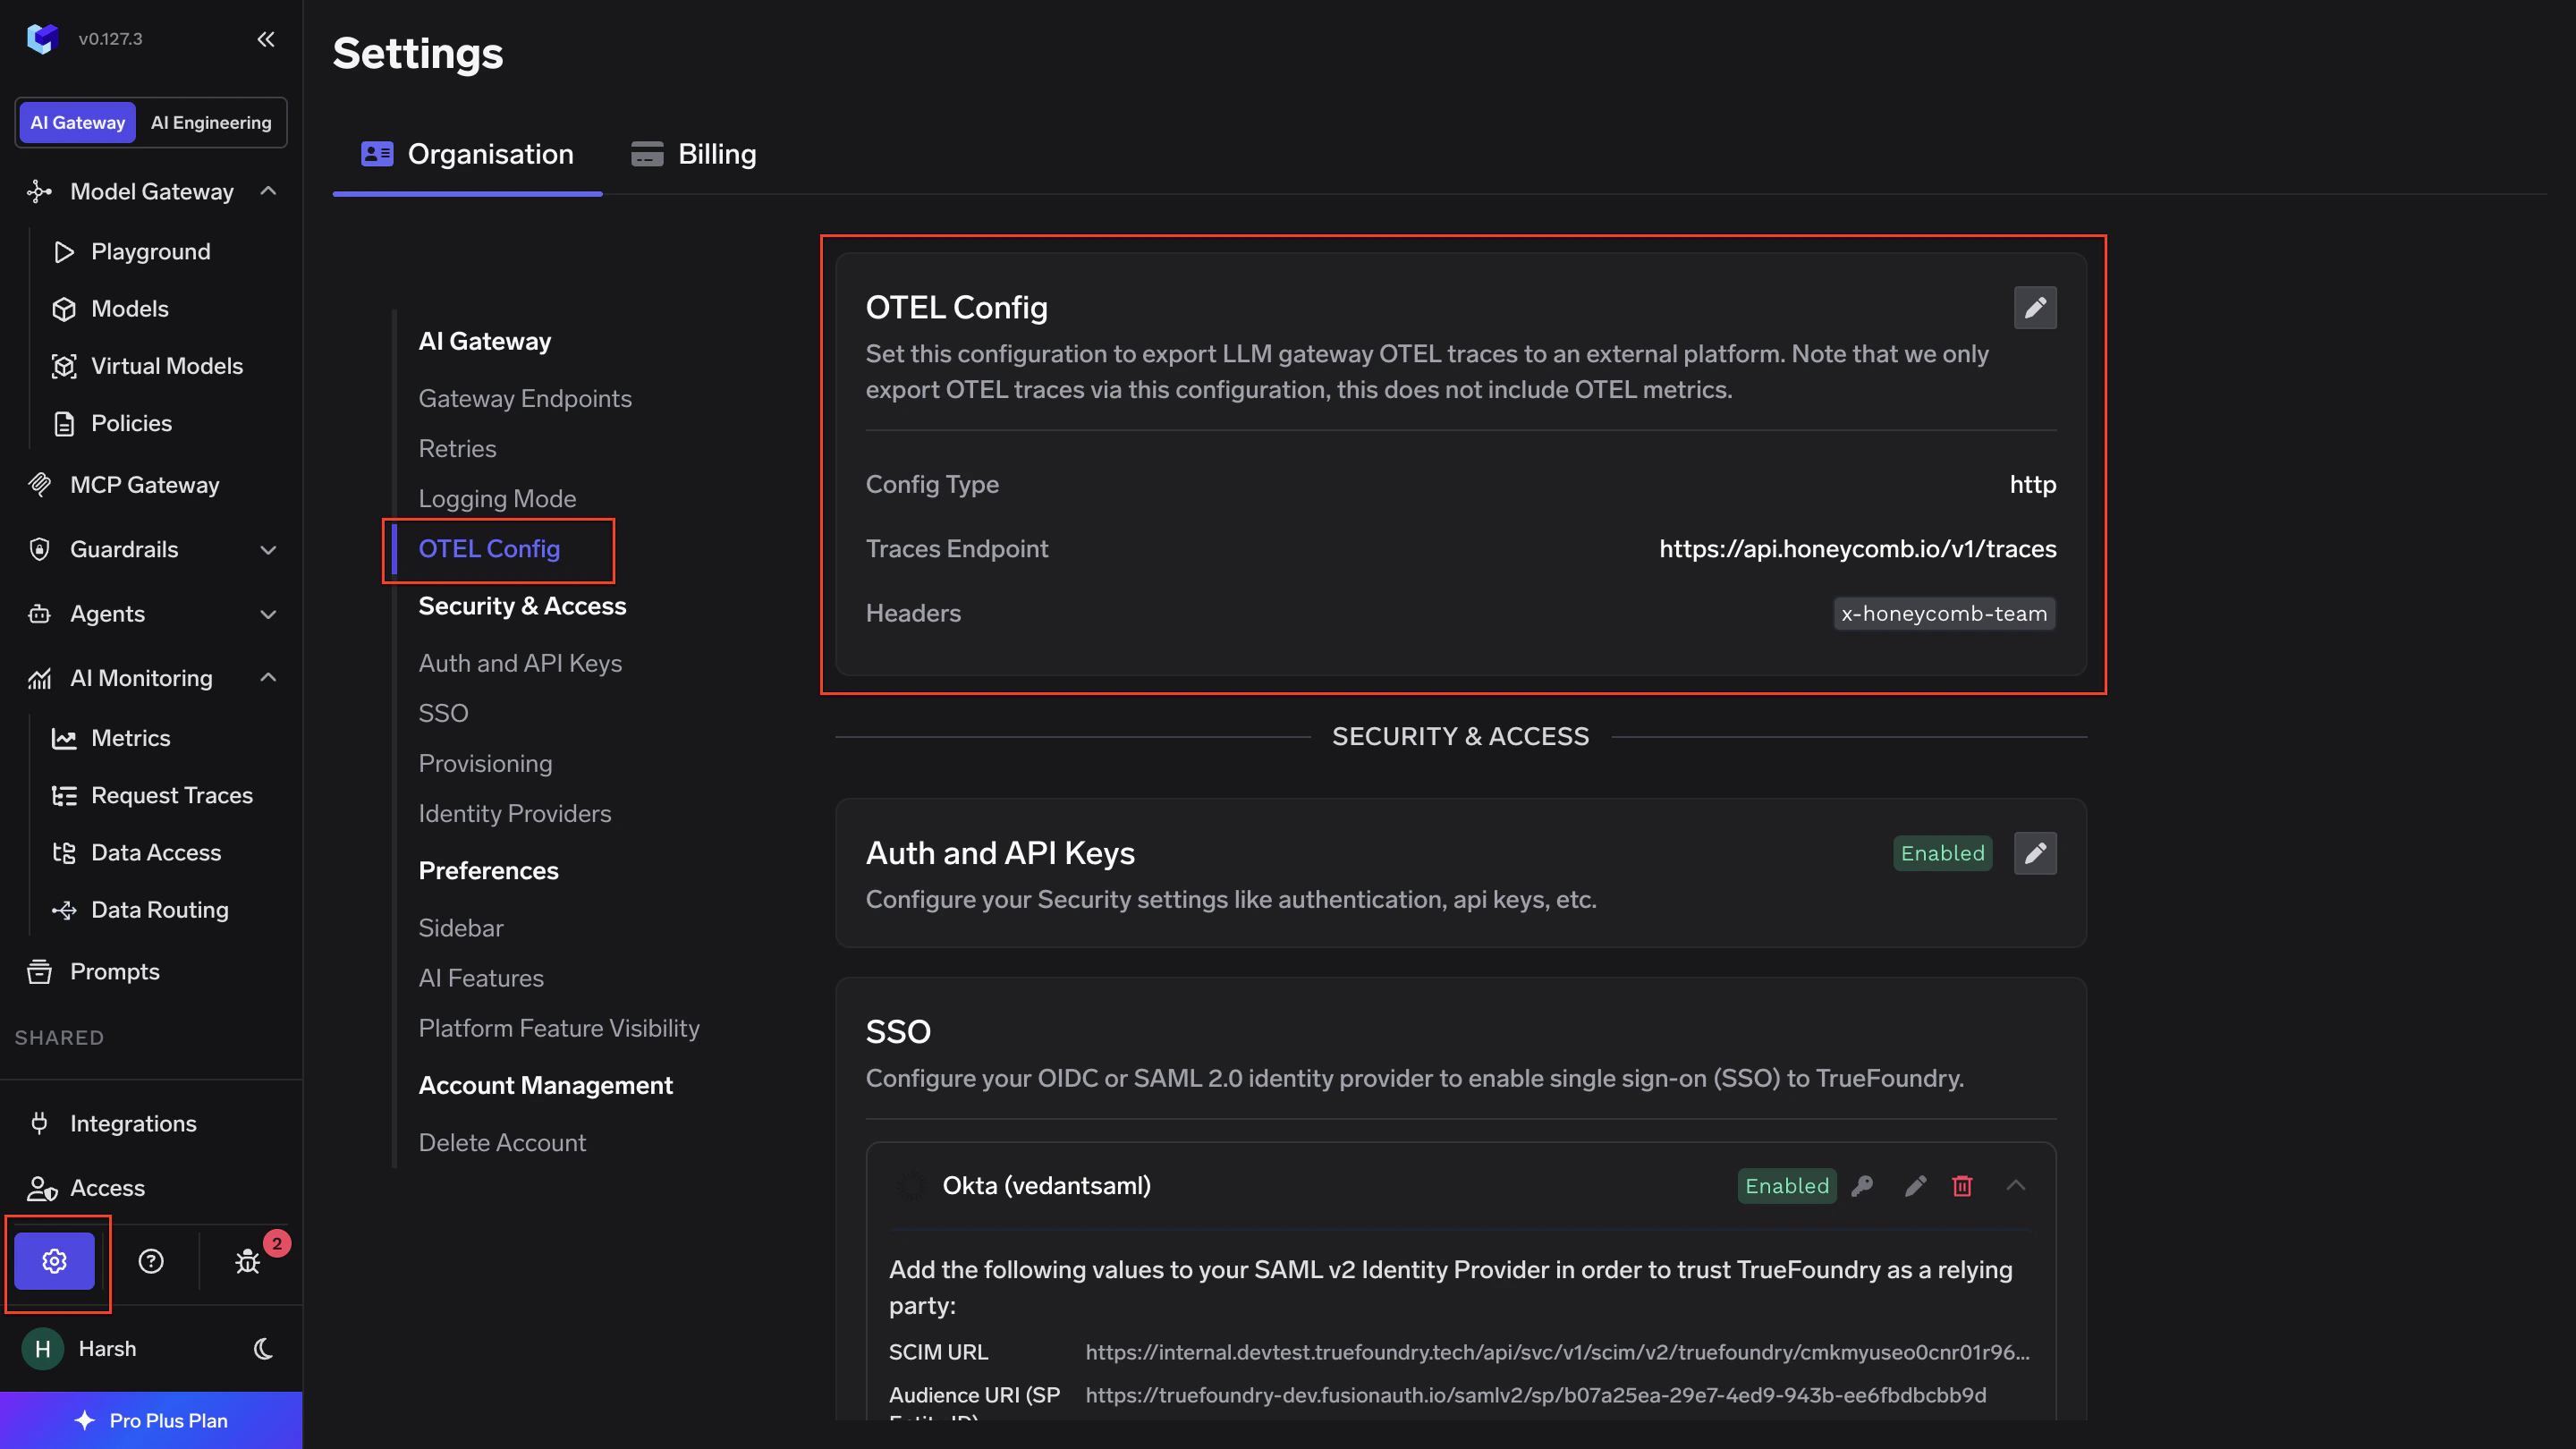
- Go to AI Gateway → Controls → Settings in the TrueFoundry dashboard.
- Scroll down to the OTEL Config section and click the edit (✏️) button.
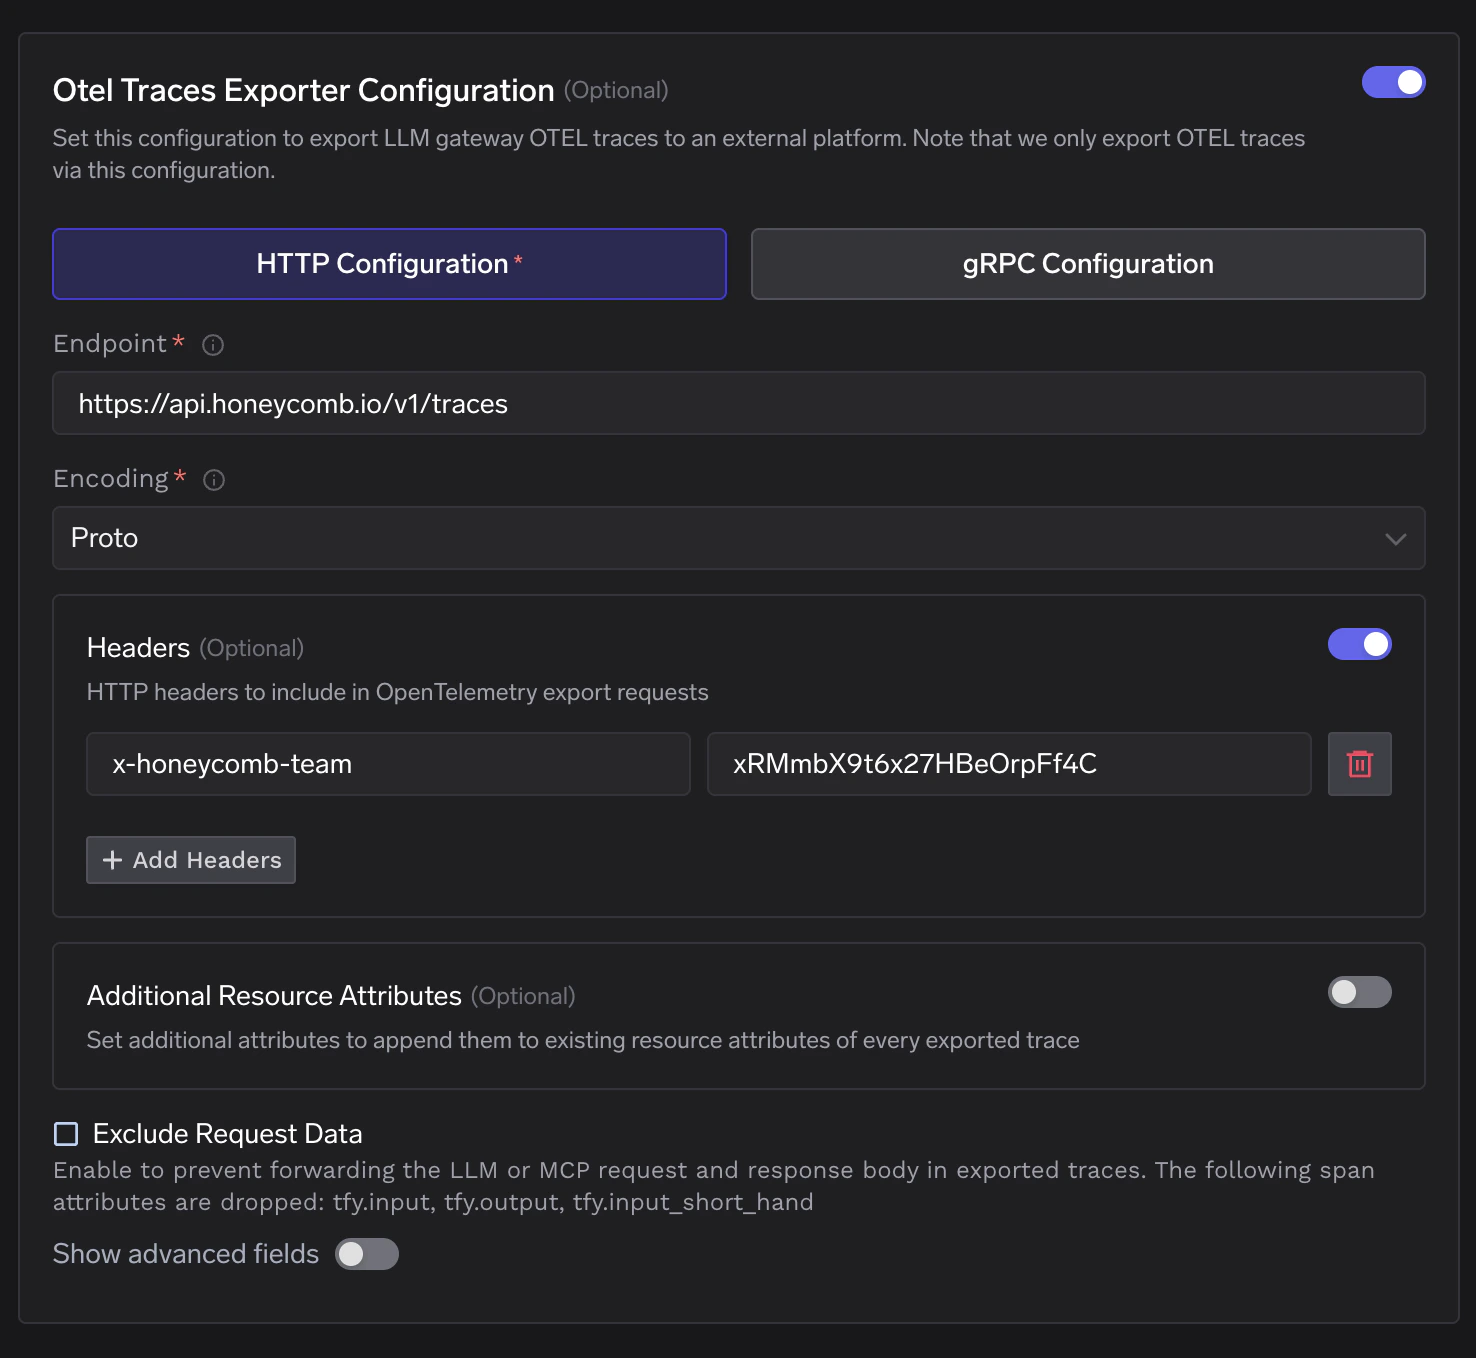
- Enable the Otel Traces Exporter Configuration toggle and fill in:
| Field | Value |
|---|---|
| Toggle | Enabled |
| Protocol | HTTP Configuration |
| Endpoint | https://api.honeycomb.io/v1/traces (US) or https://api.eu1.honeycomb.io/v1/traces (EU) |
| Encoding | Proto |
| Header Key | x-honeycomb-team |
| Header Value | <your-honeycomb-api-key> |
- Enable the Otel Metrics Exporter Configuration toggle and fill in:
| Field | Value |
|---|---|
| Toggle | Enabled |
| Protocol | HTTP Configuration |
| Endpoint | https://api.honeycomb.io/v1/metrics (US) or https://api.eu1.honeycomb.io/v1/metrics (EU) |
| Encoding | Proto |
| Header Key | x-honeycomb-team |
| Header Value | <your-honeycomb-api-key> |
- Click Save to apply the configuration.
To route metrics into a specific Honeycomb dataset rather than the default
unknown_metrics, add a second header: key x-honeycomb-dataset, value set to your chosen dataset name. Click + Add Headers in TrueFoundry to add multiple header pairs.Verify the Integration
- Make a request through the TrueFoundry AI Gateway.
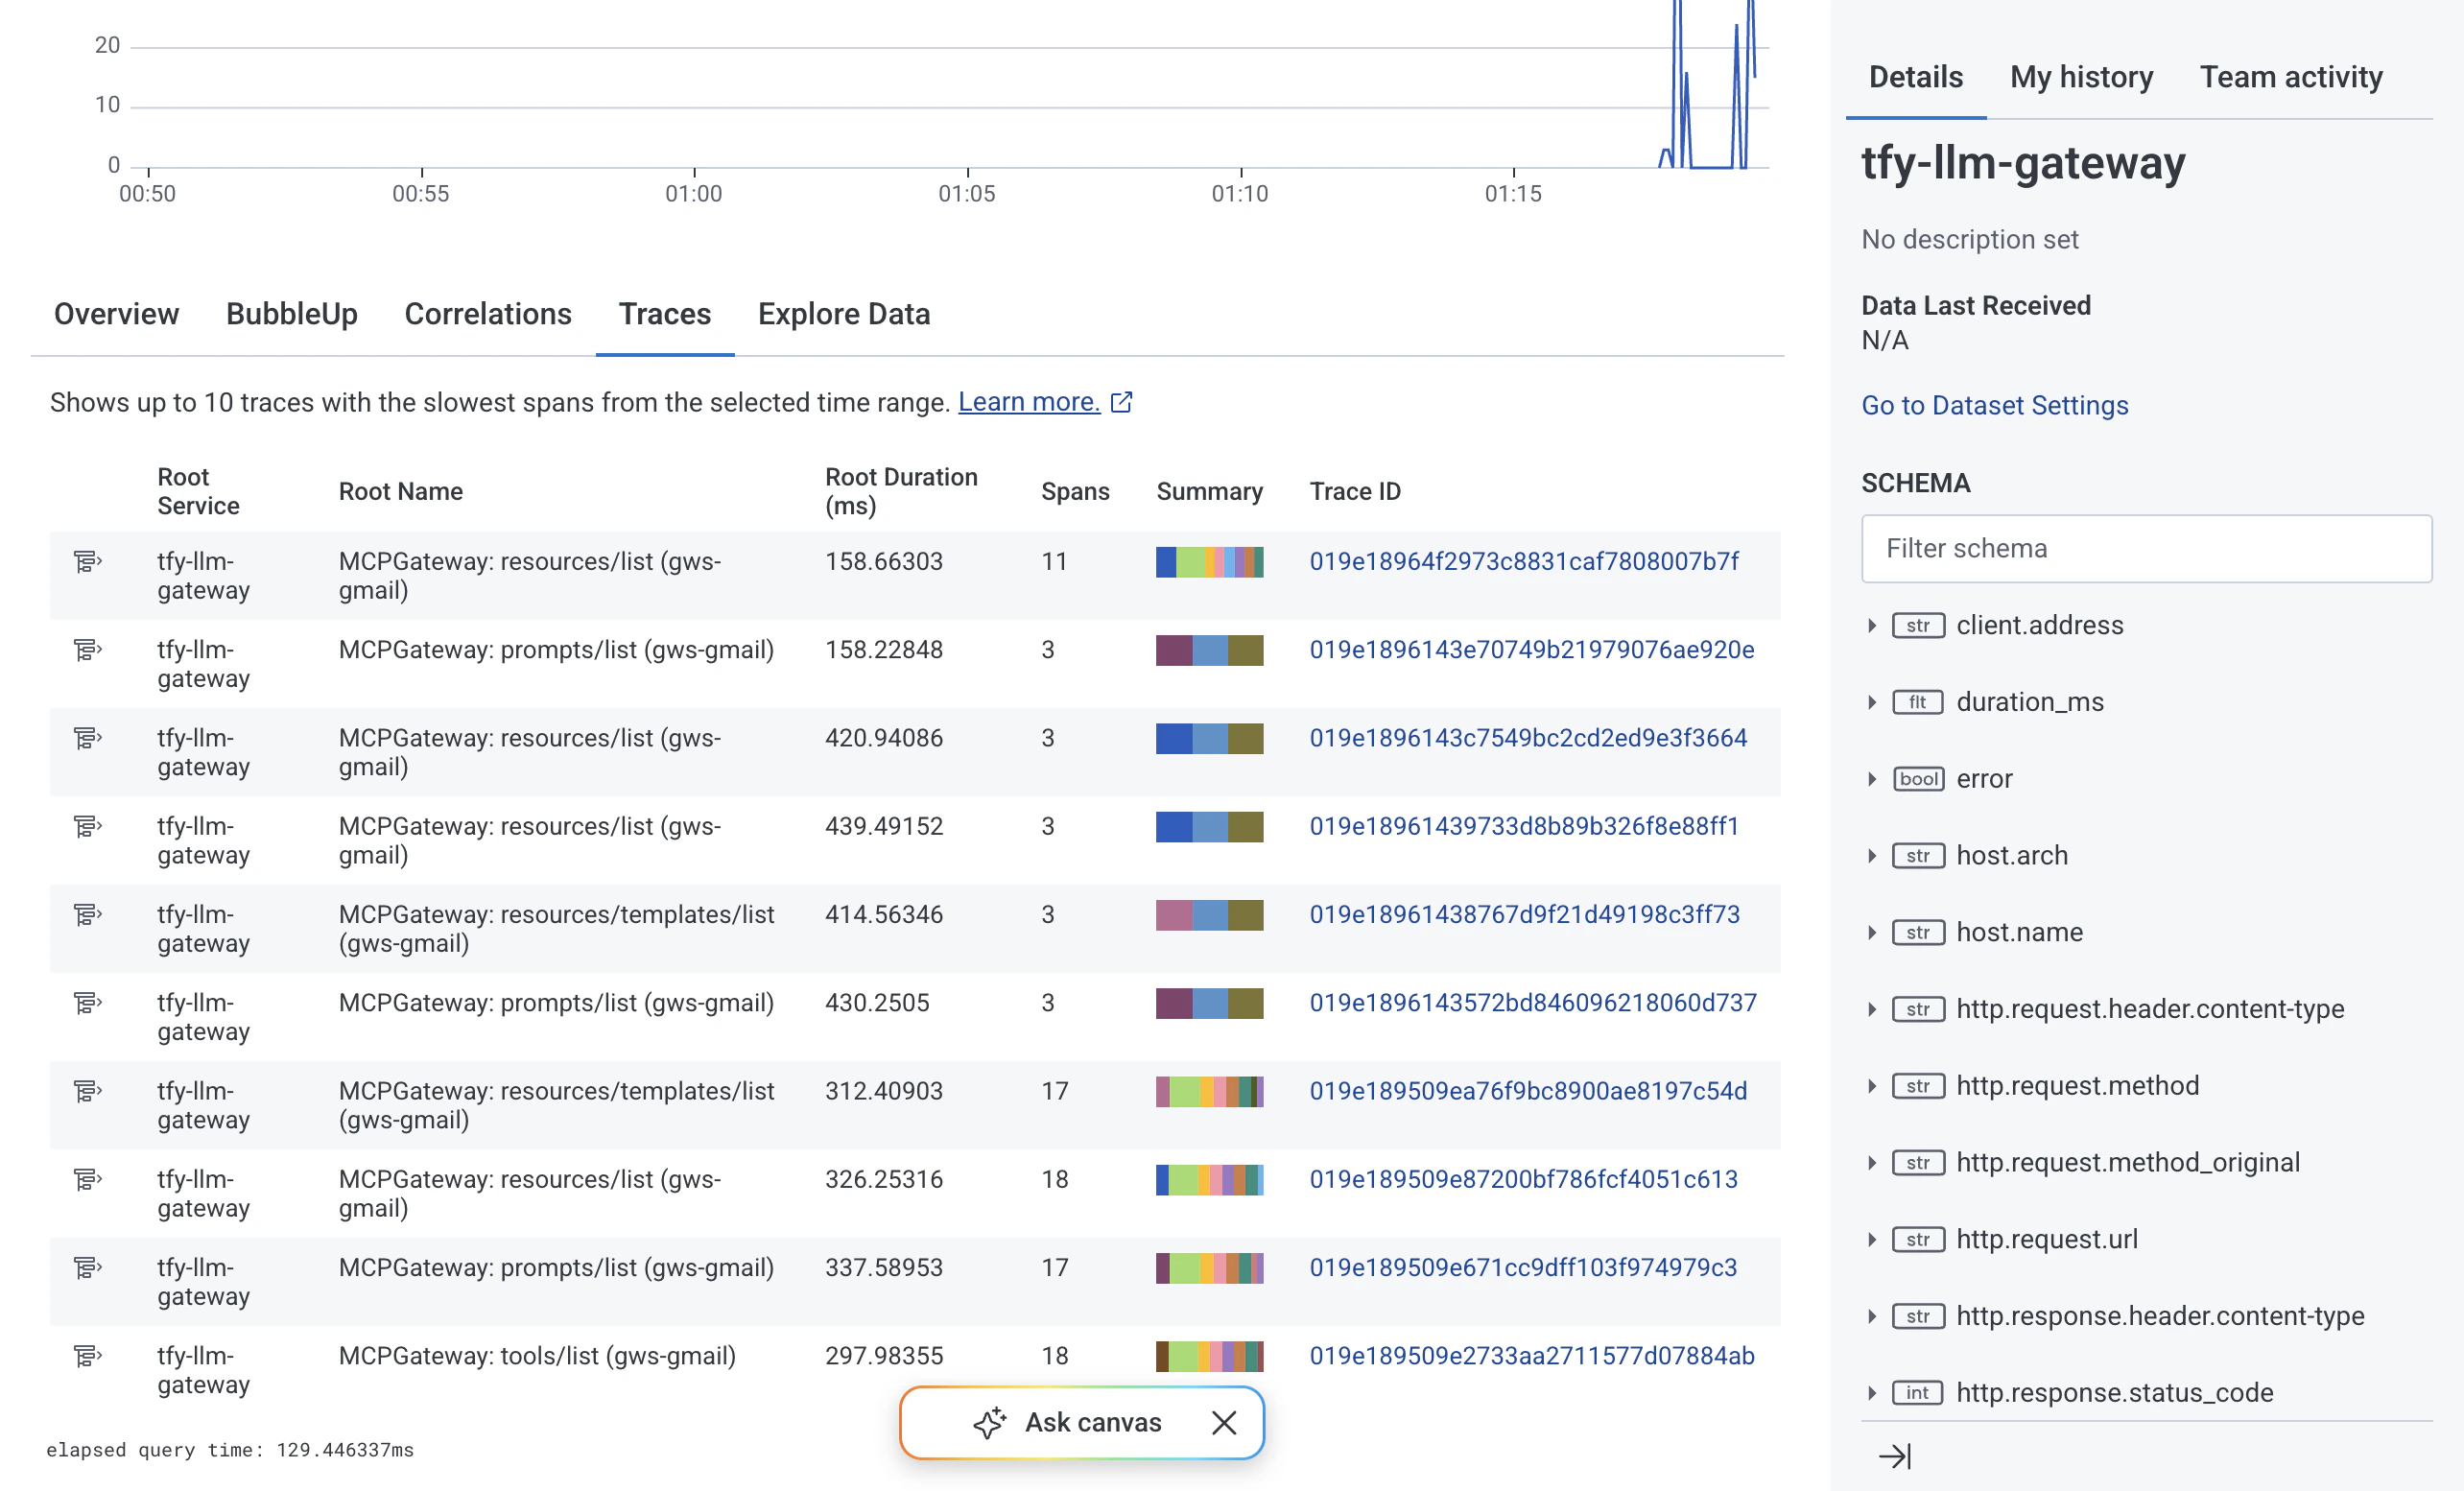
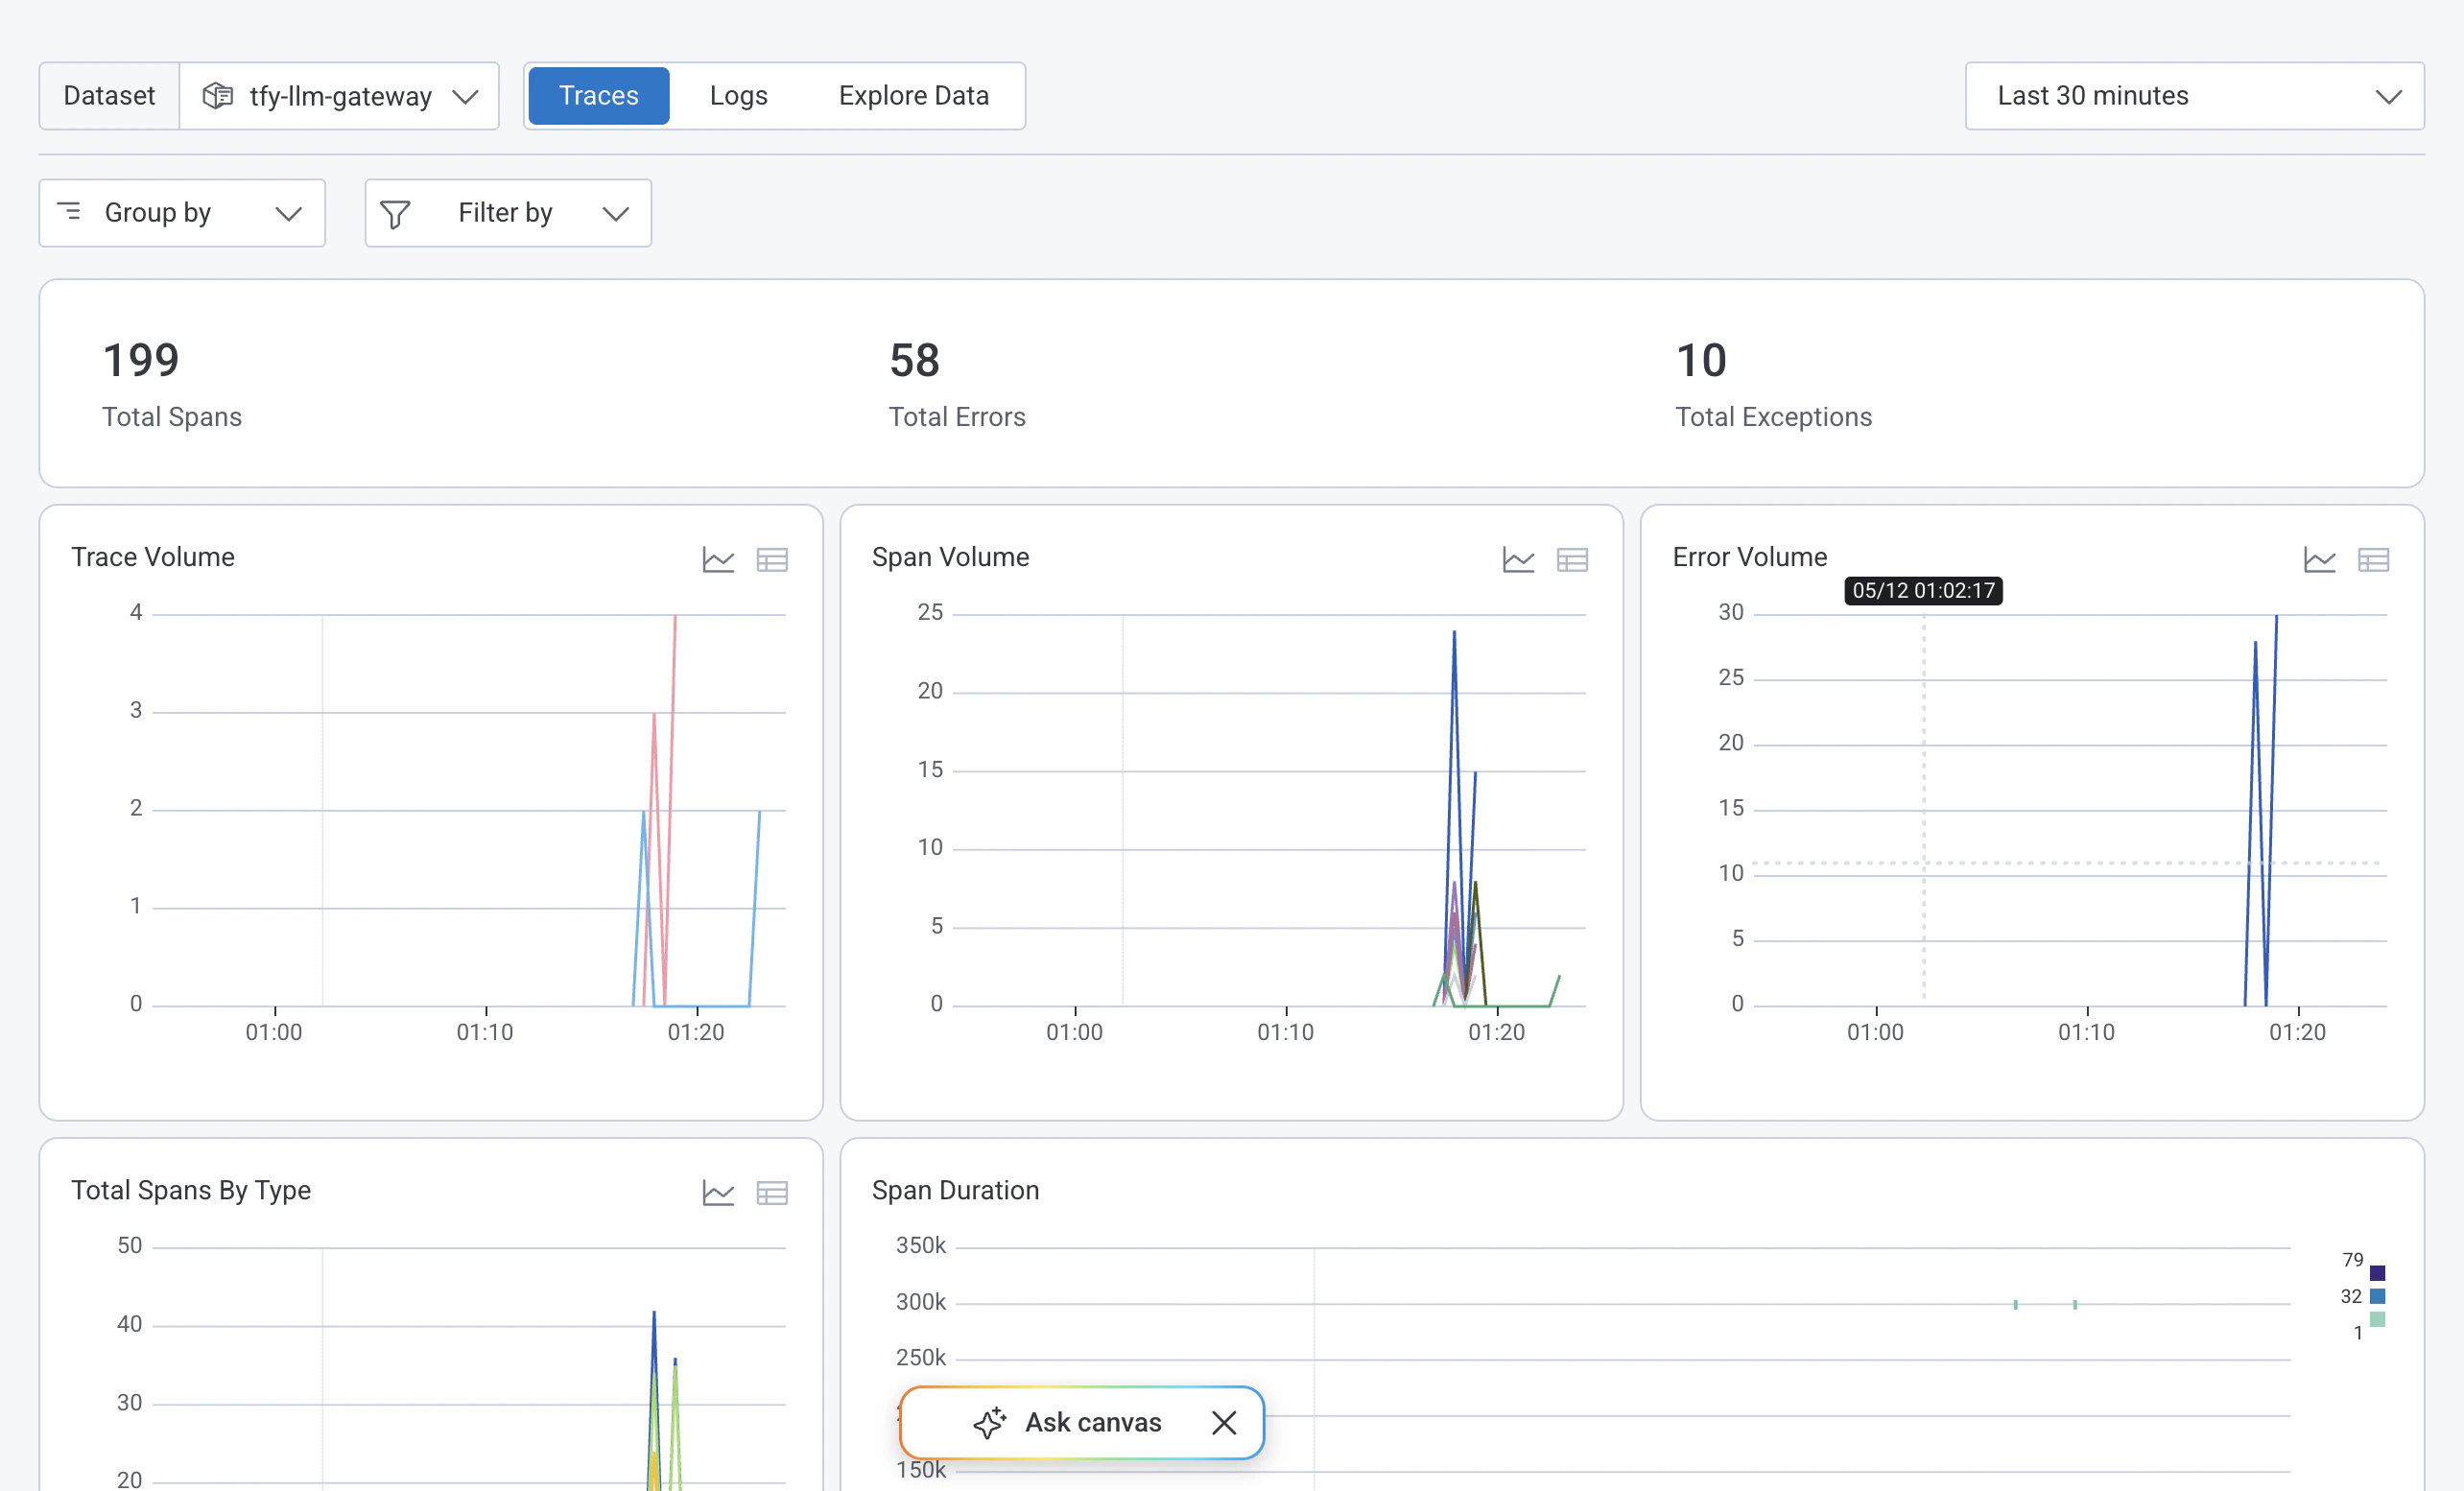
- Log into your Honeycomb account and open the Traces tab on the
tfy-llm-gatewaydataset. - You will see a list of traces with Root Service set to
tfy-llm-gateway. Span names follow the patternMCPGateway: resources/list,ChatCompletion, and so on depending on the operation type.
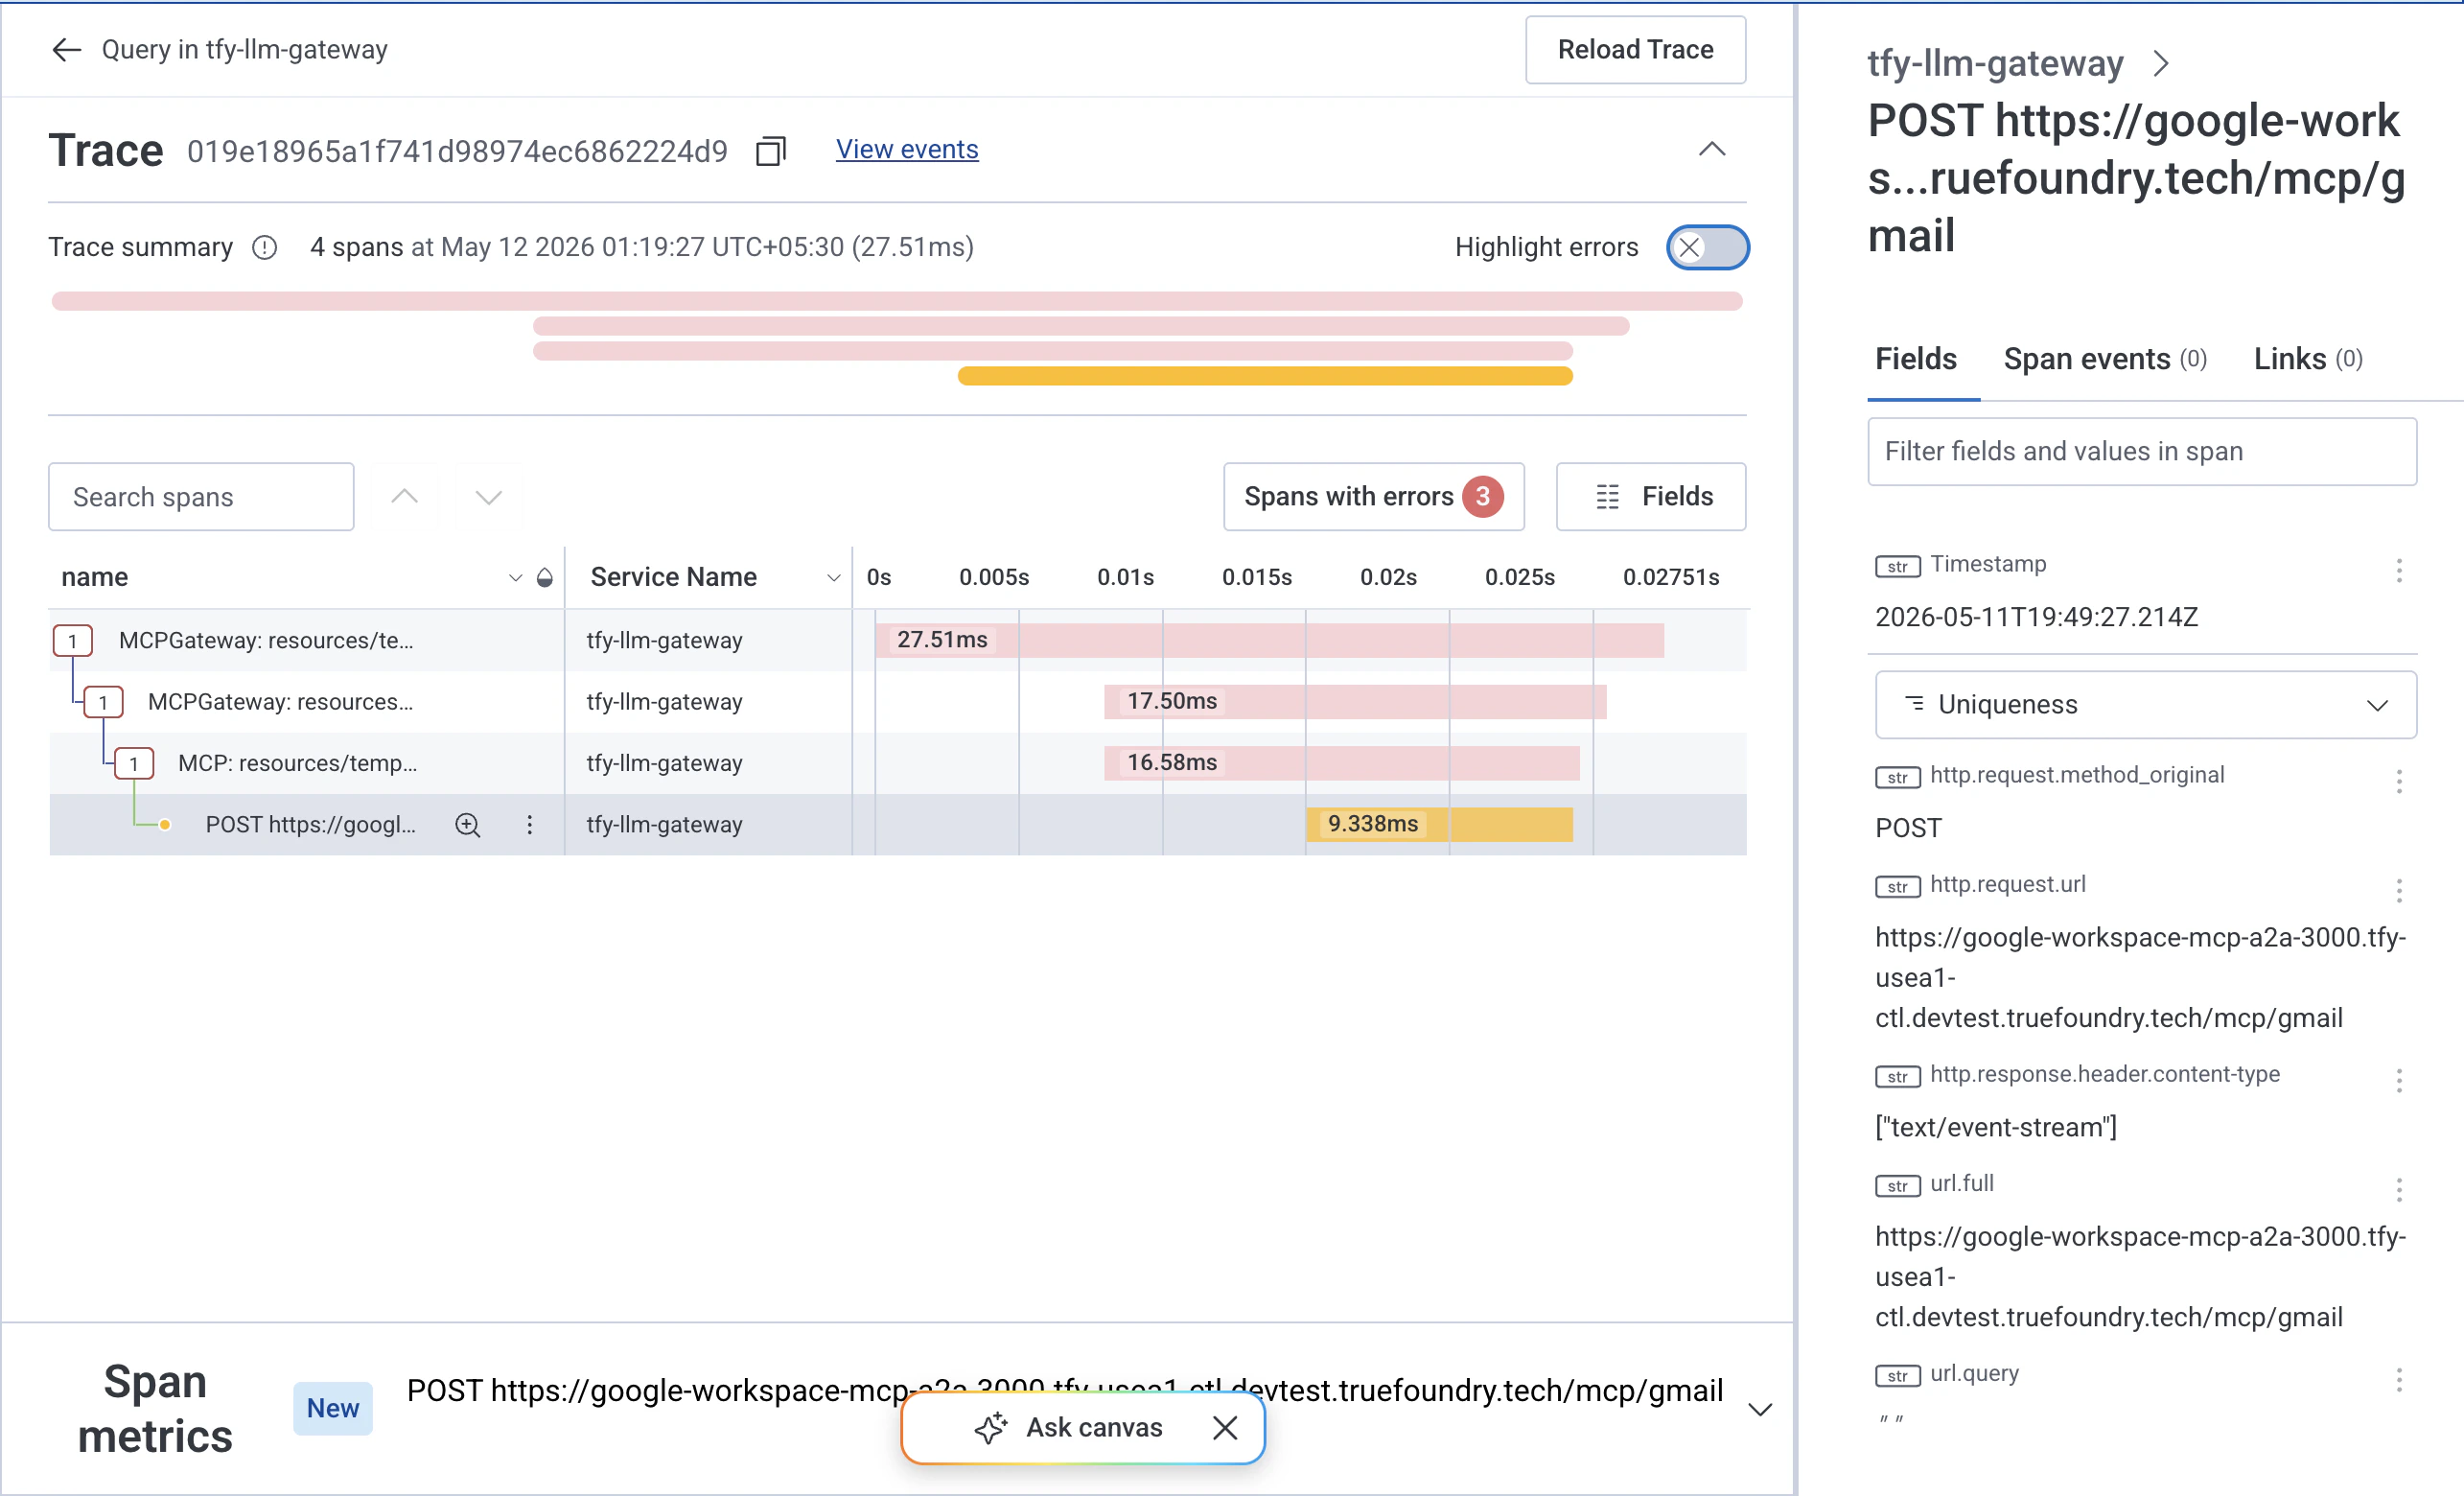
- Click any Trace ID to expand it and inspect individual spans. You will see the full span waterfall including nested child spans with latency breakdowns.
- From the dataset Overview tab you can also monitor aggregate Trace Volume, Span Volume, and Error Volume over time to confirm data is flowing continuously.
Configuration Reference
| Configuration | Value |
|---|---|
| Traces Endpoint (US) | https://api.honeycomb.io/v1/traces |
| Traces Endpoint (EU) | https://api.eu1.honeycomb.io/v1/traces |
| Metrics Endpoint (US) | https://api.honeycomb.io/v1/metrics |
| Metrics Endpoint (EU) | https://api.eu1.honeycomb.io/v1/metrics |
| Protocol | HTTP |
| Encoding | Proto |
| Auth Header Key | x-honeycomb-team |
| Auth Header Value | Your Honeycomb ingest API key |
| Dataset Header Key (optional) | x-honeycomb-dataset |
| Dataset Header Value (optional) | Your chosen Honeycomb dataset name |