.webp)
June 25, 2026
|
5 min read

Published: May 13, 2026

Blazingly fast way to build, track and deploy your models!
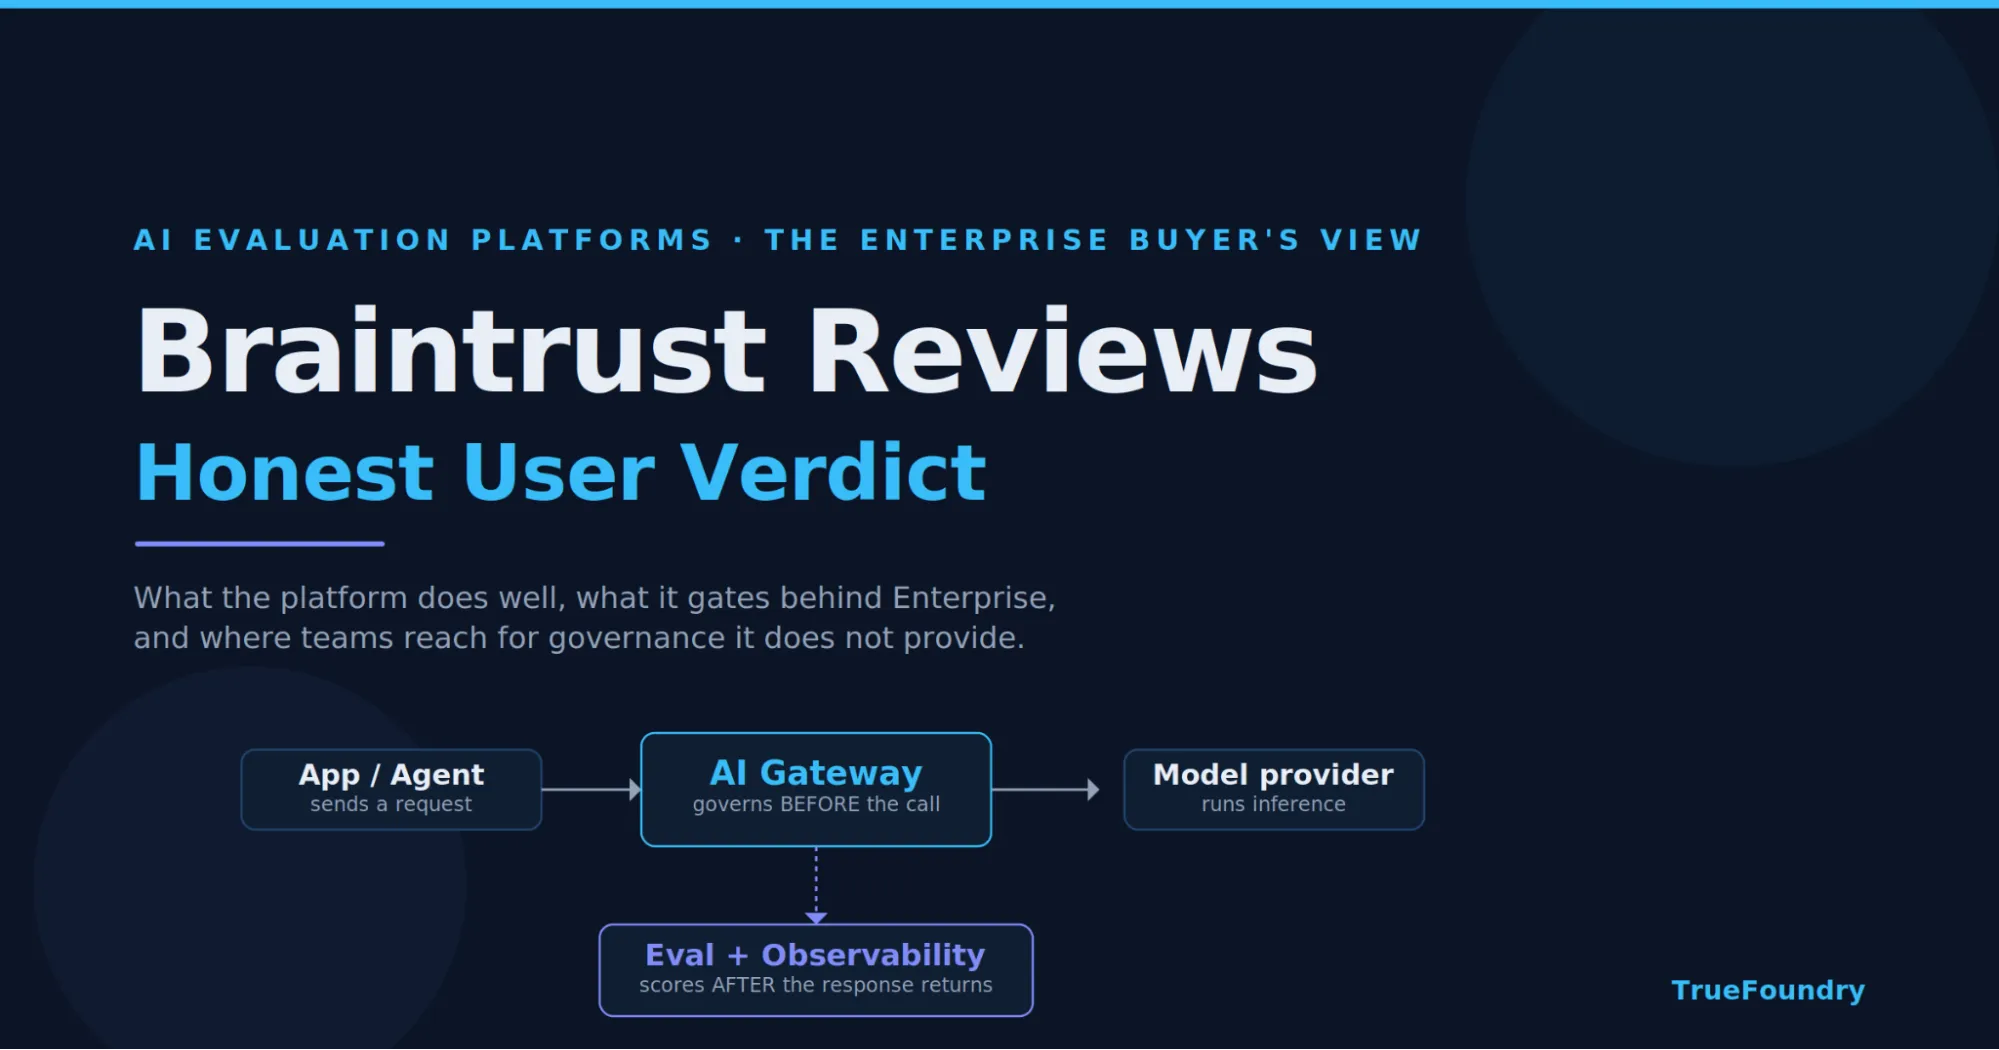
Part 1 named the issue: tokenmaxxing, the new lines-of-code metric, where engineers optimize for AI usage volume because it is the number being measured. Part 2 prescribed the architectural cure: identity, policy, safety, and observability attached to every request at the gateway. This final part turns that architecture into something an organization can actually operate week over week.
The most consequential design decision in this layer is also the most easily missed. The dashboard you build will train behavior. A leaderboard creates social pressure to burn tokens. A control room helps platform, security, finance, and engineering leaders answer harder questions and act on the answers.
The questions that actually matter: Which workflows create value per dollar? Which agents are looping? Which teams are under-using AI where it would genuinely help? Which premium-model usage is justified, and which is decorative? Which guardrail events are noise and which signal real risk?
Get the panels right and these become routine ops questions answered in Monday standup. Get them wrong and your most accurate dashboard quietly trains the same gameable behavior you set out to prevent.
Before panels, the design rules. Each principle is the direct answer to a failure mode that leaderboards introduce.
The adoption panel answers a deceptively simple question: how many engineers are actually using AI tools on any given day?
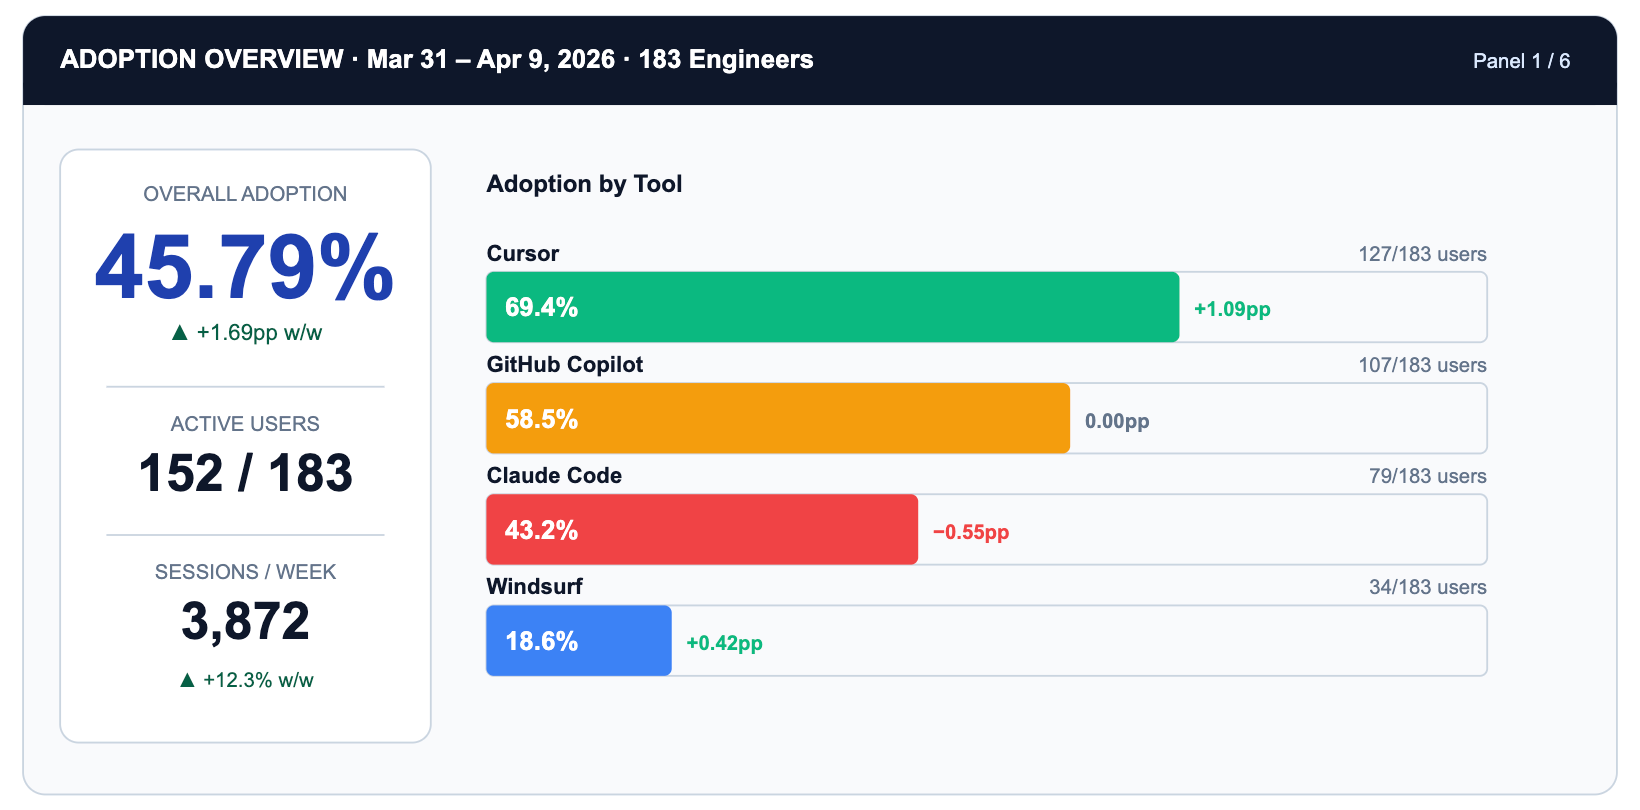
Notice what the panel does not show: individual rankings. The unit is vendor x team x day. The action it produces is not 'congratulate Alex' but 'Claude Code adoption is 26 percentage points below Cursor. Is it a tooling friction issue or a use-case fit issue?' That is a question worth a sprint.
TrueFoundry makes this possible via the X-TFY-METADATA header attached to every gateway request. The header carries a stringified JSON object whose fields include user identity, team membership, tool name, project tag, and session ID.
→ TrueFoundry Request and Response Headers Reference
→ Analytics Dashboard Overview
Adoption tells you who is using AI. Burn rate tells you where the money is going. These are different questions and they belong in different panels.
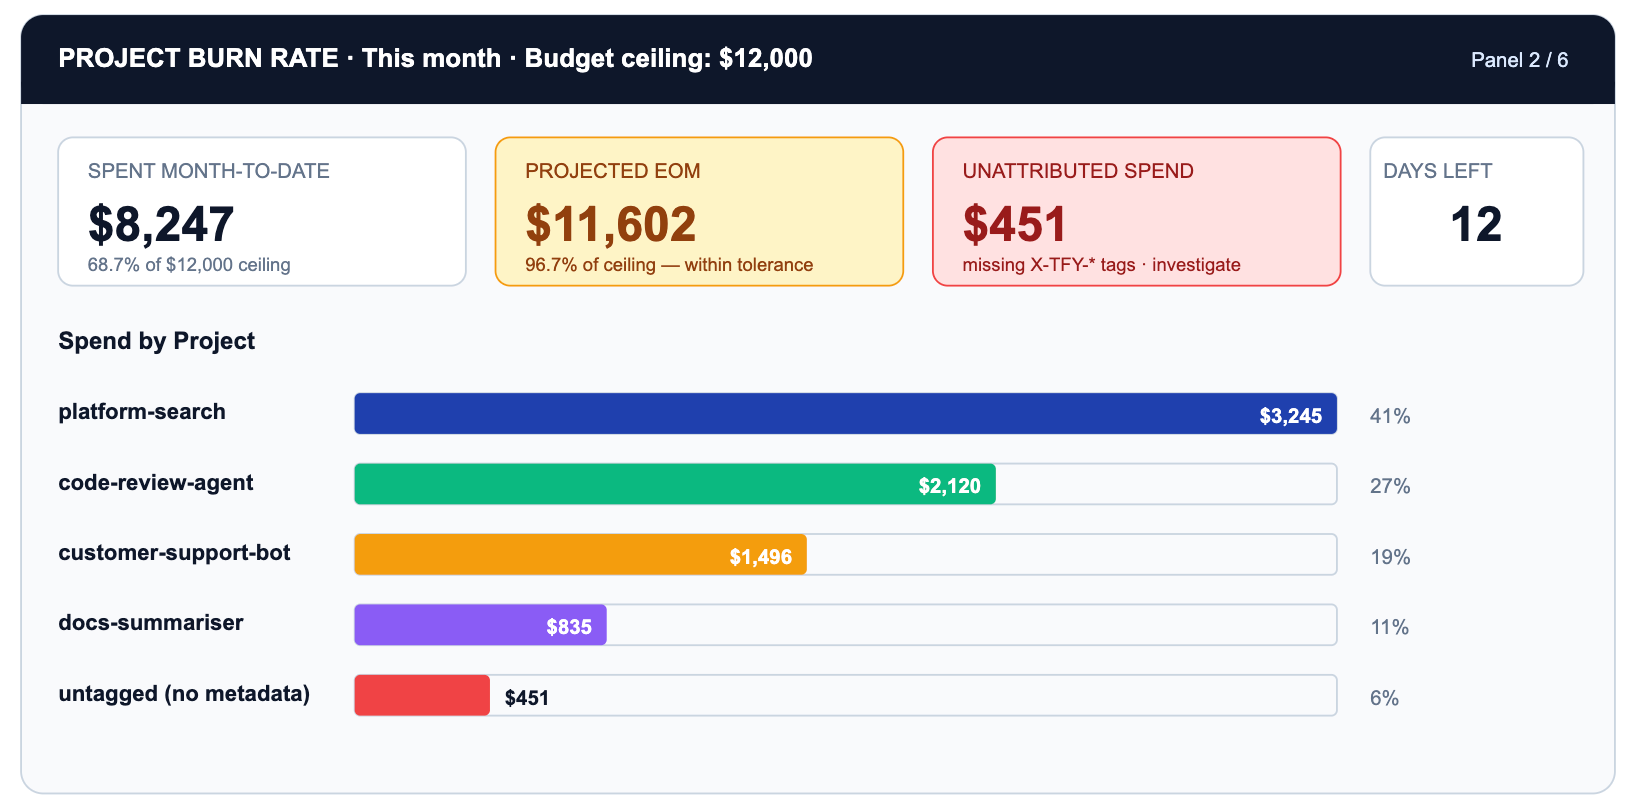
The critical row is UNTAGGED. $451 of spend has no project metadata. That is a gateway configuration gap, not a spend problem. Every untagged request cannot be attributed to a business outcome, governed by a budget policy, or appear in a useful burn-rate chart.
TrueFoundry Budget Limiting lets you set hard ceilings per project, per team, per model family, or per time window. When platform-search hits 100% of its $4,000 monthly ceiling, requests start returning 429s or fall back to a cheaper model based on your configured policy.
→ Budget Limiting — windows, ceilings, and alerts
→ Rate Limiting — per-user, per-model, per-metadata-tag
The most expensive new failure mode in an agentic world is the loop: an agent that retries indefinitely because its exit condition is never satisfied, or because the tool it calls keeps returning errors. A single looping agent can consume as many tokens in an hour as a team of engineers does in a day.
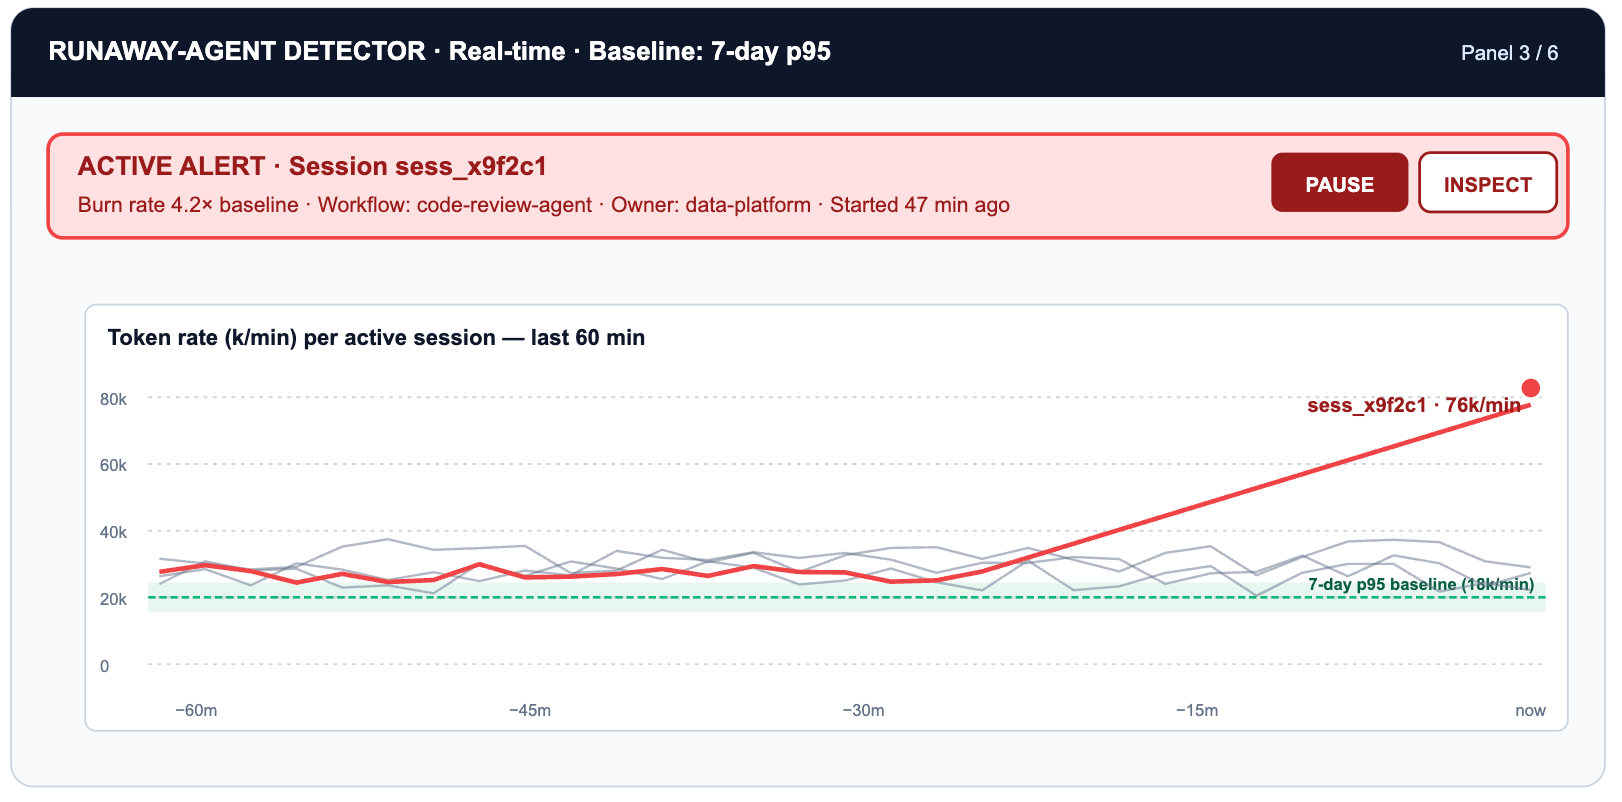
This panel requires the OTEL signal that TrueFoundry exports: per-session token rate over time, not just per-request counts. The p95 baseline is computed from the previous seven days of sessions for each workflow tag. Anything exceeding 3x that baseline triggers a pager event and optionally a session kill via the rate-limit enforcement path.
→ Export OpenTelemetry Data — traces, spans, token counters
→ Rate Limiting — enforcing per-session ceilings
Not every task that reaches a frontier model deserves a frontier model. Routing a classify-this-email task to Claude Opus 4.7 at $5/$25 per million tokens when Haiku 4.5 at $1/$5 would handle it within 2pp of the same accuracy is paying 5x for capability you do not use. The choice is invisible until aggregated across thousands of daily requests — which is exactly what this panel does.
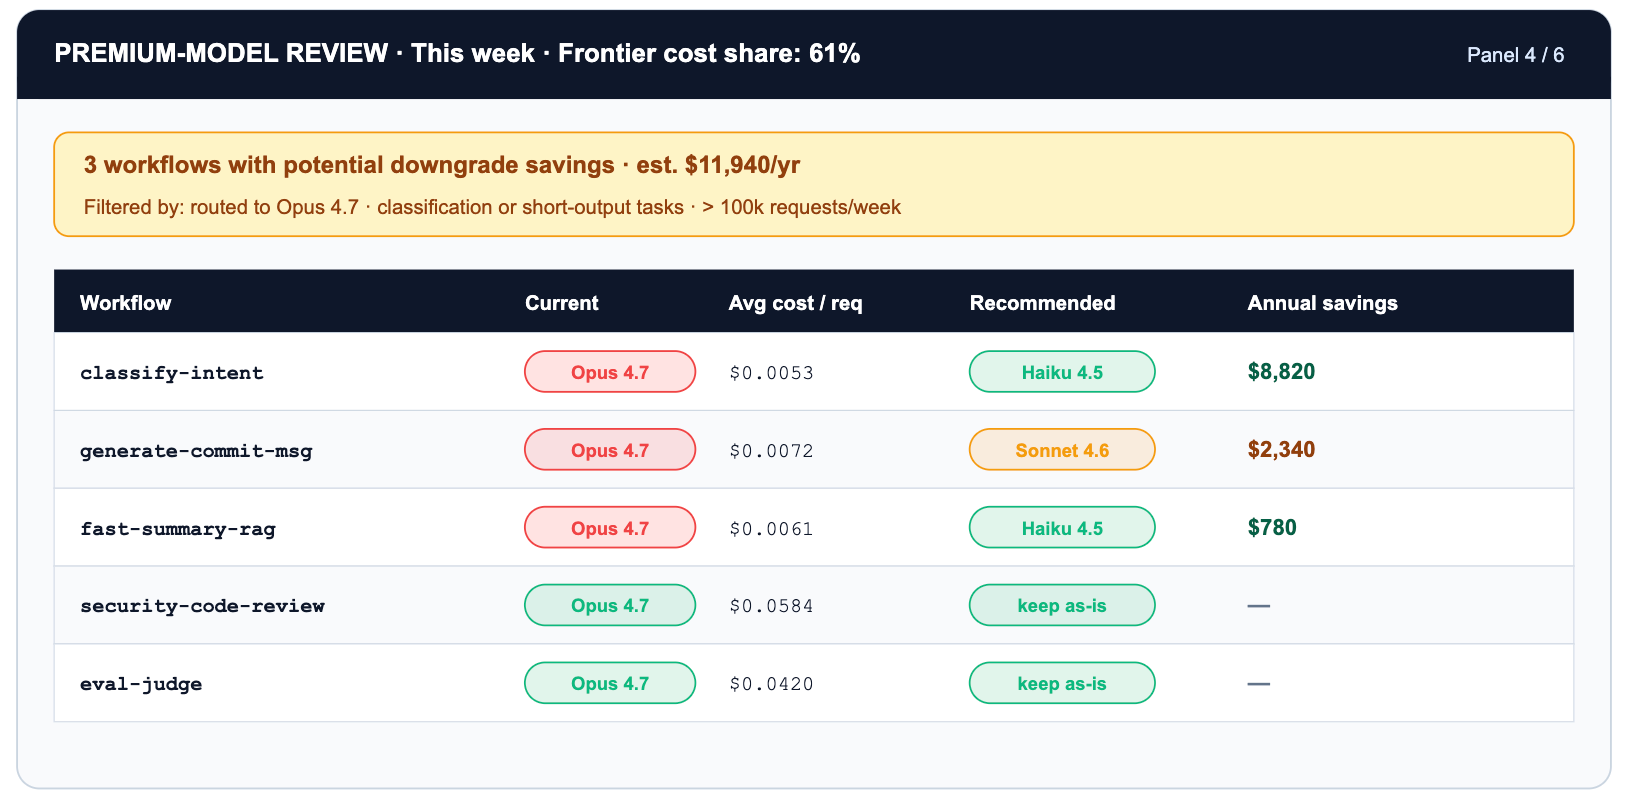
Two layered optimizations stack on this panel. Routing classify-intent from Opus 4.7 to Haiku 4.5 is a 5x token-cost reduction. On top of that, enabling prompt caching on the system prompt cuts cached input tokens by another 90% — a stacked discount that turns a $3,200/mo workflow into roughly $50/mo with no change in accuracy.
There is also a hidden version of this panel: tokenizer drift. When Anthropic released Opus 4.7, the new tokenizer produces up to 35% more tokens for the same input vs Opus 4.6. The headline rate card did not change. The effective per-request cost did. The only way to see this is per-model-version token telemetry on the gateway. The only way to react is to roll back the virtual model alias — which on TrueFoundry is a YAML diff, not a sprint.
TrueFoundry's virtual model routing makes acting on this panel zero-friction. You configure a logical model name like 'code-review-fast' that routes to different physical endpoints by workflow tag, time of day, or load — without touching application code. A/B testing a cheaper model is a YAML diff, not a sprint.
→ Routing Overview — weight, priority, fallback, prompt caching
The safety panel's job is triage. Most guardrail events are noise: test traffic, developer experimentation, expected edge cases in production. A handful are real risk: PII leaking through a prompt, a secret appearing in agent-generated code, a prompt injection attempt in user-supplied input.
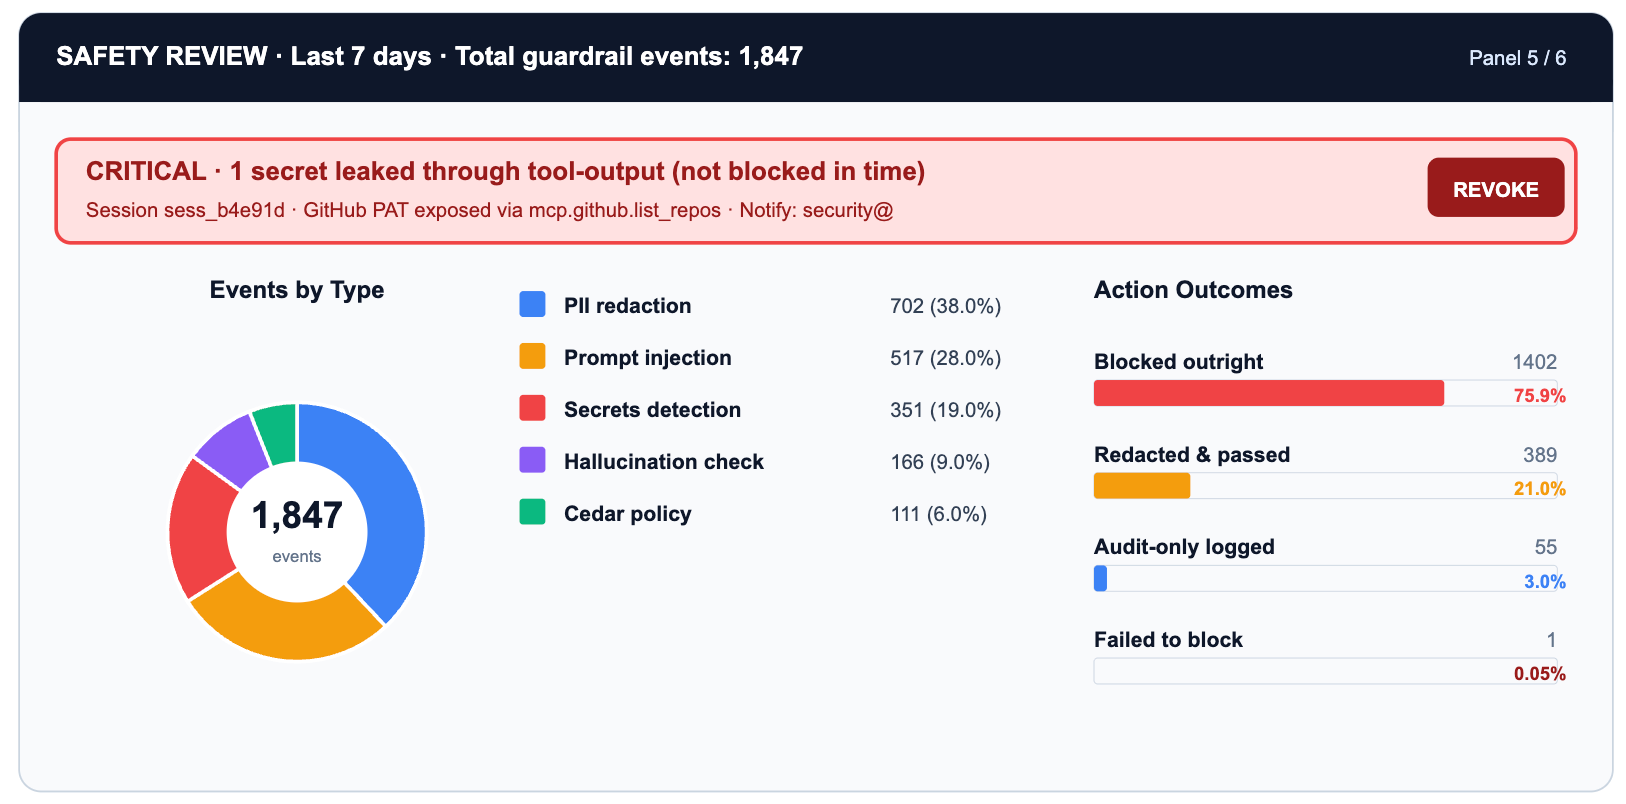
The one leaked secret in the secrets-scan row is the cell that warrants immediate action. Everything else is informational: useful for tuning guardrail sensitivity, distinguishing signal from noise, and demonstrating compliance posture to auditors.
TrueFoundry's four-hook guardrail model (request-input, request-output, tool-input, tool-output) means each event row maps to a specific interception point in the request lifecycle. PII detection at request-input catches user data before it reaches the model. Secrets scanning at tool-output catches credentials before they reach downstream systems.
→ Guardrails Overview — four hooks, threat surface decomposition
→ PII/PHI Detection — redaction modes and hook placement
→ Secrets Detection — validate vs mutate mode
This is the hardest panel to build and the most important one to have. All five preceding panels describe AI usage. This one answers whether the usage produced anything.
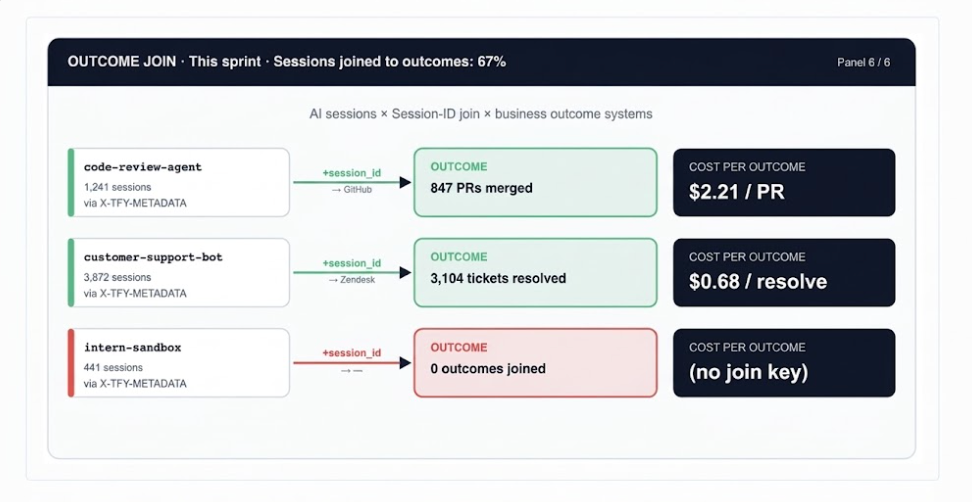
The join key is the session_id field in X-TFY-METADATA, propagated by TrueFoundry through every request in a multi-turn agent session. When the same session ID appears in your GitHub webhook payload or Zendesk metadata, you can close the loop: this session cost $2.21 and produced a merged code-review PR.
→ Analytics — session-level cost and usage views
The six panels draw from three distinct metric layers. The most common dashboard mistake is mixing them: an executive view should not show retry counts, and an on-call view should not show eval pass rates.
Once the three layers are in place, the temptation is to roll them into a per-engineer score and post a ranking. Resist it. The function below is explicitly diagnostic: a tool for finding workflow patterns that deserve investment, redesign, or new guardrails. Aggregate by workflow_tag, not by user_id.
# ai_leverage_score.py
# Per SESSION, not per engineer. Aggregate by workflow_tag.

def ai_leverage_score(session: dict) -> float:
    # OUTCOME SIGNALS (weighted heaviest)
    outcome_score = (
        session.get('incidents_resolved', 0) * 25 +
        session.get('prs_merged', 0)          * 15 +
        session.get('tickets_closed', 0)      * 10 +
        session.get('eval_pass_rate', 0)      * 20   # float 0.0-1.0
    )

    # GOVERNANCE HITS (small penalty: information, not moral failing)
    governance_penalty = (
        session.get('budget_limit_hits', 0) * 2 +
        session.get('rate_limit_hits', 0)   * 1 +
        session.get('guardrail_blocks', 0)  * 3
    )

    # WASTE SIGNALS (penalise shape, not raw volume)
    retry_tokens  = session.get('retry_token_count', 0)
    context_waste = session.get('unused_context_ratio', 0.0)
    loop_flag     = 1 if session.get('tokens_per_hr', 0) > 3 * session.get('p95_baseline', 1) else 0
    waste_penalty = (retry_tokens / 10000) + (context_waste * 10) + (loop_flag * 15)

    # COST DAMPENER (sub-linear: expensive sessions aren't punished)
    cost_usd     = session.get('total_cost_usd', 0.01)
    cost_dampener = cost_usd ** 0.4

    raw = (outcome_score - governance_penalty - waste_penalty) / max(cost_dampener, 0.01)
    return max(0.0, min(100.0, raw))

# Weekly report: top-10 workflow PATTERNS, not top-10 humans
# df.groupby('workflow_tag')['score'].mean().nlargest(10)Dashboards do not run organizations. Rituals do. The minimum viable operating cadence for governed AI usage:
Every alert should map to a runbook step, not just a pager event. The YAML below defines the minimum-viable alert rule set for the control room, running against TrueFoundry's OTEL export:
# tfy-ai-alerts.yaml   |   tfy apply -f tfy-ai-alerts.yaml

alerts:
  - name: runaway_agent
    query: rate(tfy_gateway_tokens_total[5m]) > 3 * quantile(0.95, rate(tfy_gateway_tokens_total[7d]))
    labels: {severity: critical, team: platform}
    runbook: |
      1. Identify session_id from alert labels
      2. Check the workflow_tag field in the request's X-TFY-METADATA for owning team
      3. Confirmed loop: PUT /gateway/sessions/{id}/kill
      4. File incident linked to TFY session trace

  - name: budget_near_ceiling
    query: tfy_budget_used_pct{scope='project'} > 90
    labels: {severity: warning, team: finance-ops}
    runbook: |
      1. Notify project owner (#ai-budget-alerts)
      2. Review premium-model panel for quick routing wins
      3. Raise ceiling or enable fallback-to-cheaper-model policy

  - name: secret_leaked
    query: increase(tfy_guardrail_events_total{type='secret',action='allowed'}[1h]) > 0
    labels: {severity: critical, team: security}
    runbook: |
      1. Pull trace from TFY Analytics for the request
      2. Identify secret type and downstream model/tool
      3. Rotate credential immediately
      4. Switch secrets guardrail from validate to mutate mode

  - name: untagged_spend_spike
    query: sum(tfy_cost_usd_total{project='UNTAGGED'}) > 50
    labels: {severity: warning, team: platform}
    runbook: |
      1. Find callers via the user_id metadata field in Analytics
      2. Require a project field in X-TFY-METADATA via gateway config
      3. Block untagged traffic after 30-day grace period
Check the workflow_tag field in the request's X-TFY-METADATA for owning team
Check the workflow_tag field in the request's X-TFY-METADATA for owning team
→ tfy apply — GitOps-style alert and policy deployment
→ Export OpenTelemetry Data — OTEL metric endpoints
Before declaring your AI control room operational, verify these eight conditions. Each maps to a specific TrueFoundry capability:
The Tokenmaxxing Trilogy has built up a three-layer argument. Each layer is necessary; none is sufficient alone.
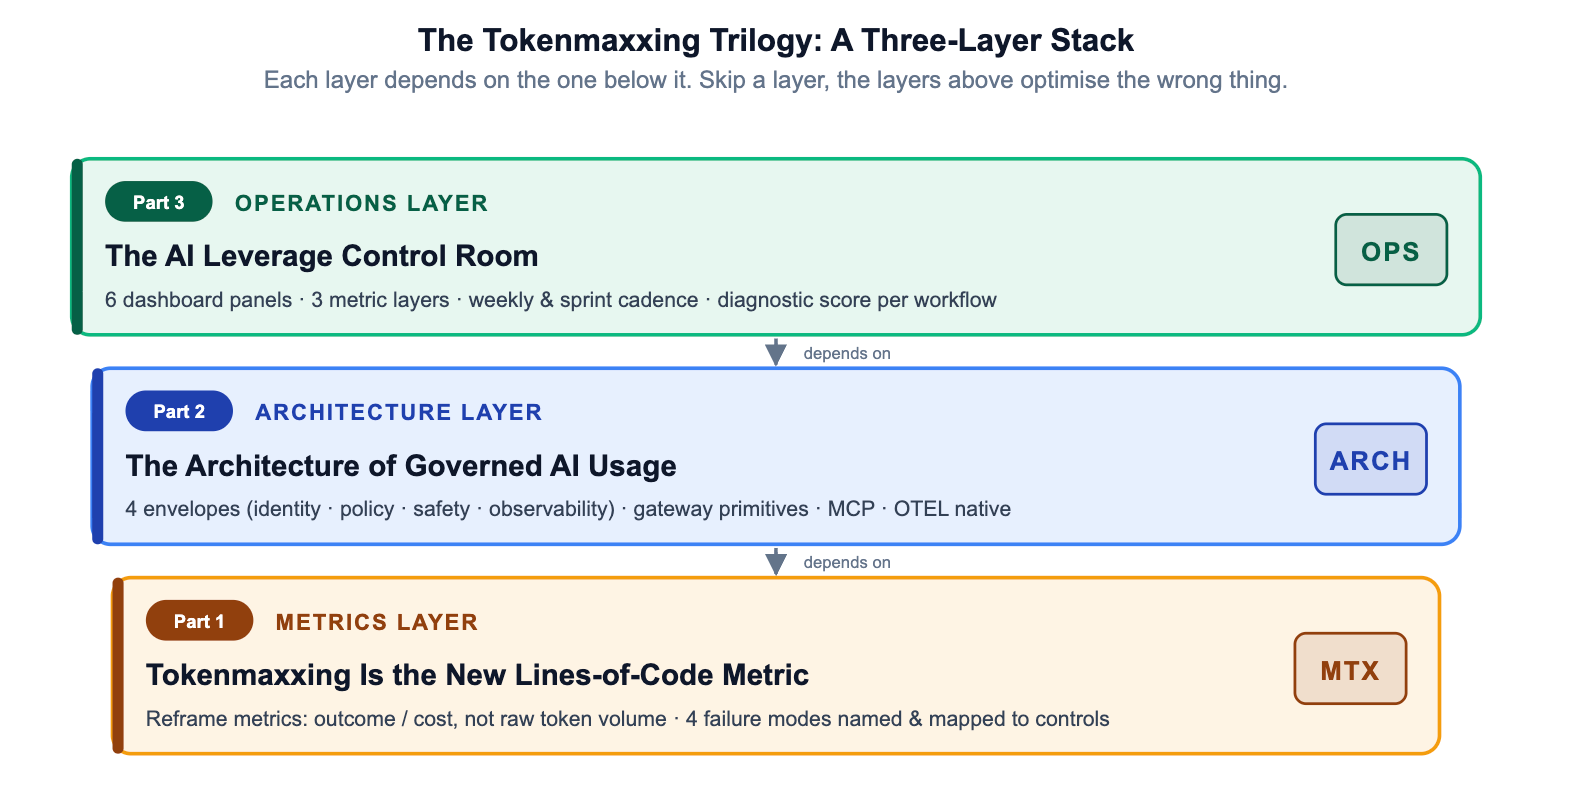
Organizations that stop at Layer 1 have a narrative but no enforcement. Those that stop at Layer 2 have enforcement but no feedback loop. The control room closes the loop — making governed AI usage not a compliance posture but an operational discipline that compounds over time.
TrueFoundry AI Gateway delivers ~3–4 ms latency, handles 350+ RPS on 1 vCPU, scales horizontally with ease, and is production-ready, while LiteLLM suffers from high latency, struggles beyond moderate RPS, lacks built-in scaling, and is best for light or prototype workloads.


The latest news, articles, and resources sent to your inbox
© 2026 All rights reserved.


.webp)