November 8, 2026
|
5 min read


Blazingly fast way to build, track and deploy your models!
Most teams evaluating an AI gateway start from the same fear: "If I put a proxy in front of every model call, I am adding a hop, and that hop costs latency." It is a reasonable instinct and a bad reason to skip the gateway. The instinct is wrong about magnitude. A model call to a frontier LLM takes anywhere from 300 milliseconds for a short completion to 20 seconds or more for a long reasoning response. A competently built gateway adds low-single-digit to low-double-digit milliseconds of its own processing on top of that. The question is never "does the gateway add latency" (it does, trivially) but "can I measure the overhead precisely, and does it stay small at the tail and under load."
The problem is that almost nobody benchmarks this correctly. Teams run a loop of 100 requests through the gateway, look at the average wall-clock time, compare it to 100 direct calls, and conclude something about "performance" that is dominated by provider variance and network jitter. The signal they care about, the gateway's own contribution, is buried inside seconds of model time and never isolated.
This post is a vendor-neutral method for benchmarking an AI gateway properly: which metrics matter, how to isolate gateway overhead from provider latency, how to test at the tail and under load, how to handle streaming and caching, and what "good" looks like. Every numeric example here is an illustrative template, not a measured result. You should fill the tables with numbers from your own runs.
Want to measure real gateway overhead against your own traffic? Book a demo.
An AI gateway sits on the request path between your application and one or more model providers. In the TrueFoundry case it is a unified, OpenAI-compatible API that handles routing, fallback and retries, exact and semantic caching, budgets and rate limits, guardrails, and per-request observability. Each of those features does work, and work takes time. Benchmarking is the discipline of attributing time to the right place.
A single non-streaming request has a latency budget that looks like this:
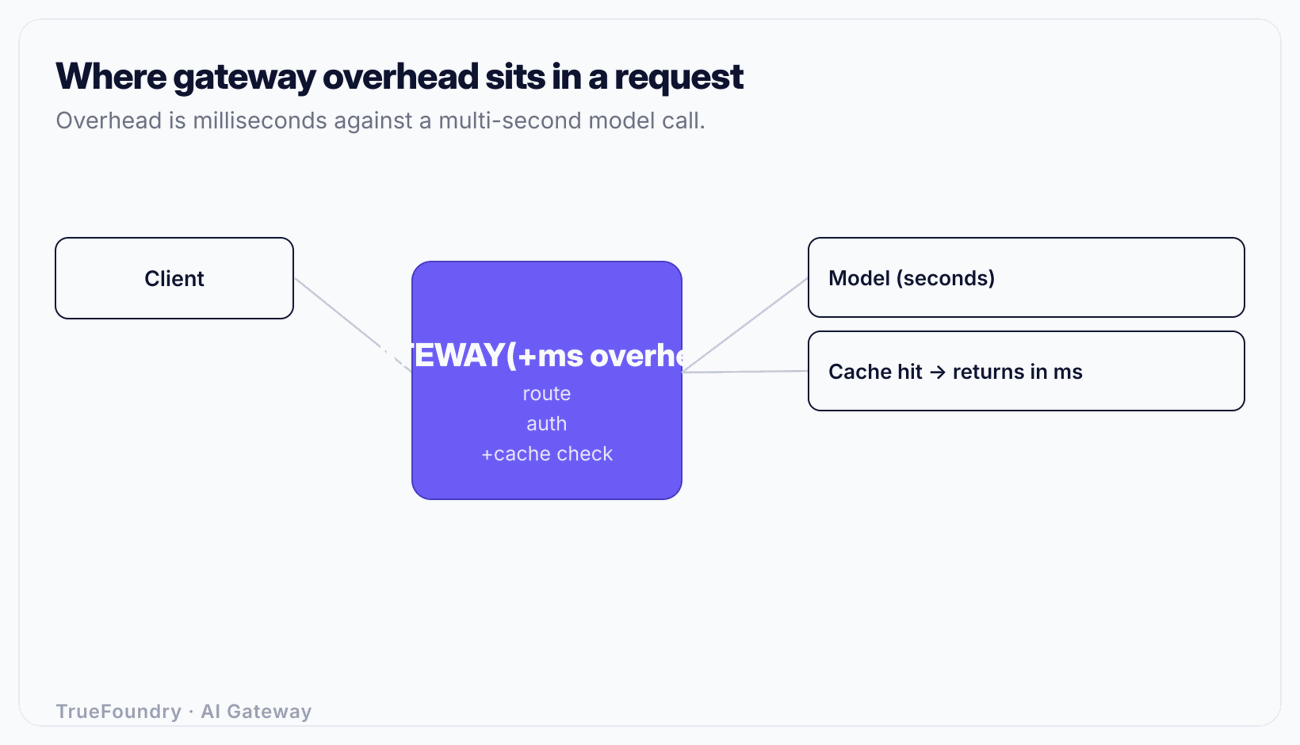
Break the wall-clock time of one request into four parts:
The headline benchmark metric is added latency: (2) plus (4), isolated from (1) and (3). If your tool only reports end-to-end time, you are measuring the provider, not the gateway.
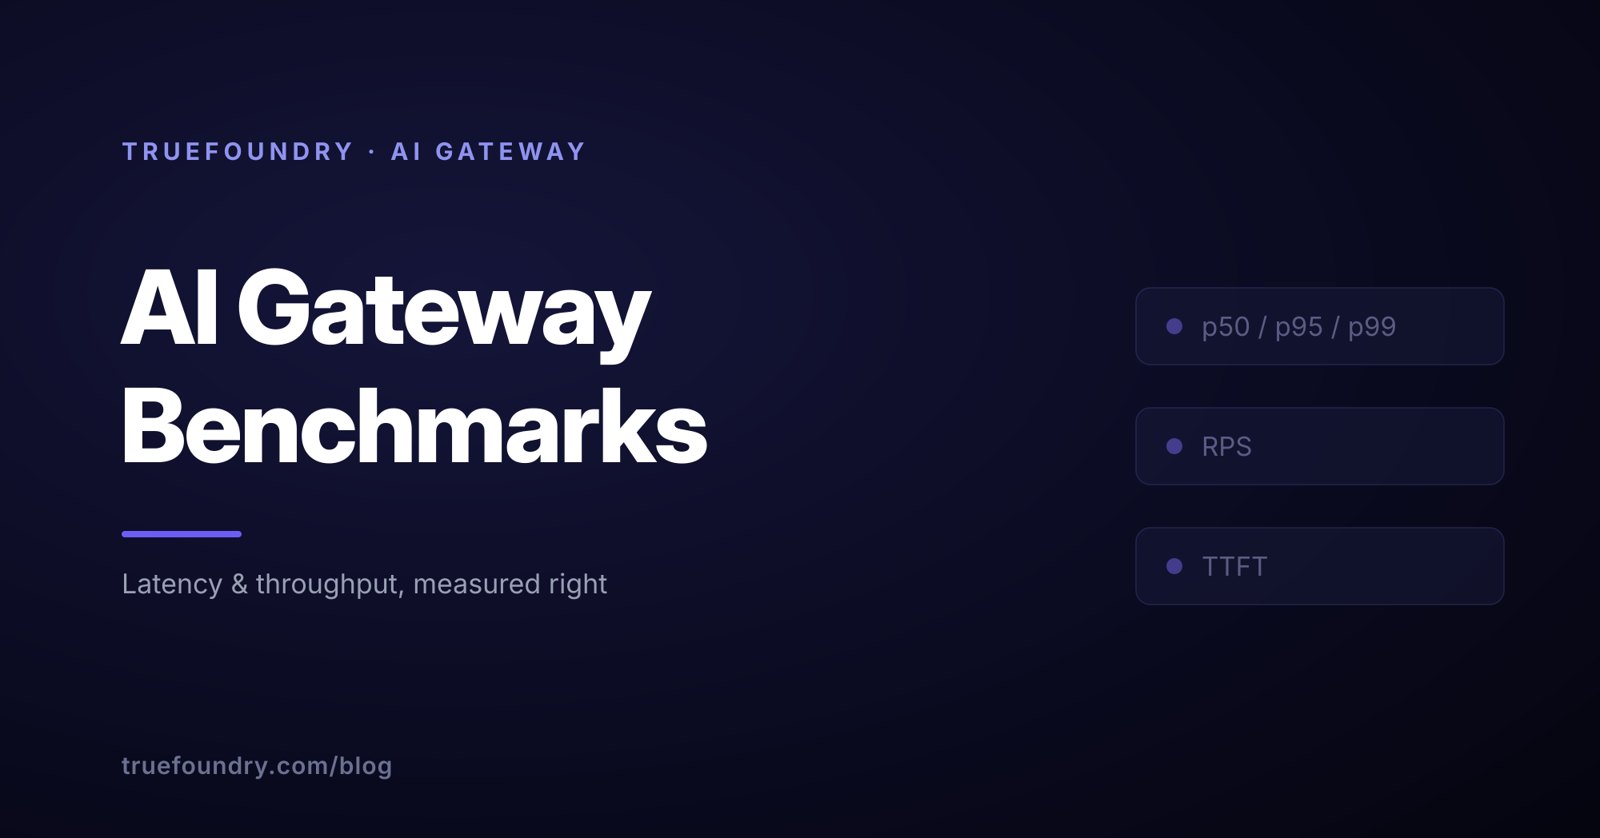
Six numbers describe a gateway's performance. Record all six; a single average is not a benchmark.
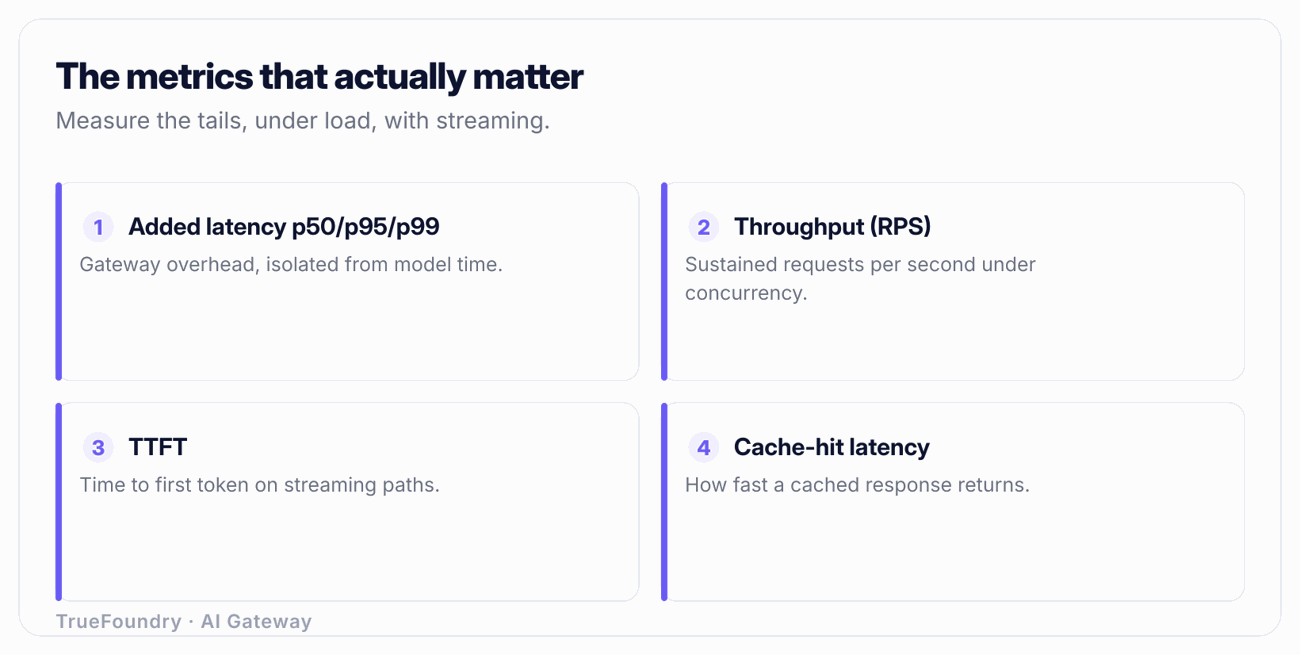
| Metric | Why it matters | How to measure |
|---|---|---|
| Added latency p50 | The typical overhead a request pays. Useful as a floor, misleading as a summary. | Subtract a direct-to-provider baseline from the through-gateway time, request by request, then take the median. Better: have the gateway emit its own internal processing time per request. |
| Added latency p95 / p99 | Where contention, pool exhaustion, and GC pauses live. The tail decides whether retries and agent loops time out. | Same subtraction, but report the 95th and 99th percentile of the overhead distribution. Run enough requests (10,000+) that p99 is stable. |
| Throughput (RPS) | How many requests per second one gateway instance sustains before overhead climbs. Sets your horizontal-scaling math. | Ramp concurrency until p95 added latency crosses a threshold you set (for example 25 ms). The RPS at that knee is your usable throughput, not the absolute max. |
| Time to first token (TTFT) | For streaming responses, perceived latency is TTFT, not total time. A gateway that buffers the whole response before forwarding destroys this. | Measure the interval from request send to first streamed chunk received, through the gateway and direct, and compare. |
| Cache-hit latency | On an exact or semantic cache hit the model is skipped entirely, so the request is faster than a direct call. This is a feature, not overhead. | Prime the cache, then measure latency for requests that hit it. Report separately from cache-miss latency. |
| Overhead under load | Overhead at 5 RPS is meaningless if it triples at 500 RPS. Degradation shape is the real signal. | Plot p95 added latency against offered concurrency. A flat line until a sharp knee is healthy; a steadily rising line means you are already contended. |
The two tail metrics deserve emphasis. In an agentic workload, a single user action can fan out into 10 to 50 model calls across a reasoning loop. If each call has a 1-in-100 chance of hitting a slow p99 path, a 30-call loop hits that path roughly once every three or four user actions. The tail is not an edge case at agent scale; it is the common case.
The core methodological move is subtraction, and the trap is that provider latency is noisy, so a naive subtraction gives noisy overhead.
Option A: paired requests. For each test iteration, send the same request directly to the provider and through the gateway, as close together in time as possible, ideally interleaved. Subtract direct time from gateway time per pair. Pairing controls for provider load drifting during the test, because both halves of a pair see roughly the same provider conditions. Collect thousands of pairs, then take percentiles of the difference. This measures true added latency including the gateway's upstream call, but it is sensitive to provider jitter between the two halves of the pair.
Option B: gateway-internal timing. A good gateway records its own processing time per request, the interval between accepting the request and dispatching the upstream call, plus the response-side work. TrueFoundry's per-request observability exposes latency broken down this way, tagged by user, team, and model. This gives you the overhead directly, with no subtraction and no provider noise, and it is the number to trust when you have it. Validate it once against paired-request measurements, then rely on the internal metric for ongoing monitoring.
Option C: mock the provider. Point the gateway at a local stub that returns a canned response with a fixed, known delay (say 200 ms). Now provider time is a constant you chose, and everything above it is gateway overhead plus network. This is the cleanest way to stress the gateway's own code paths at high RPS without paying for or being rate-limited by a real provider, and the right tool for finding the throughput knee. It does not capture real provider behavior, so use it for overhead and throughput, not for end-to-end realism.
Use all three. Option C finds the throughput ceiling, Option A validates real-world added latency, and Option B gives you the number you will watch in production. For more on where the gateway sits relative to your application and why that placement governs latency, see control plane vs data plane and the broader framing in how to choose an AI gateway.
A benchmark run at concurrency 1 tells you the floor and nothing about production. Real gateways serve hundreds or thousands of concurrent in-flight requests, and the interesting behavior is how overhead degrades as concurrency rises.
Design the load test as a ramp. Start at low concurrency, hold, step up, hold, and keep stepping until p95 added latency crosses your threshold. At each step record p50, p95, p99 added latency and achieved RPS. The output is a curve, not a point. Three shapes are common:
Two load-generation details change the numbers more than people expect. First, use an open-loop load model where requests arrive on a schedule regardless of whether prior ones finished, not a closed-loop model where a fixed pool of workers waits for each response. Closed-loop testing hides queue buildup because slow responses throttle the offered load, flattering your tail numbers. Second, generate load from enough client connections that the client is not itself the bottleneck; a single client process with a small connection pool will report "gateway" latency that is really client-side queuing.
For chat and agent workloads, most responses stream. Streaming inverts which metric matters: the user perceives time to first token, and total time is almost irrelevant to perceived speed.
A correctly built gateway forwards streamed chunks as they arrive, adding only a small, constant per-chunk overhead. A badly built one buffers the entire upstream response, applies response processing, and only then begins streaming to the client, which turns a 3-second streamed response into a 3-second wait followed by an instant dump. The TTFT benchmark catches this immediately: measure the interval from sending the request to receiving the first byte of the first content chunk, both through the gateway and direct. The gateway's TTFT overhead should be close to its non-streaming overhead, a few milliseconds, not hundreds.
Response guardrails complicate this honestly. If you run an output guardrail that must inspect the full response (certain PII or policy checks), you cannot stream and scan the complete text at the same time without a design choice: stream optimistically and retract, or buffer and delay. Benchmark both modes if you use output guardrails, and report the TTFT cost of each. Do not let a vendor quote you a streaming TTFT measured with guardrails off and then run them on in production.
See how TrueFoundry keeps added latency in single-digit milliseconds. Book a demo.
You do not need to choose a gateway by its implementation language, but you should understand why language and architecture shape the throughput curve, because it tells you what to stress.
A gateway written on a single-threaded event loop handles enormous concurrency for I/O-bound work (waiting on the provider) but serializes any CPU-bound work on the hot path. If request parsing, token counting, or guardrail regex runs inline, those steps compete for the one thread and show up as rising p99 under load. A runtime with a global interpreter lock has a related constraint: even with a thread pool, CPU-bound sections do not run truly in parallel within one process, so you scale by running more processes, and your benchmark must account for per-process memory and connection-pool duplication. Compiled, multi-threaded runtimes (Go, Rust) parallelize CPU work across cores within one process, which usually pushes the throughput knee higher per instance, at the cost of a different operational profile.
The practical takeaway is not "Go beats Python." It is: identify what runs on the hot path and benchmark it under concurrency. Token counting a 100,000-token context, running a prompt-injection classifier, or computing a semantic-cache embedding are all CPU work. If they run inline, they will bend your tail curve. If they run off the hot path or behind a fast path, they will not. Test with representative prompt sizes, not 10-token toys, because context length drives the CPU cost of exactly these steps. The gateway's job as an LLM proxy is to keep that per-request work small and predictable.
The one scenario that flips the entire "gateways add latency" narrative is caching, and it is the scenario teams forget to benchmark.
TrueFoundry supports both exact caching (identical request returns the stored response) and semantic caching (a request whose embedding is within a cosine-similarity threshold of a prior request returns that response). On a hit, the model call never happens. The request's latency collapses from the model's hundreds-of-milliseconds-to-seconds down to the gateway's own lookup time: the embedding computation (for semantic) plus a vector or key lookup, typically single-digit to low-double-digit milliseconds.
Benchmark this as its own scenario:
A worked example, illustrative only: suppose a direct model call for your workload runs 1,200 ms at p50. An exact cache hit might return in 6 ms, and a semantic hit in 22 ms (dominated by the embedding step). At a 40 percent hit rate, the blended p50 is roughly 0.6 × 1,200 + 0.4 × 15 ≈ 726 ms, a 40 percent reduction in typical latency and a 40 percent reduction in token spend, both produced by the gateway. Reported as end-to-end average, the gateway looks dramatically faster than direct calls. This is why "the gateway adds latency" is the wrong headline: on cached traffic it subtracts latency. Fill in your own numbers; the structure holds regardless of the specifics.
Run this list before you trust any gateway latency claim, including your own.
The table below is a template to fill with your own runs. The numbers are placeholders that show the expected shape and order of magnitude, not measured results from any product. Replace every cell with figures you measured on your models, regions, and traffic.
| Scenario | p50 added latency | p95 added latency | p99 added latency | RPS at knee | Notes |
|---|---|---|---|---|---|
| Non-streaming, single provider, low load | fill (e.g. ~4 ms) | fill (e.g. ~9 ms) | fill (e.g. ~18 ms) | fill | Baseline overhead; isolate from model time |
| Non-streaming, at target concurrency | fill | fill | fill | fill (knee RPS) | Ramp until p95 crosses your threshold |
| Streaming, TTFT overhead | fill | fill | fill | fill | Measure to first content chunk, guardrails as in prod |
| Exact cache hit | fill (e.g. ~6 ms) | fill | fill | fill | Model skipped; faster than direct |
| Semantic cache hit | fill (e.g. ~22 ms) | fill | fill | fill | Embedding + vector search dominate |
| With output guardrail (buffered) | fill | fill | fill | fill | Report TTFT cost of buffering |
| Fallback path (primary forced to fail) | fill | fill | fill | fill | Includes failover detection + retry |
Treat any single row in isolation as meaningless. The value is in the comparison: cache-hit versus miss, streaming versus non-streaming, low load versus the knee.
They report end-to-end latency and call it gateway performance. The model dominates the wall clock, so the "benchmark" mostly measures the provider and the network. Isolate the overhead or you have measured nothing about the gateway.
They benchmark the mean and ship on it. p50 looks great and p99 times out their agent loops in production. At agent fan-out, the tail is the experience. Always report p95 and p99.
They test at concurrency 1. Overhead at a single in-flight request says nothing about behavior at 500. The degradation curve, and the knee in it, is the whole point. Ramp the load.
They forget to benchmark the cache. Caching is the one feature that makes the gateway faster than direct calls, and it is the scenario most often skipped. Measure hit latency and blended latency at your real hit rate, or you will understate the gateway's value by the entire caching benefit.
They trust a vendor's number without reproducing it. A latency figure on a slide was measured on someone else's model, region, prompt size, and guardrail configuration. Until you reproduce it on your traffic, it is marketing. Run the checklist yourself.
The fear that an AI gateway adds unacceptable latency survives because teams measure the wrong thing. End-to-end wall-clock time is dominated by the model, so it tells you almost nothing about the gateway. Isolate the overhead, report it at the tail, and the picture reverses: a competent gateway adds a few milliseconds to a request that already takes seconds, and on cached traffic it makes the request meaningfully faster while cutting token spend.
Benchmark it yourself. Use the checklist, fill the template with your own runs, ramp the concurrency to find the knee, and measure p99 and cache-hit latency as first-class metrics rather than afterthoughts. A gateway that passes that bar buys you routing, fallback, caching, budgets, guardrails, and per-request observability for a latency cost that rounds to nothing against the model, and the only way to prove that is to measure it on your traffic.
Benchmark a gateway that gets faster with caching on. Book a demo.
TrueFoundry AI Gateway delivers ~3–4 ms latency, handles 350+ RPS on 1 vCPU, scales horizontally with ease, and is production-ready, while LiteLLM suffers from high latency, struggles beyond moderate RPS, lacks built-in scaling, and is best for light or prototype workloads.


A well-built gateway adds single-digit to low-double-digit milliseconds of its own processing per request, against model calls that take hundreds of milliseconds to several seconds. The overhead is real but small relative to model time, and on cached requests the gateway is faster than a direct call because it skips the model entirely. The only trustworthy figure is one you measure yourself, isolated from provider time.
Gateway overhead is the time the gateway spends on its own work (auth, routing, budget and rate-limit checks, guardrails, serialization, logging), separate from network transit and model generation. Measure it by paired requests (same call direct and through the gateway, subtract per pair), by the gateway's own per-request internal timing, or by pointing the gateway at a mock provider with a fixed delay so everything above that delay is overhead.
Agentic workloads fan one user action into many model calls, so a rare slow path at p99 is hit frequently across a loop. A 30-call loop with a 1-in-100 slow path hits it roughly once every three actions. The average hides this; p95 and p99 reveal whether your retries and loops will time out under load.
On a cache hit, semantic caching is still far faster than a model call. You pay the embedding computation plus a vector lookup, typically tens of milliseconds, instead of the model's hundreds of milliseconds to seconds. On a miss you pay the embedding cost on top of the normal path, so benchmark both hit and miss latency and weight them by your real hit rate.
Measure time to first token, the interval from sending the request to receiving the first content chunk, both through the gateway and direct. A gateway that forwards chunks as they arrive adds only a few milliseconds to TTFT; one that buffers the whole response before forwarding destroys perceived latency. Test with the same guardrail configuration you will run in production, since output guardrails that inspect the full response can force buffering.



The latest news, articles, and resources sent to your inbox