October 10, 2026
|
5 min read


Obtenha acesso instantâneo a um ambiente TrueFoundry ao vivo. Implante modelos, direcione o tráfego de LLM e explore a plataforma completa — seu sandbox estará pronto em segundos, sem necessidade de cartão de crédito.


Published: September 11, 2026
Blazingly fast way to build, track and deploy your models!
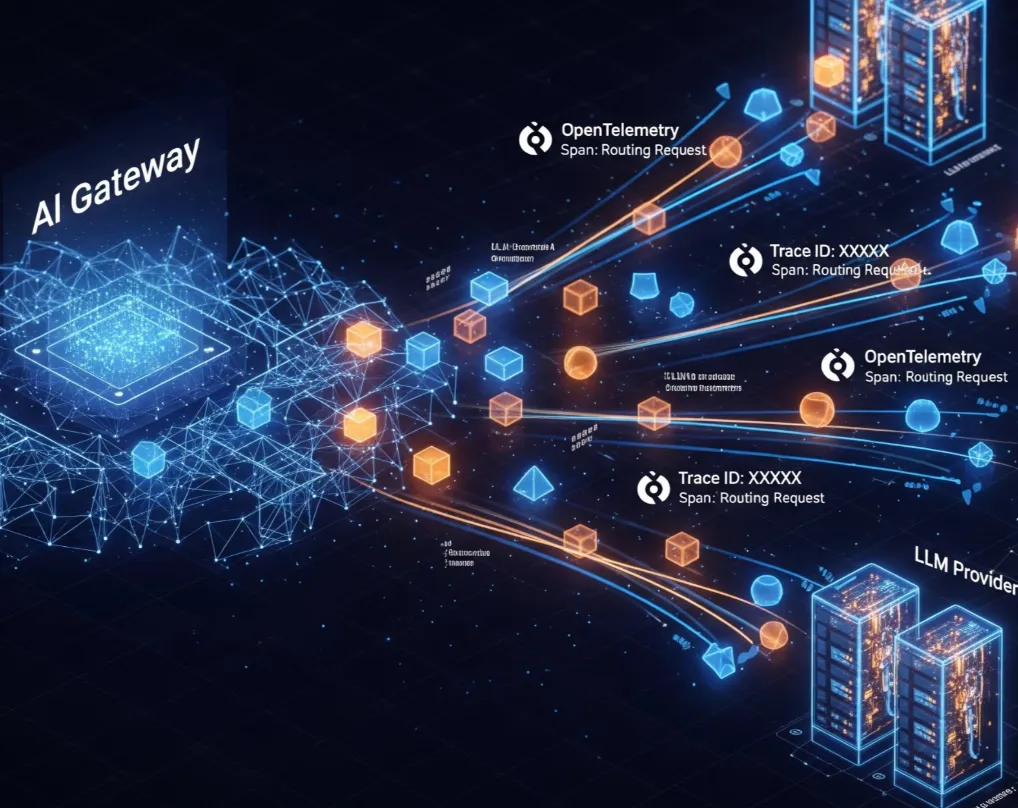
Instrumenting an AI gateway that proxies to twenty-plus providers is harder than standard OTel. We walk through the gen_ai.* semantic conventions, the gateway's span hierarchy (root, provider, guardrail), how fallback shows up in the trace tree, error normalization across Anthropic/OpenAI/Bedrock, per-trace cost attribution, propagation from application code, streaming and TTFT, and exporter configs for Datadog, Tempo, and Jaeger.
Wednesday 2:14 PM at Northwind. Cargo Copilot starts returning errors to twelve developers simultaneously. The on-call engineer opens the gateway dashboard. Within ninety seconds they know: 22% of Anthropic Sonnet 4 requests in the last five minutes returned 529 overloaded_error; the gateway fell back to Azure OpenAI gpt-5 on 78% of those, added 1.8 seconds of latency on the fallback path, and cost the company an extra $14 in retry-and-fallback over the window. The provider-A spans are red. The provider-B spans next to them are blue. The root spans are green. The on-call engineer closes the dashboard. Nothing else is required. That is what good LLM observability looks like.
This post is how to build that. We assume you already have OpenTelemetry running for your services; the question is how to extend it to the multi-provider AI gateway in front of them.
The OpenTelemetry GenAI semantic conventions define a standard vocabulary for instrumenting LLM calls under the gen_ai.* namespace. The conventions are still in Development status as of OTel semconv v1.36.0, which matters operationally: the attribute names have shifted recently, and most SDKs in the wild still emit the older variants.
Here is the shape of a real provider-span attribute set from a successful Anthropic Sonnet 4 call:
JSON — a provider span's attribute set on a successful call
{
  "name": "chat claude-sonnet-4",
  "kind": "CLIENT",
  "status": { "code": "OK" },
  "attributes": {
    "gen_ai.provider.name":        "anthropic",
    "gen_ai.operation.name":       "chat",
    "gen_ai.request.model":        "claude-sonnet-4-5",
    "gen_ai.response.model":       "claude-sonnet-4-5-20250929",
    "gen_ai.request.max_tokens":   2048,
    "gen_ai.request.temperature":  0.2,
    "gen_ai.usage.input_tokens":   2341,
    "gen_ai.usage.output_tokens":  187,
    "gen_ai.usage.cache_read.input_tokens":     1820,
    "gen_ai.usage.cache_creation.input_tokens": 0,
    "gen_ai.usage.cost_usd":       0.0287,
    "server.address":              "api.anthropic.com"
  }
}
Three details worth noting. gen_ai.request.model is what the client asked for; gen_ai.response.model is what the provider actually served (which can differ — claude-sonnet-4 is an alias that resolves to a dated version). Token counts include cached tokens by spec: gen_ai.usage.input_tokens is the total, with the cached portion broken out separately. And gen_ai.usage.cost_usd is a TrueFoundry-emitted attribute layered on top of the standard semconv — the spec covers tokens, but cost calculation is a gateway responsibility (see §5).
Every inbound request to the gateway produces one root span. That root span has children for each piece of work the gateway does: input guardrails, the outbound provider call, output guardrails. If a fallback fires, you get a second provider span under the same root (see §3).
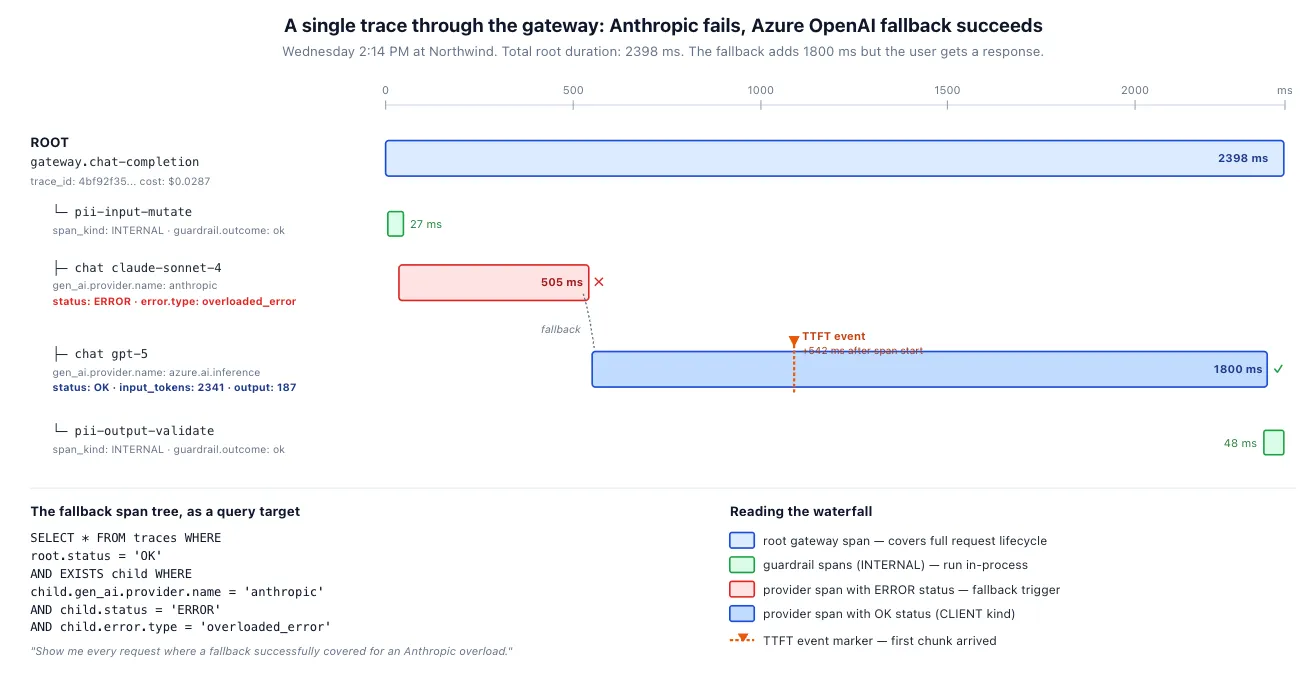
The span-kind conventions matter. Per the OpenTelemetry GenAI spec, external provider calls are CLIENT spans. Guardrail spans — PII redaction, schema validation, anything running in the gateway process — are INTERNAL. The root span itself is SERVER (the gateway is the server from the client's perspective).
Span names follow the prescribed format: {operation} {model} for inference spans (so chat claude-sonnet-4, not claude-sonnet-4-call or LLM call), and a free-form name for the root and guardrail spans. Consistency at this layer is what makes dashboards portable across teams.
A fallback is not a separate concept in OTel; it's just a second sibling span. When Anthropic returns 529 and the gateway routes to Azure OpenAI, the trace shows two CLIENT provider spans under the same SERVER root. The first has status ERROR with the error attribute; the second has status OK. The root's status reflects what the client got, which is OK if the fallback succeeded.
This composition makes fallbacks queryable. In Tempo or Jaeger, "show me every successful request where a fallback covered for an Anthropic overload" is a query against the trace tree:
Querying the fallback pattern across observability backends
# TraceQL (Grafana Tempo) — root succeeded but had at least one provider failure
{ status = ok }
  && { gen_ai.provider.name = "anthropic" && status = error
       && error.type = "overloaded_error" }

# Or in Datadog / Honeycomb, equivalent filter:
#   root.status:ok
#   AND any-child(gen_ai.provider.name:anthropic AND status:error
#                AND error.type:overloaded_error)
The query is useful operationally: when an upstream provider has a bad afternoon, the same query gives you the fallback hit rate, the added latency, and the total cost impact — grouped by team, model, or time window, providing deeper LLM observability. The trace structure does the work.
Every LLM provider has its own error format. The gateway's job is to normalize them into a small, consistent vocabulary that dashboards and alerts can rely on, while preserving the raw provider details for forensics.
The principle: a small set of normalized error.type values (RATE_LIMITED, QUOTA_EXCEEDED, OVERLOADED, PROVIDER_UNAVAILABLE, TIMEOUT, INVALID_REQUEST, CONTENT_FILTERED) drives cross-provider dashboards and alerting rules. The provider-specific attribute (gen_ai.anthropic.error_type, gen_ai.openai.error_code) stays attached for forensics. Low cardinality on the normalized field; high cardinality on the raw field. Both matter.
Cost is a derived attribute, not a provider-emitted one. The gateway calculates it at the end of each provider span using the usage tokens reported by the provider and a pricing table the gateway maintains.
Python — cost formula stored as gen_ai.usage.cost_usd on each provider span
# Compute per-span cost in USD, including prompt-cache pricing
def compute_cost_usd(span_attrs: dict, pricing: dict) -> float:
    """
    pricing keys are USD per million tokens, e.g. Anthropic Sonnet:
       {"input": 3.00, "cached_input": 0.30, "cache_write": 3.75, "output": 15.00}
    Anthropic charges a 25% premium on cache writes and 90% off on reads;
    OpenAI charges 50% off on reads with no separate write line.
    """
    input_tokens   = span_attrs.get("gen_ai.usage.input_tokens", 0)
    output_tokens  = span_attrs.get("gen_ai.usage.output_tokens", 0)
    cache_read     = span_attrs.get("gen_ai.usage.cache_read.input_tokens", 0)
    cache_write    = span_attrs.get("gen_ai.usage.cache_creation.input_tokens", 0)

    # Per spec, gen_ai.usage.input_tokens INCLUDES both cache_read and
    # cache_creation tokens. Subtract both before applying the regular input
    # rate, or you'll double-count the cached portions in the next three lines.
    fresh_input = max(input_tokens - cache_read - cache_write, 0)

    cost = (
        fresh_input   * pricing["input"]        / 1_000_000 +
        cache_read    * pricing["cached_input"] / 1_000_000 +
        cache_write   * pricing["cache_write"]  / 1_000_000 +
        output_tokens * pricing["output"]       / 1_000_000
    )
    return round(cost, 6)
Two subtleties matter at scale. First, the spec says gen_ai.usage.input_tokens already includes both cache_read.input_tokens and cache_creation.input_tokens. If you bill the full input_tokens at the regular input rate and then add the per-cache lines on top, you overcharge by the cache-read portion and double-count the cache-write portion. Subtract both before applying the input rate. Second, fallback costs add: when Anthropic fails and the gateway calls Azure OpenAI, you may still be billed for the partial Anthropic request (input tokens were sent even if no output came back). Both provider spans should carry a cost_usd, and the root span sums them. The sum is the real trace cost.
Aggregations follow from there: cost by team (tag spans with caller identity), cost by model, cost by feature (tag with a service.* attribute the application sets), cost by trace tag (e.g., "support-ticket" vs "code-generation"). The OTel side is straightforward; the work is keeping pricing tables current.
For a gateway trace to be useful, it has to connect to the application trace upstream of it. OpenTelemetry uses the W3C Trace Context specification: a traceparent HTTP header that carries the trace ID and the parent span ID across service boundaries. The gateway reads this header on inbound requests and emits its own spans as children of the application's span.
In Python with the OpenAI SDK pointed at the gateway, the propagation looks like this:
Python — application sets traceparent; gateway continues the trace
from openai import OpenAI
from opentelemetry import trace
from opentelemetry.instrumentation.openai_v2 import OpenAIInstrumentor

# Auto-instrument the OpenAI SDK — it will set gen_ai.* attributes
# and inject traceparent into outbound HTTP requests automatically.
OpenAIInstrumentor().instrument()

tracer = trace.get_tracer("cargo-copilot")

client = OpenAI(
    base_url="https://gateway.northwind.internal/llm/v1",  # TrueFoundry gateway
    api_key=os.environ["TFY_API_KEY"],
)

with tracer.start_as_current_span("draft_customer_reply") as span:
    span.set_attribute("northwind.team",     "support-engineering")
    span.set_attribute("northwind.feature",  "escalation-draft")

    # The OpenAI SDK call below will:
    #   1. inherit this span as parent
    #   2. create a child gen_ai span automatically
    #   3. inject traceparent: <trace_id>-<span_id>-<flags> into the request
    response = client.chat.completions.create(
        model="claude-sonnet-4-5",   # gateway routes to Anthropic, or fallback
        messages=[{"role": "user", "content": "..."}]
    )
The application tags (northwind.team, northwind.feature) propagate down the tree because the gateway preserves baggage and any custom attributes on the parent span. That is how a single cost dashboard can answer "how much did the support team spend on escalation drafts last month" without the gateway needing to know anything about Northwind's team structure.
The LLM provider does not extend the trace — OpenAI, Anthropic, and Bedrock don't expose their internal trace IDs to clients. What you get is the gateway-side view of the provider call: time-to-first-byte, total duration, token counts. That is usually enough; when it isn't, you correlate by timestamp against the provider's own admin telemetry.
Streaming complicates span timing because the response is not a single point-in-time event — it's a sequence of chunks arriving over hundreds of milliseconds or more. The OTel GenAI spec accommodates this with dedicated metrics and a span-event pattern.
The relevant metrics, all required by the GenAI metrics spec: gen_ai.client.operation.duration (full request to last chunk), gen_ai.client.operation.time_to_first_chunk (the TTFT figure that matters most for perceived responsiveness), and gen_ai.client.operation.time_per_output_chunk (the inter-chunk gap). On the span itself, record TTFT as a span event:
Python — record TTFT as a span event while the stream is still open
from opentelemetry import trace
import time

tracer = trace.get_tracer("tfy-llm-gateway")

with tracer.start_as_current_span(
    "chat claude-sonnet-4-5",
    kind=trace.SpanKind.CLIENT,
    attributes={
        "gen_ai.provider.name":  "anthropic",
        "gen_ai.operation.name": "chat",
        "gen_ai.request.model":  "claude-sonnet-4-5",
    }
) as span:
    start = time.perf_counter()
    first_chunk_at = None

    async for chunk in provider_stream:
        if first_chunk_at is None:
            first_chunk_at = time.perf_counter()
            ttft_ms = (first_chunk_at - start) * 1000
            span.add_event(
                "gen_ai.choice",        # spec-defined event name
                attributes={"gen_ai.response.time_to_first_chunk_ms": ttft_ms}
            )
        yield chunk

    # When the stream closes, record final usage attributes.
    span.set_attribute("gen_ai.usage.input_tokens",  final_usage.input_tokens)
    span.set_attribute("gen_ai.usage.output_tokens", final_usage.output_tokens)
Two patterns matter operationally. The span stays open for the full stream — don't close it on TTFT, or you lose the rest of the timing. And token counts are recorded only when the stream closes, because most providers send the final usage block in the last chunk (Anthropic, OpenAI) or in a trailing message_stop event. A span exporter that flushes early sees zero output tokens, which makes cost attribution miss.
TrueFoundry's gateway emits OTel spans over OTLP/HTTP, decoupled from the request path via NATS so a backend outage cannot affect inference availability. The gateway tracing docs cover the integration paths. The exporter configuration is OTLP-standard — any compatible backend works.
Datadog has natively supported the GenAI semantic conventions since December 2025. Three intake paths: direct OTLP, Datadog Agent with OTLP ingest enabled, or the OpenTelemetry Collector (Datadog Distribution).
Datadog OTLP intake — environment variables
# Direct OTLP — set on the gateway pod
OTEL_EXPORTER_OTLP_PROTOCOL=http/protobuf
OTEL_EXPORTER_OTLP_ENDPOINT=https://trace.agent.datadoghq.com/api/v0.2/traces
OTEL_EXPORTER_OTLP_HEADERS=DD-API-KEY=$DATADOG_API_KEY
OTEL_RESOURCE_ATTRIBUTES=service.name=tfy-llm-gateway,deployment.environment=prod
Grafana Tempo — gRPC OTLP exporter
OTEL_EXPORTER_OTLP_PROTOCOL=grpc
OTEL_EXPORTER_OTLP_ENDPOINT=http://tempo.observability.svc.cluster.local:4317
OTEL_RESOURCE_ATTRIBUTES=service.name=tfy-llm-gateway,deployment.environment=prod

# Then query in Grafana with TraceQL:
# { gen_ai.provider.name = "anthropic" && status = error }
Jaeger — OTLP gRPC
# Jaeger 1.35+ accepts OTLP natively on the same ports.
OTEL_EXPORTER_OTLP_PROTOCOL=grpc
OTEL_EXPORTER_OTLP_ENDPOINT=http://jaeger-collector.observability.svc.cluster.local:4317
OTEL_RESOURCE_ATTRIBUTES=service.name=tfy-llm-gateway100% sampling is fine for development and the first month in production. As volume grows, the rule of thumb: head-based sampling (probability of, say, 0.1) for the high-volume happy path; tail-based sampling at the collector tier to keep 100% of error traces and slow traces regardless of the head rate. The combination gives you a manageable storage cost without losing the data that matters when something breaks.
For high-cardinality attributes (per-user identifiers, request IDs, full prompt content), prefer events or logs over span attributes — OTel attribute cardinality budgets are real, and a 10K-character prompt as a span attribute is a path to expensive surprise.
Bring your own. The gateway emits OTLP-standard data to any compatible backend. TrueFoundry has documented integrations with Datadog, Honeycomb, Middleware, LangSmith, and Grafana Tempo. The TF-hosted collector is a convenience, not a lock-in.
By default, no. The current spec deprecates gen_ai.prompt and gen_ai.completion attributes in favor of gen_ai.input.messages and gen_ai.output.messages, recorded as events (not span attributes) when content capture is enabled. Even then, capture is opt-in: prompts can contain PII and large prompts blow up span sizes. Capture for sampled traces, not all of them.
The GenAI spec covers agent spans separately: create_agent, invoke_agent, execute_tool. MCP tool executions specifically can be traced by the MCP instrumentation. The gateway captures everything at its boundary; the application captures everything inside its boundary; the trace context binds them. The result is a single waterfall covering the agent loop end-to-end, with tool calls as INTERNAL spans and provider calls as CLIENT spans.
Tag the root span with whichever attribute identifies the owner: northwind.team, northwind.cost_center, gen_ai.agent.name, or all three. Cost is then aggregated by tag in the backend. The application is responsible for setting the tag; the gateway preserves and propagates it. The same scheme handles per-feature and per-customer attribution.
Mostly yes, with version awareness. The spec is in Development, which means breaking changes are still possible — the recent rename of gen_ai.system to gen_ai.provider.name is exactly such a change. The mitigation is the OTEL_SEMCONV_STABILITY_OPT_IN environment variable, which lets instrumentation libraries opt in to the latest experimental attributes without breaking older consumers. Set this consciously when upgrading; don't rely on defaults staying the same.
The TrueFoundry AI Gateway emits OTel-compliant traces for every request, with the span hierarchy described above and the gen_ai.* attributes set per the current spec. Trace export is asynchronous (via NATS) so observability backends cannot affect inference availability. The gateway also runs the cost calculation, error normalization, and fallback span tree construction described in §§5, 4, and 3 respectively. The bring-your-own-backend integrations are first-class: any OTLP-compatible destination works.
If your LLM workload is running blind today, the highest-leverage first step is exporting OTel from wherever your gateway already runs to any OTLP-compatible backend. A weekend exercise; the dashboards are the easy part once the spans are flowing.
Start here: TrueFoundry tracing documentation. Or book an observability architecture review with our team.
Citations are linked inline throughout. The list below collects all URLs for printability and link-rot insurance.
Note: Northwind Logistics is a fictional company used to ground the design in a concrete deployment. The Wednesday 2:14 PM trace in §2 is constructed to illustrate the span tree; real production traces vary in timing and which provider is up. The OTel GenAI semantic conventions are still in Development status as of OTel semconv v1.36.0 — attribute names may continue to evolve.
TrueFoundry AI Gateway delivers ~3–4 ms latency, handles 350+ RPS on 1 vCPU, scales horizontally with ease, and is production-ready, while LiteLLM suffers from high latency, struggles beyond moderate RPS, lacks built-in scaling, and is best for light or prototype workloads.



As últimas notícias, artigos e recursos enviados para sua caixa de entrada
.webp)

.png)
.png)
.png)
.png)
.png)
.png)