


Erhalten Sie sofortigen Zugriff auf eine TrueFoundry-Live-Umgebung. Stellen Sie Modelle bereit, leiten Sie den LLM-Verkehr weiter und erkunden Sie die gesamte Plattform — Ihre Sandbox ist in Sekundenschnelle einsatzbereit, ohne dass eine Kreditkarte erforderlich ist.


What Is LLM Observability and How Does It Work?

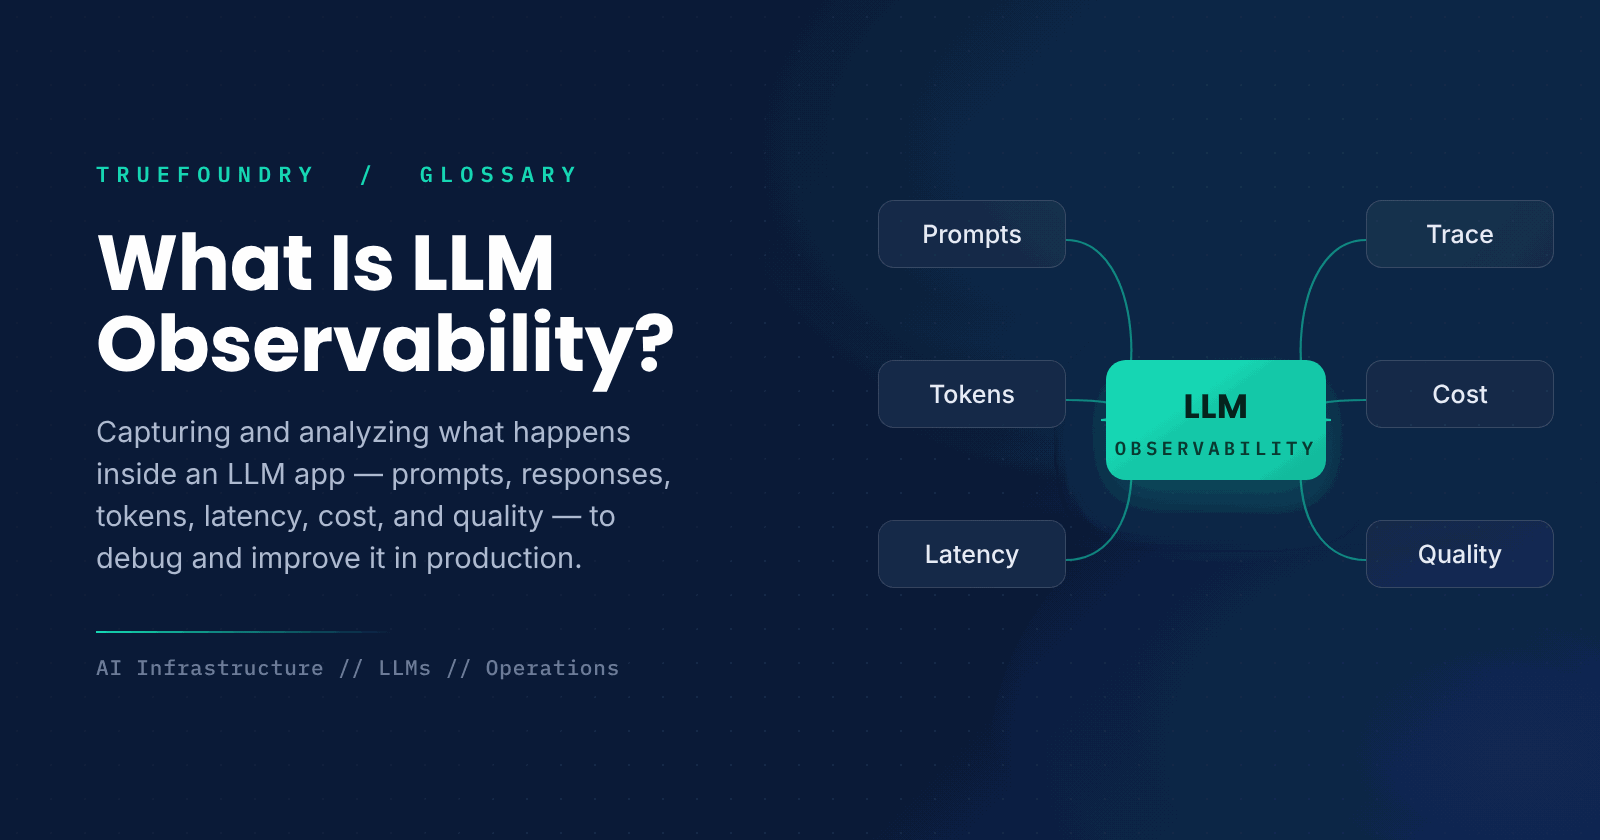
When a normal web service misbehaves, you check the logs and metrics. When an LLM application misbehaves, the question is harder: what exactly did the model see, what did it say, how many tokens did it burn, and was the answer any good? Answering that in production requires capturing the inside of each request. That is LLM observability.
An LLM app is more than code; its behavior depends on prompts, context, model responses, and often tool calls, all of which vary from request to request. Observability makes that behavior visible, so you can debug a bad answer, track runaway cost, and watch quality over time instead of guessing.
This guide explains what LLM observability is, how it works, how it relates to traditional observability, and why it matters.
What is LLM observability?
LLM observability is the practice of instrumenting an LLM application to capture and analyze what happens inside it, including the prompts sent, the responses received, token usage, latency, cost, tool calls, and signals of output quality. It gives teams the visibility they need to understand and improve the system in production.
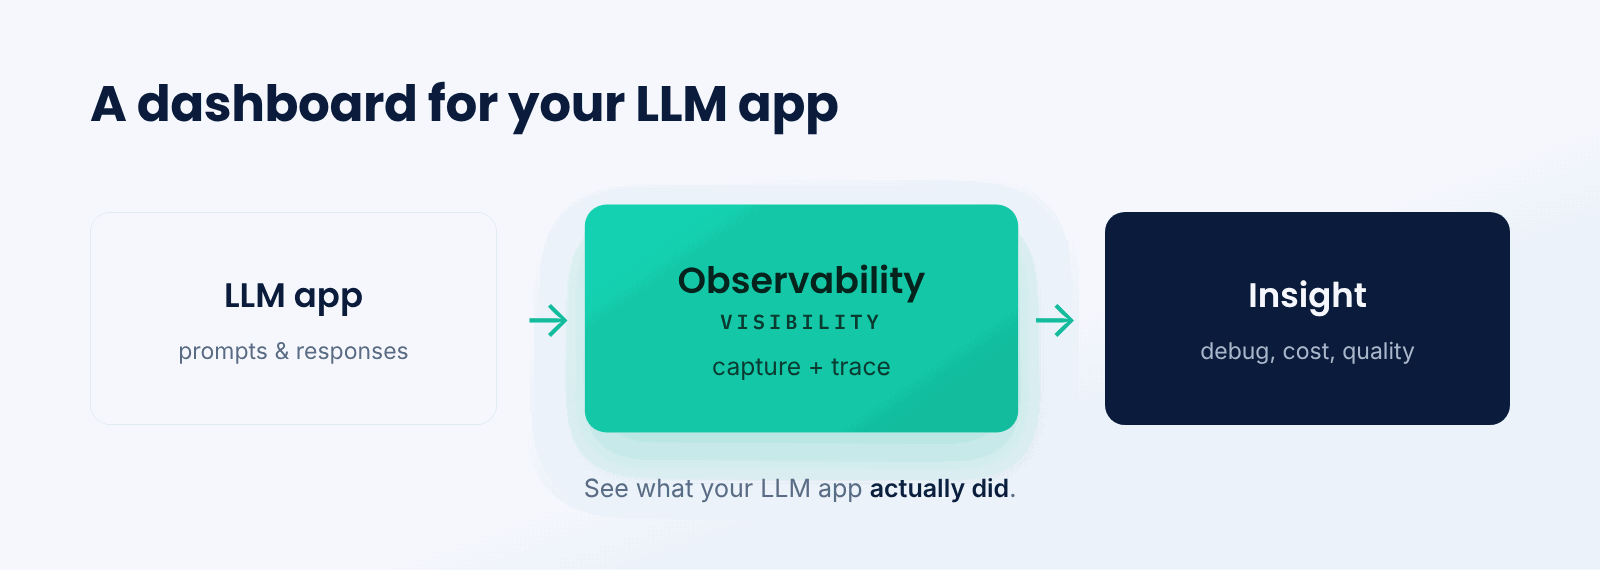
Think of it like the instrumentation in a car. Without a dashboard you are driving blind, with no idea of speed, fuel, or engine temperature. Observability is the dashboard for an LLM app, showing what is flowing through it and whether anything is going wrong, so you can react rather than guess.
The key idea is visibility into behavior. Because an LLM app's output depends on inputs you do not fully control, seeing exactly what happened on each request is what makes it operable.
How does LLM observability work?
Observability captures each request's details and links them so you can analyze and act.
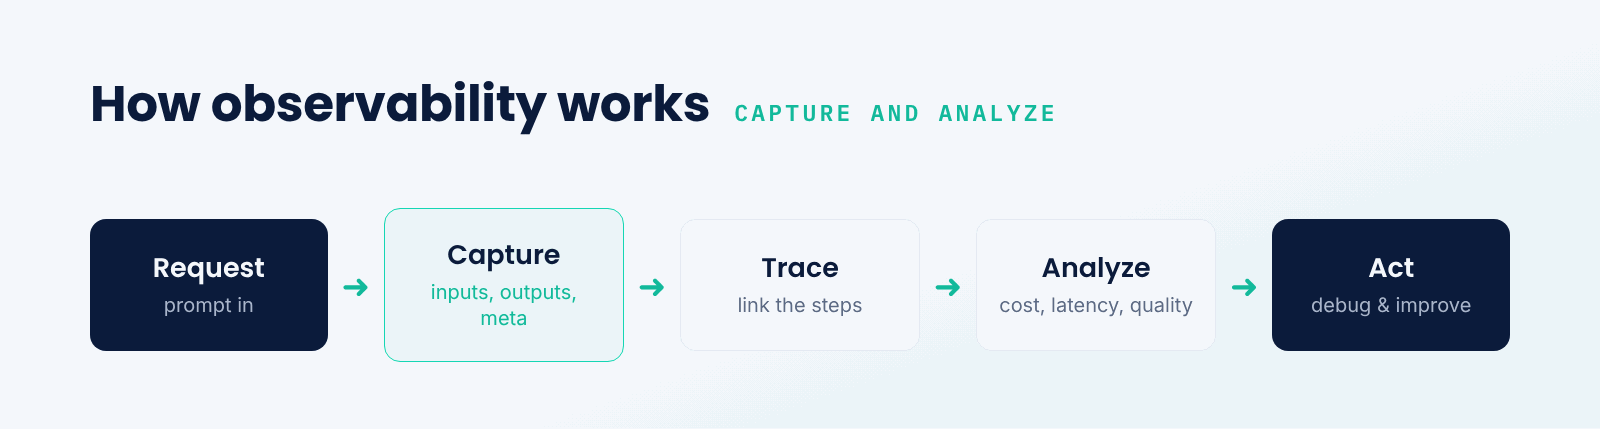
- A request runs. A prompt enters the LLM application and flows through its steps.
- Capture the details. The prompt, response, tokens, latency, cost, and metadata are recorded.
- Trace the steps. The parts of the request, including retrieval and tool calls, are linked into one trace.
- Analyze. The captured data is turned into metrics and views for cost, latency, errors, and quality.
- Act. Teams debug failures, optimize cost, and monitor quality, feeding fixes back into the system.
The trace is central: because a single LLM request may involve retrieval, multiple model calls, and tools, linking those steps is what lets you see why an answer came out the way it did, not just that it did.
Logs vs. metrics vs. traces
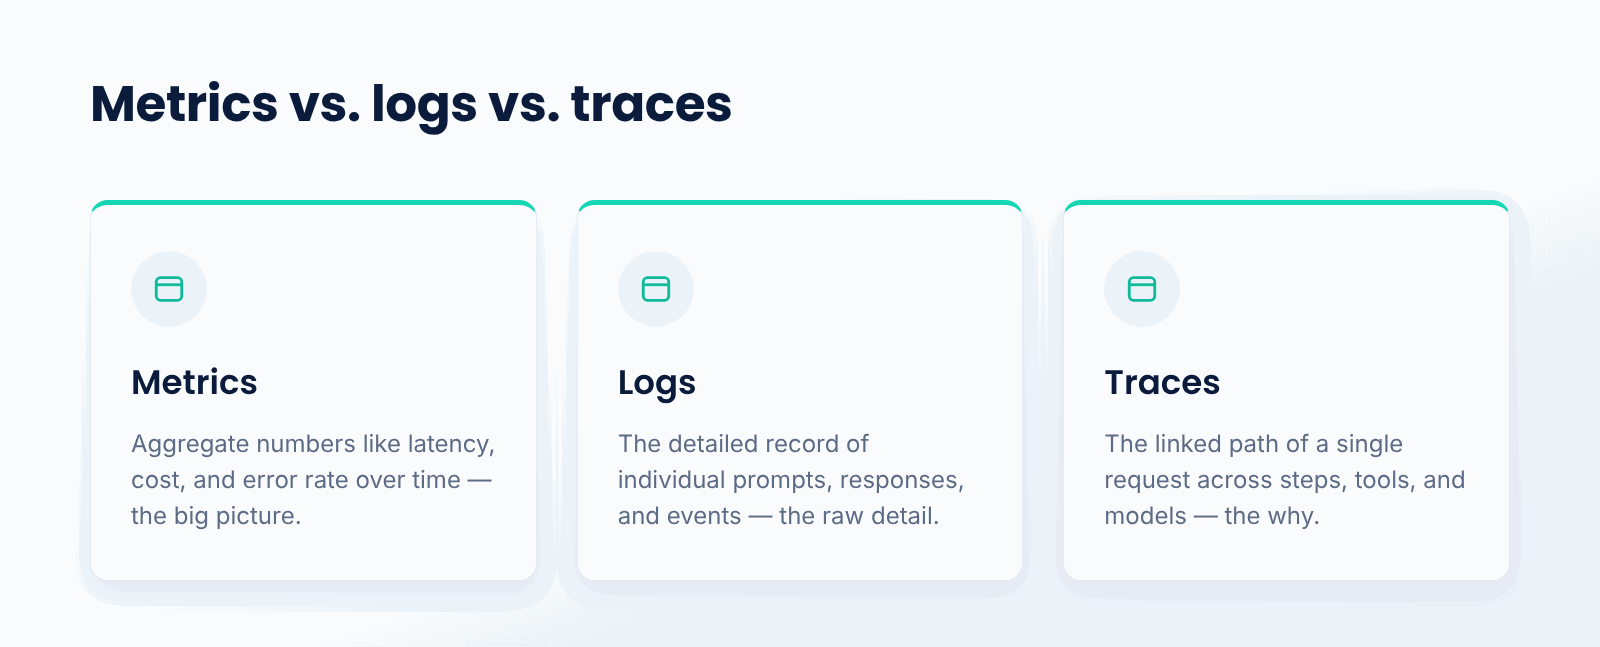
Observability rests on three kinds of data, the same pillars as in traditional systems, applied to LLMs. Metrics are aggregate numbers over time, such as average latency, cost per request, and error rate. Logs are the detailed record of individual events, the actual prompts, responses, and errors. Traces link the steps of a single request across retrieval, model calls, and tools into one connected path. Metrics tell you something is wrong, logs and traces tell you what and why.
For LLMs, traces are especially important because behavior is multi-step and input-dependent. Together the three give both the big picture and the detail needed to debug a specific bad response.
Why does LLM observability matter?
- Debugging. Traces show exactly what the model saw and did, so you can fix bad answers.
- Cost control. Token and cost tracking reveal where spend goes and where to cut it.
- Quality monitoring. Capturing outputs lets you watch for drift and regressions in production.
- Performance. Latency data shows bottlenecks and where to speed the system up.
- Accountability. A record of requests and responses supports auditing and compliance.
What are the challenges?
- Volume. High-traffic apps generate huge amounts of trace and log data to store and search.
- Measuring quality. Unlike latency, output quality is subjective and hard to quantify automatically.
- Sensitive data. Prompts and responses may contain personal data that must be handled carefully.
- Correlation. Linking all the steps of a complex, multi-call request takes proper instrumentation.
When do you need LLM observability?
You need it the moment an LLM application is in production and matters. Any system where cost, quality, or reliability counts requires visibility into what the model is doing, otherwise you cannot debug failures or control spend.
For a local experiment, print statements may do. The need for real observability grows with traffic, cost, and how much users depend on the system behaving well.
Best practices for LLM observability
- Capture prompts, responses, tokens, latency, and cost for every request.
- Trace multi-step requests end to end, including retrieval and tool calls.
- Track cost and token usage continuously and alert on spikes.
- Add quality signals, from user feedback to model-graded scores, alongside system metrics.
- Handle sensitive data in prompts and responses with care and proper controls.
- Centralize observability behind a gateway so every model and app is covered consistently.
Conclusion
LLM observability captures what happens inside an LLM application, the prompts, responses, tokens, latency, cost, and quality, and links it into traces so you can understand and improve the system in production. Built on metrics, logs, and traces adapted to LLMs, it is what turns an opaque, input-dependent app into one you can debug, optimize, and trust. It is a basic requirement for running LLMs seriously.
TrueFoundry's AI Gateway provides observability across every model and provider in one layer, with full request logging, token and cost tracking, and tracing. For any team running LLMs in production, that visibility is what makes debugging, cost control, and quality monitoring possible.
Steuern, implementieren und verfolgen Sie KI in Ihrer eigenen Infrastruktur
Frequently Asked Questions
What is LLM observability in simple terms?
It records all that occurs in an LLM app — the prompts, answers, tokens, latency, cost, and quality — so you can understand how it really worked in production and debug, optimize, and monitor it.
How is LLM observability different from normal observability?
It makes use of the same pillars, metrics, logs, and traces, only adapted for LLMs, along with token and cost tracking, prompt and response capture, and quality signals that traditional observability cannot handle.
What are the three pillars of observability?
Metrics, which are aggregate numbers such as latency and cost; logs, which are individual event records; and traces, which connect the steps of a single request. Traces are particularly crucial for LLMs since behavior is multi-step.
How does observability help control cost?
It gives insight into where your money is going by tracking token consumption and cost per call. This way, you know which prompts or features are expensive and when costs are spiking, so you can optimize and set alerts before bills run away.
Is LLM observability the same as evals?
No. Evals evaluate quality based on known cases, typically before deployment or whenever there is a change. Observability monitors the behavior of the system in real time once deployed. They are complementary: evals for testing, observability for monitoring.

GenAI infra- einfach, schneller, günstiger
Top-Teams vertrauen uns bei der Skalierung von GenAI

- © 2022 ENSEMBLE Technologies



Abonnieren Sie unseren Newsletter
Die neuesten Nachrichten, Artikel und Ressourcen werden in Ihren Posteingang gesendet


