June 23, 2026
|
5 min read

Published: June 23, 2026
Blazingly fast way to build, track and deploy your models!
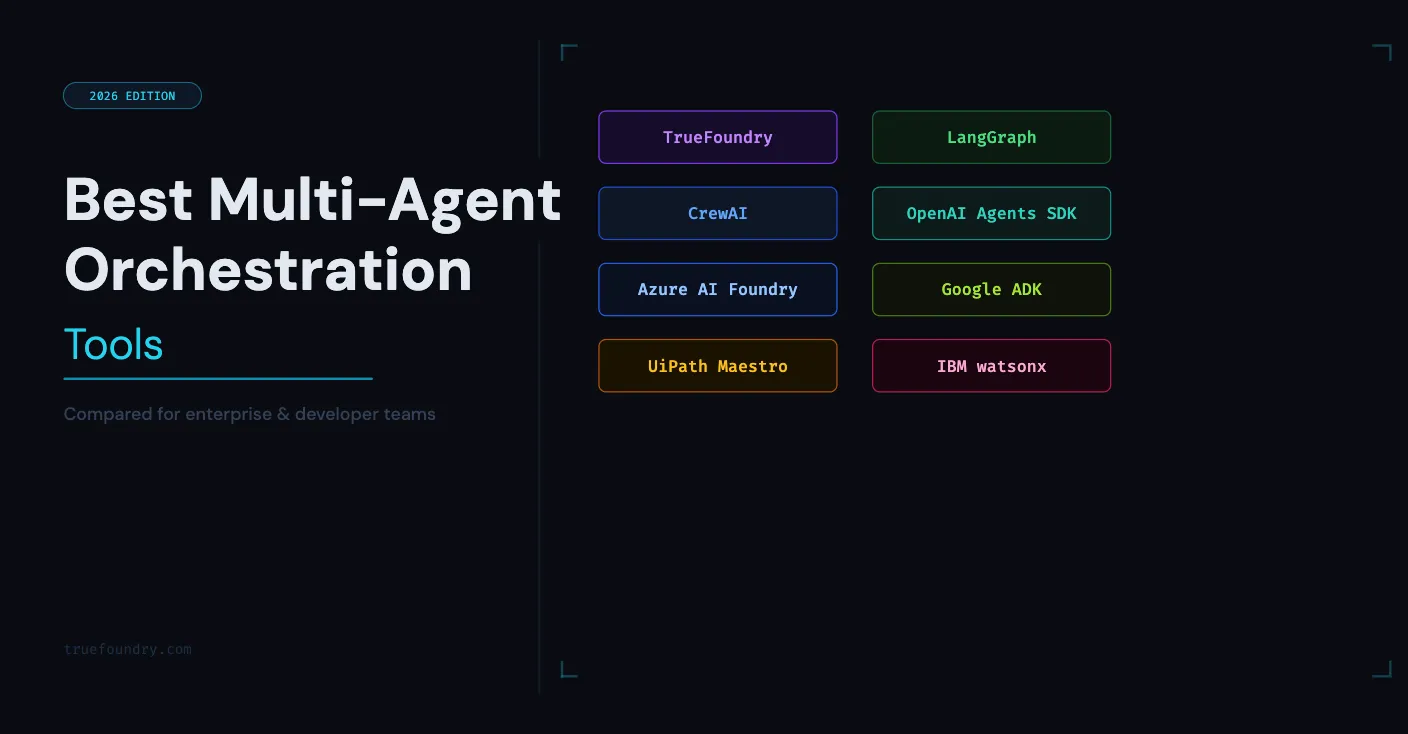
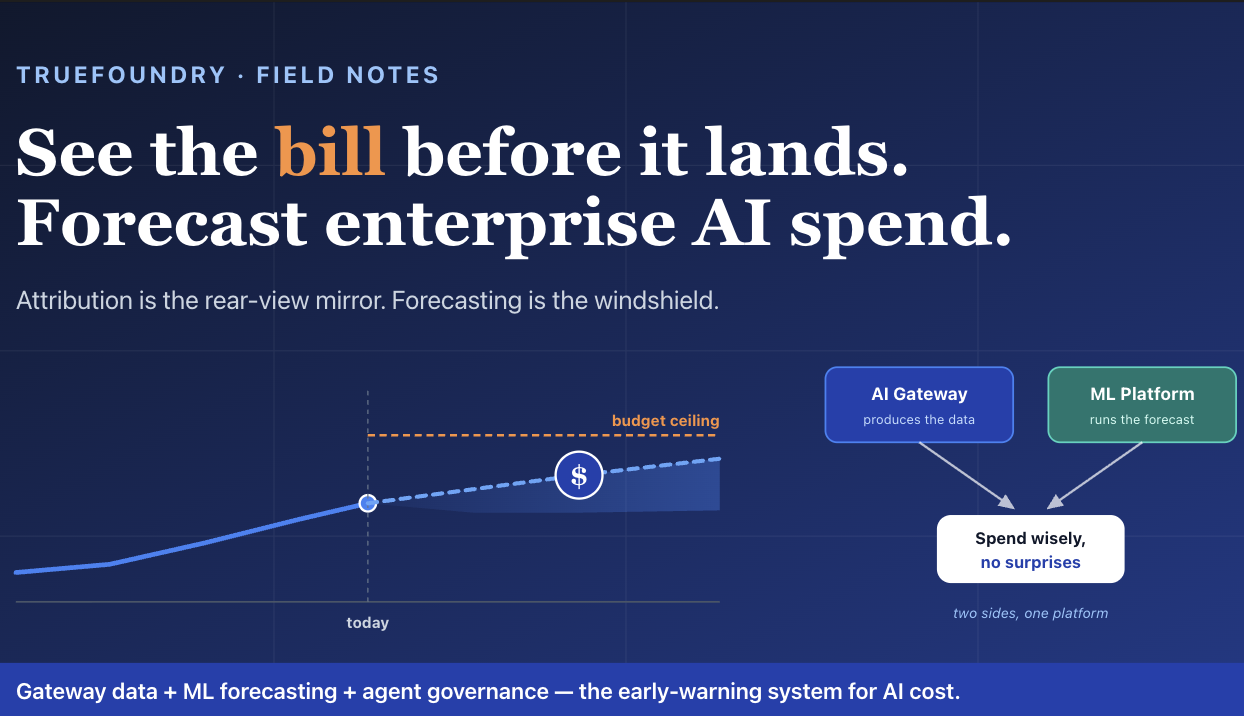
How to turn your AI Gateway's cost data into a forward-looking budget forecast — with an early-warning signal before you breach — using two well-understood time-series models, run end to end on TrueFoundry.
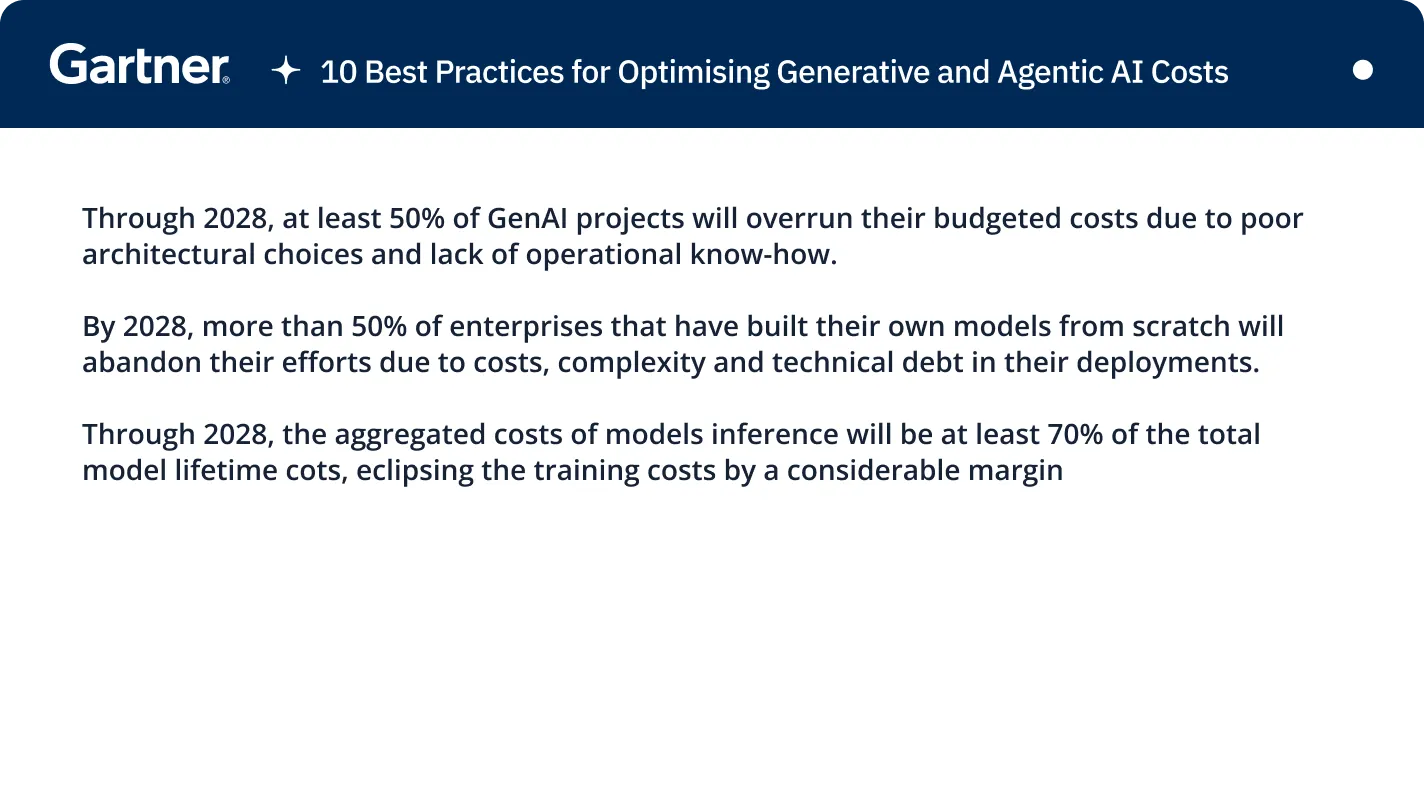
The tokenmaxxing trilogy made the case for attribution: you cannot govern spend you cannot see. The Field Notes follow-up on the Meta / Amazon / Uber whipsaw argued that attribution alone gives you a dial instead of a switch. But a dial still leaves one question unanswered: not "where did the money go?" — that is the rear-view mirror — but "where is it going?" When Uber was reported to have burned through its entire 2026 AI coding budget in four months, the problem was not that the spend was invisible. It was that nobody had a credible projection of when the budget would run out until it already had.
This post is about closing that gap with a forecast. We will walk a fictional but realistic company — Meridian, a mid-size fintech with about 800 engineers — from "we have attributed cost data" to "we have a weekly, self-updating projection of token spend per team, with an honest uncertainty band and an alert that fires before the budget breaks." We will use two complementary time-series models, SARIMAX and Prophet, and we will build, deploy, and re-train the whole thing on TrueFoundry — the same platform that emits the gateway cost telemetry, which also provides the ML infrastructure to train, serve, and retrain the forecaster.
Everything here depends on one precondition: clean, attributed cost data with a timestamp. That is exactly what a well-instrumented AI Gateway can produce: request-level cost — auto-priced from providers' published rates — with the metadata needed to aggregate spend by team, route, model, customer, or cost center. As covered in the trilogy and the observability overview, every request through the gateway emits that cost figure tagged by model, user, and arbitrary metadata, and exports to your warehouse or observability stack. Aggregate it to a weekly total per cost center and you have the only input a forecaster needs: a regular, labeled time series of spend.
The forecast is only as good as the tagging discipline underneath it, so this step is more operational than it looks. The gateway will faithfully record whatever metadata your applications send it — which means the time series is only as clean as that instrumentation. Before training, a team needs stable metadata keys and consistent team-to-cost-center mappings, a way to keep model prices current as providers change them, and an explicit policy for the awkward records: late or missing data, retries, fallbacks, and cached responses that cost little or nothing. Normalizing pricing, de-duplicating, and aligning timestamps to a single timezone is unglamorous, but it is the difference between a forecast and a confident-looking artifact built on noise.
That said, this is still the part teams without a gateway cannot do at all. If your spend is scattered across raw provider invoices, you can reconstruct a company-level monthly total, but you cannot get a clean weekly series per team with the causal context attached — and per-team, context-rich series are what make forecasting useful rather than decorative. The gateway is not just a cost-control point; it is the instrument that makes the spend forecastable in the first place.
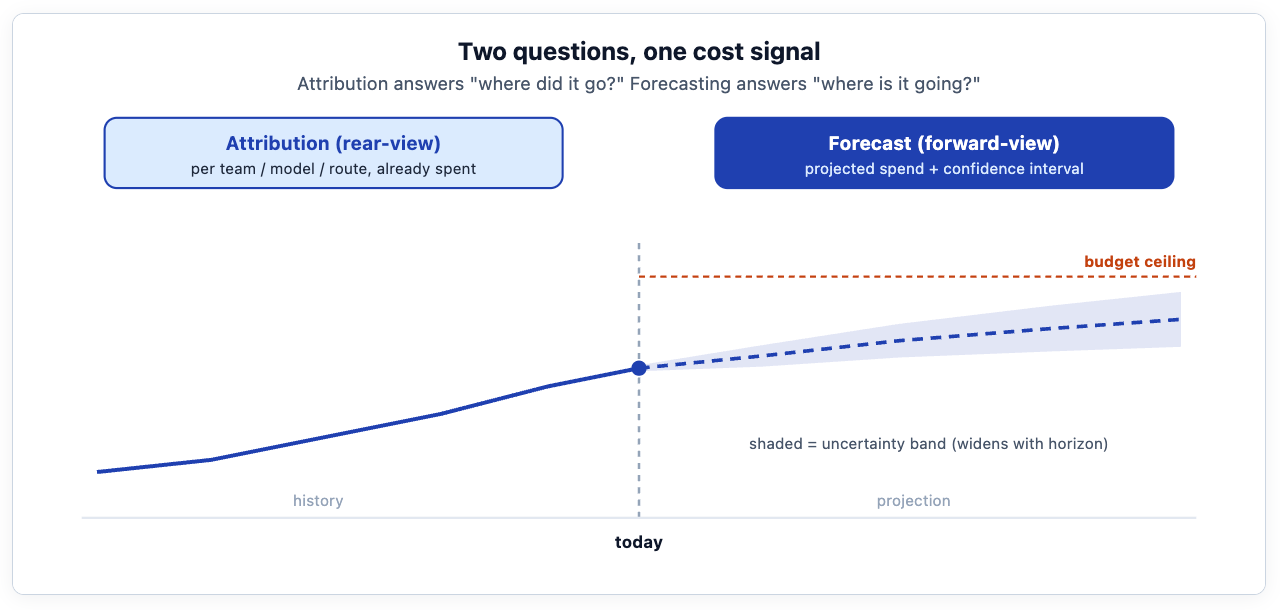
Meet Meridian — a composite, not a real company, but assembled from entirely real patterns. It has roughly 800 engineers, a year of aggressive internal AI adoption, and a finance team that just got a board question it could not answer: "what will AI cost us next quarter?" Attribution is already solved — their gateway can show, to the dollar, what last month cost and who drove it. What they cannot do is project forward credibly. The CFO's spreadsheet extrapolates a straight line; the platform team knows the truth is lumpier, because spend spikes around launches, dips over holidays, and steps up every time a team puts a new agent into production.
That is the gap between a trend line and a forecast. A straight-line extrapolation has no sense of seasonality, no notion of which drivers are pushing the curve, and — most importantly — no honest statement of its own uncertainty. Meridian needs a model that captures the rhythm, can incorporate what it knows is coming (the planned headcount increase, the three roadmap launches), and reports a confidence interval instead of a single deceptively-precise number.
There is no single best time-series model, and anyone who tells you otherwise is selling something. For Meridian's problem, two earn their place — and they earn it for different reasons.
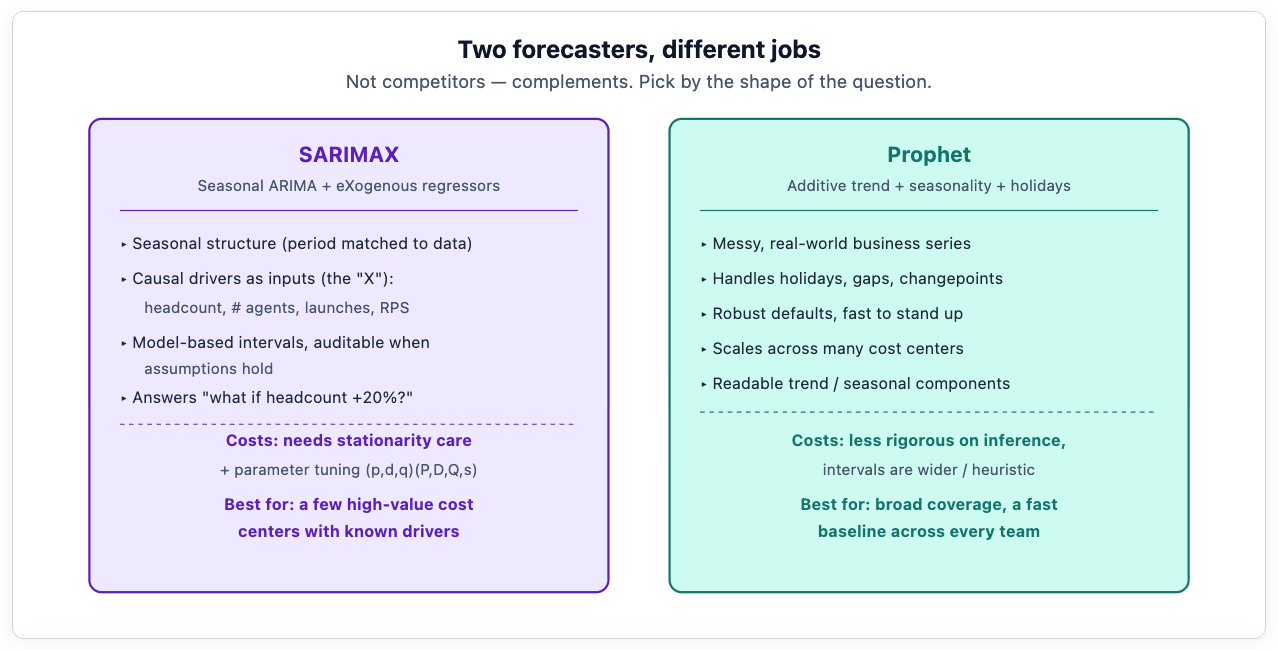
SARIMAX stands for Seasonal AutoRegressive Integrated Moving Average with eXogenous regressors. Strip the acronym and it is three ideas. The ARIMA core models a series as a function of its own recent past — last week's spend predicts this week's. The seasonal part adds a repeating cycle, and the period has to match how you've aggregated the data: for a weekly series, seasonality usually means longer rhythms like sprint, quarter, or annual planning cycles (a seasonal period of 52 captures the year), whereas weekday-versus-weekend effects only exist in a daily series and would use a period of 7. It is worth being precise about this, because a mismatched seasonal period is one of the most common ways a forecast quietly goes wrong. The exogenous part — the X, and the reason it fits Meridian so well — lets you feed in outside variables that drive the series: engineering headcount, the number of agents in production, planned launch flags. That is what turns a forecast into a what-if tool: Meridian can ask "what does spend look like if we add twenty engineers and ship the three roadmap launches?" and get an answer with a confidence interval, not a guess.
In rough, illustrative terms, fitting it looks like this — the point is the shape, not the syntax:
from statsmodels.tsa.statespace.sarimax import SARIMAX

# weekly spend, with headcount + agent-count as exogenous drivers
model = SARIMAX(weekly_spend,
                exog=drivers[["headcount", "agents_in_prod"]],
                order=(1, 1, 1),
                seasonal_order=(1, 1, 1, 52))   # 52 = annual cycle on a weekly series
fit = model.fit(disp=False)
forecast = fit.get_forecast(steps=12, exog=future_drivers)
mean, ci = forecast.predicted_mean, forecast.conf_int()
The cost of that rigor is real: SARIMAX needs the series to be roughly stationary (you difference it until it is — the "I" in the name), and the order parameters take tuning. That makes it the right tool for a handful of high-value cost centers where the effort pays off and where you genuinely have driver data — not for forecasting two hundred teams at once.
Prophet, the open-source forecaster from Meta's research group, takes the opposite stance. It decomposes a series into trend, seasonality, and holiday effects, and it is designed for messy business time series — with trend, weekly and yearly seasonality, holidays, automatic changepoint detection, and practical tools for handling outliers and irregularities — producing a reasonable forecast with little tuning. That is not the same as "no data cleaning required" (the caveats above about pricing, retries, and missing records still apply), but it is far more forgiving out of the box than SARIMAX. For Meridian, that makes it the natural choice for the long tail: run it across every team's series to get a robust baseline forecast everywhere, cheaply, without hand-tuning two hundred models.
from prophet import Prophet

df = weekly_spend.reset_index()        # columns: ds (date), y (spend)
m = Prophet(weekly_seasonality=True,
            changepoint_prior_scale=0.1)
m.add_country_holidays(country_name="US")
m.fit(df)
future = m.make_future_dataframe(periods=12, freq="W")
forecast = m.predict(future)           # yhat, yhat_lower, yhat_upper
The trade-off is the mirror image of SARIMAX's. SARIMAX can give model-based intervals that are easier to audit when its assumptions hold; Prophet provides useful uncertainty intervals too, but they are derived differently and teams should calibrate both against backtests rather than treating either as a formal guarantee. What Prophet does not natively give you is the clean causal "what-if" that exogenous regressors do — and that is fine, because you are not asking it to. The pragmatic architecture Meridian lands on is to run both: Prophet for breadth across all teams, SARIMAX layered on the three or four cost centers big enough to justify driver-based modeling. The two together cover more ground than either alone.
Before the operational story, the caveat that keeps this from being snake oil. A forecast's most important output is not its point estimate — it is its uncertainty interval. A model that says "next quarter will cost $1.2M" is far less useful, and far more dangerous, than one that says "next quarter will land between $1.0M and $1.5M with 80% confidence, and here is why the band is that wide." The band is what tells a finance team whether they are looking at a rounding error or a real risk. And it should widen with the horizon: any forecaster that claims the same precision about week 12 as week 1 is hiding the truth. The interactive model below is built around exactly this feature.
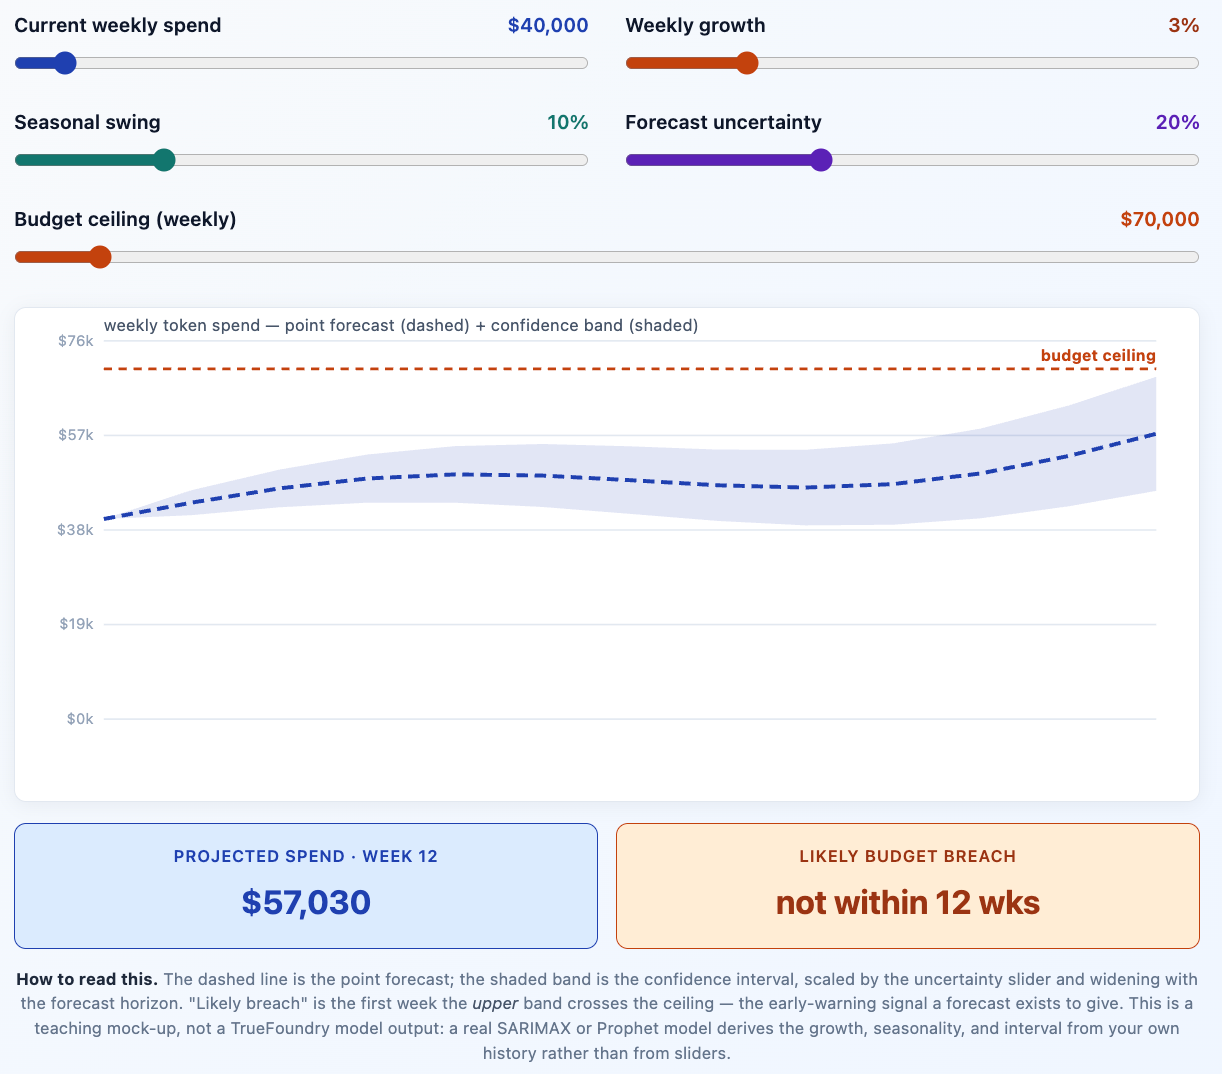
Notice what the early-warning signal actually is. It is not the point forecast crossing the budget ceiling — it is the moment the upper edge of the band crosses it. That is the first week at which a breach becomes plausible rather than certain, and it is the right moment to act, because acting early is cheap and acting late is the blunt cap the whole series has argued against. A good forecast buys you that lead time.
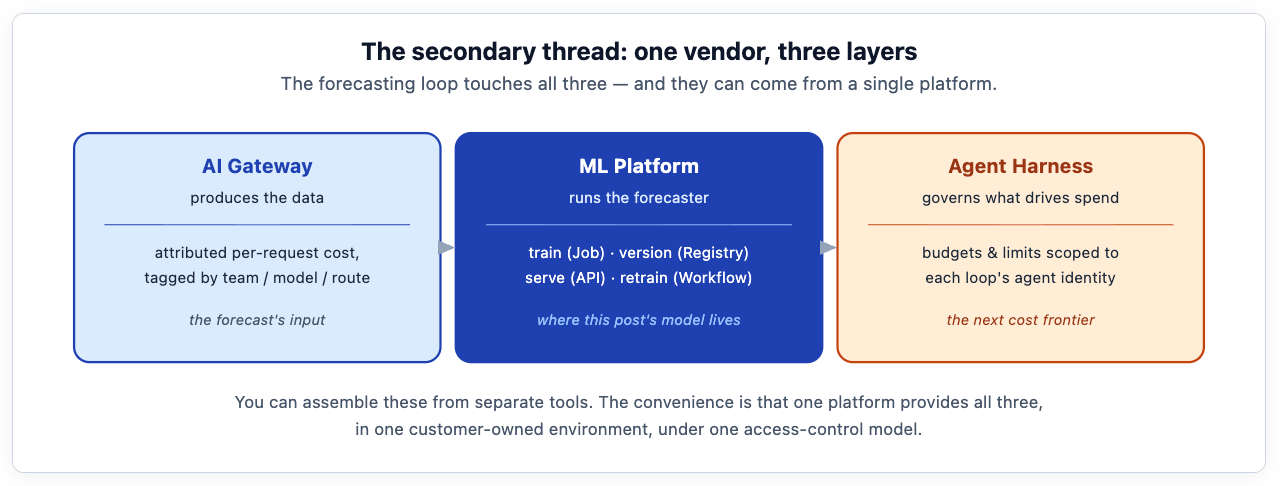
This is the secondary thread, kept deliberately in its own section so it does not crowd the forecasting. Here is where the two halves of TrueFoundry's platform meet, and where this stops being a generic data-science tutorial. Most write-ups about Prophet or SARIMAX stop at the model. But a model in a notebook is not a forecast a finance team can rely on — it is a one-off. The hard, unglamorous, and genuinely valuable part is operational: getting the model trained on real infrastructure, versioned so you can compare and promote, served behind an API the dashboard can call, and — the piece almost everyone forgets — automatically re-trained so it does not silently rot as spending patterns shift.
TrueFoundry is, underneath the gateway, an ML platform built on Kubernetes. Its design goal, stated plainly in that architecture write-up, is that data shouldn't leave your cloud — the same split-plane model as the gateway, where TrueFoundry's control plane orchestrates while your compute plane runs the actual workloads inside your own account. For a fintech like Meridian, that property is not a nice-to-have; cost data tagged by team and project is sensitive, and keeping the training and serving inside the VPC is what makes this approach viable at all.
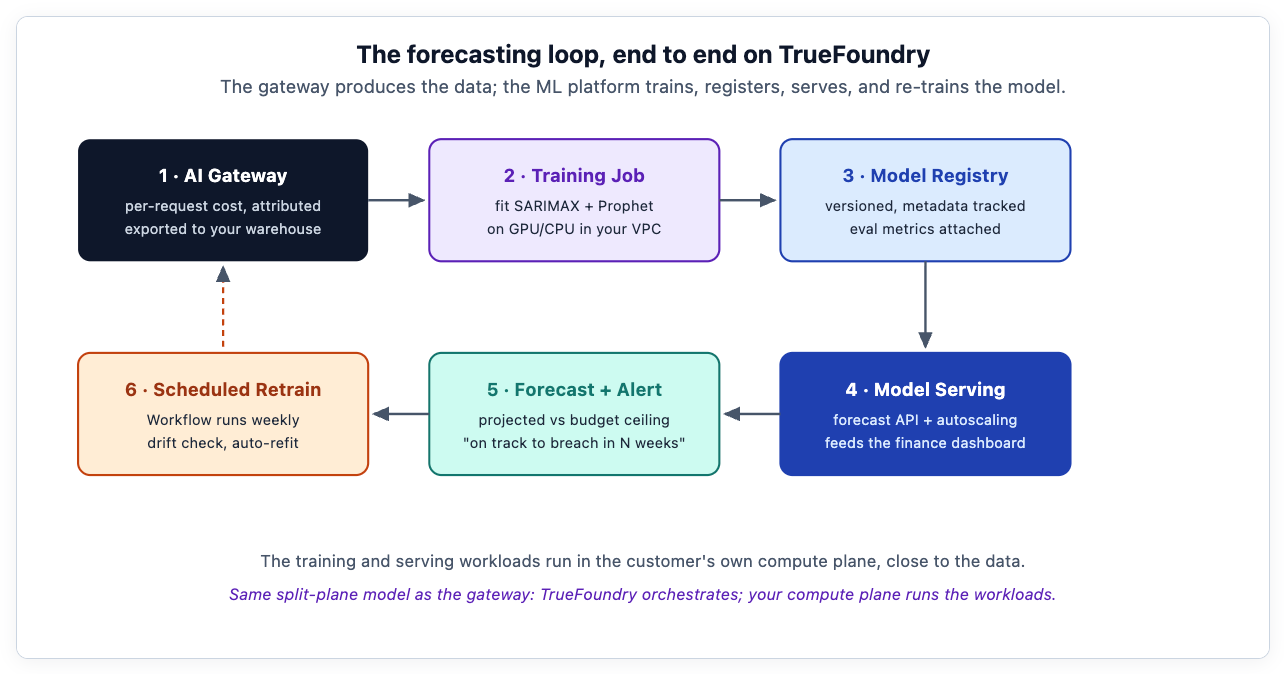
Concretely, the loop maps onto TrueFoundry platform modules that the architecture documentation describes directly:
Training as a Job. The model fit runs as a TrueFoundry Job — a containerized task on your Kubernetes compute plane, with the CPU or GPU resources it needs, reading the gateway's exported cost data. No notebook left running on someone's laptop; a reproducible job with tracked inputs.
Versioning in the Model Registry. TrueFoundry provides a model registry so each trained forecaster is versioned with its metadata and evaluation metrics attached. When this week's model backtests worse than last week's, you can compare the versions and choose whether to promote the new one or keep serving the incumbent — the difference between an experiment and a dependable service.
Serving as an API. The chosen model deploys as a TrueFoundry Service: a scaling, monitored endpoint that the finance dashboard calls to get the latest projection and band. Autoscaling and health checks come from the platform, not from glue code.
Scheduled re-training as a Workflow. This is the keystone. TrueFoundry integrates a workflow engine (ArgoWorkflows) for exactly this kind of scheduled, multi-step job. A weekly workflow pulls the latest cost data, checks the live model for drift, re-fits if needed, evaluates, and promotes the new version only if it beats the incumbent. The forecast stays current without anyone remembering to run a script.
Cost-attributed, naturally. Because the forecasting workloads themselves run on TrueFoundry, their compute cost is attributed by the platform too — the architecture write-up notes fine-grained per-service cost attribution via OpenCost. The system that forecasts your AI spend reports its own cost on the same dashboard. The instrument is calibrated against itself.
That end-to-end story — the gateway produces the data, the ML platform trains and serves and re-trains the model, under one access-control model — is something a bare forecasting library cannot give you, and it is the part that makes this a platform decision rather than a data-science side project. To be precise about the boundary: the training and serving workloads run on your compute plane, close to the data, while TrueFoundry's control plane orchestrates them; as with any deployment, teams should confirm which metadata, logs, licensing, and control-plane records leave the environment under their chosen model and contract. And to be precise about the division of labor: TrueFoundry does not make SARIMAX or Prophet special, and it does not produce a finance-grade forecast out of the box. What it makes production-grade is the loop around the model — attributed cost data from the gateway, training jobs in the customer compute plane, versioning, serving, workflow-based re-training, and cost attribution for the forecasting workload itself. The customer still builds and validates the model; the platform is the substrate that lets that model run reliably. The point is not that SARIMAX and Prophet are exotic; they are not. The point is that the distance from "a model that works in a notebook" to "a forecast finance trusts every Monday morning" is exactly the distance an ML platform is built to cover.
A forecast nobody has validated is just a confident-looking line, and shipping alerts off an unvalidated model is how you teach a finance team to ignore your alerts. Before any projection drives a decision, it has to earn trust on history. The standard method is rolling-origin evaluation, sometimes called walk-forward: train on weeks 1 through N, forecast weeks N+1 to N+12, compare against what actually happened, then slide the window forward and repeat. Done across the whole history, this tells you how the model would have performed week after week, not just on one lucky split.
Track a few metrics, because each answers a different question. MAPE or WAPE — error as a percentage — is the readable one for a finance audience ("we're typically within 8%"). RMSE punishes large misses harder, so it surfaces the occasional bad week that a percentage average would smooth over. And the one most people forget: interval coverage — does the 80% band actually contain the real value about 80% of the time? A model whose 80% band only catches reality half the time is lying about its own confidence, and that is worse than a wider, honest band. The promote-only-if-better rule from the scheduled retrain should be written against these metrics: a new weekly model replaces the incumbent only if it beats it on the agreed error metric without degrading coverage.
Putting it together: Meridian's gateway has been emitting attributed cost for months, so they have a clean weekly series per team. A TrueFoundry training Job fits Prophet across all teams for a baseline, and SARIMAX on the four biggest cost centers using headcount and agent-count as regressors. Both models land in the registry with their backtest errors recorded. The better model per cost center is served behind a forecast API. The finance dashboard now shows, for each team, a projected spend curve with an 80% band and a flag — green, amber, or breach-likely — based on where the upper band sits relative to that team's budget. A weekly workflow keeps all of it fresh.
The board question — "what will AI cost us next quarter?" — now has an honest answer: a range, with the drivers named, and an alert that will fire in the window before any team breaches rather than after. Meridian did not eliminate the cost. It made the cost legible into the future, which is the only thing that converts a budget from a wall you hit into a plan you steer. That is the dial, pointed forward.
This is not a claim that forecasting removes the need for judgment, or that a model can run cost governance on autopilot. A forecast is decision support: it widens the window in which a human can act, and it makes the act cheaper by giving lead time. It does not decide whether a spend trajectory is acceptable — that is a business call about whether the work the tokens produce is worth it, which is the same input-versus-output question the trilogy turned on. A forecast that breaches the budget might mean "cut waste" or might mean "raise the budget because this team is shipping" — the model cannot tell you which, and any vendor implying otherwise is overselling.
Nor is this a claim that SARIMAX and Prophet are the only or best models — gradient-boosted trees, state-space models, and deep forecasters all have their place, and for some series a simple seasonal-naive baseline is genuinely hard to beat. The two we chose are well-understood, well-supported, and a sensible default pairing; they are a strong starting point, not a final answer. And the interactive chart above is a teaching mock-up driven by sliders, not a TrueFoundry model output — a real forecast derives its growth, seasonality, and interval from your history, not from a control you drag. The honest framing is the same one this series has held throughout: the platform gives you the instruments; your team still reads them and makes the call.
You can absolutely start with one, and for most teams Prophet is the faster first step — it gives a robust baseline across every cost center with minimal tuning. Add SARIMAX later, and only on the few high-value cost centers where you have real driver data (headcount, agent count, launch calendar) and want the tighter intervals and what-if capability that exogenous regressors provide. The pairing is the mature state, not a prerequisite.
A straight line has no seasonality, no driver awareness, and — fatally — no uncertainty band. It will be confidently wrong around launches and holidays, and it gives a finance team no way to distinguish a small wobble from a real risk. The whole value of a forecast is the honest interval and the early-warning signal; a trend line has neither.
The training and serving workloads can run in your own compute plane, close to the data, with TrueFoundry's control plane orchestrating rather than ingesting the training data. That is the property that makes the approach usable for regulated workloads — but teams should confirm exactly which metadata, logs, licensing, and control-plane records leave the environment under their chosen deployment model and contract, rather than treating "nothing leaves" as automatic.
It depends on how fast your spending patterns shift, but weekly is a sensible default for token cost, which moves with sprint cycles and launches. The important thing is that re-training is automated as a scheduled workflow with a drift check and a promote-only-if-better gate, so the forecast keeps pace without manual effort and without silently degrading.
If your monthly AI spend is small and flat, a forecast is not worth the effort — attribution and a budget alert are enough. Forecasting earns its keep when spend is large, growing, and lumpy enough that the difference between "we breach in week 5" and "we breach in week 11" changes what you do this month. Meridian is past that threshold; a ten-person startup probably is not yet.
The tokenmaxxing trilogy (the attribution argument this builds on):
Part 1 — The Cost-Governance Gap. Part 2 — The Architecture of Governed AI Usage. Part 3 — Building the AI Leverage Control Room.
Field Notes (the whipsaw and the dial-not-switch argument):
When AI Cost Control Becomes a Switch — and Why It Should Be a Gateway (the Meta / Amazon / Uber reversal, with primary-source citations).
TrueFoundry platform (the product surface underneath this):
ML platform architecture — Machine Learning on Kubernetes (training, registry, serving, workflows, split-plane deployment, OpenCost attribution). AI Gateway — product page. Observability and cost tracking — observability in the AI Gateway. Platform docs — docs.truefoundry.com/introduction.
The models (external, open documentation):
SARIMAX is documented in statsmodels; Prophet is documented at facebook.github.io/prophet.
Written by the TrueFoundry team. This is an educational piece; Meridian is a fictional composite and the interactive chart is an illustrative mock-up, not a product output or a benchmark. Forecasting is decision support, not a guarantee — validate any model against your own data and treat its intervals, not its point estimates, as the signal.
TrueFoundry AI Gateway delivers ~3–4 ms latency, handles 350+ RPS on 1 vCPU, scales horizontally with ease, and is production-ready, while LiteLLM suffers from high latency, struggles beyond moderate RPS, lacks built-in scaling, and is best for light or prototype workloads.


The latest news, articles, and resources sent to your inbox
© 2026 All rights reserved.


.webp)
.webp)
.webp)
.webp)
.webp)

.webp)

.webp)