October 12, 2026
|
5 min read


Published: September 11, 2026

Blazingly fast way to build, track and deploy your models!
Multi-provider LLM bills are easy to pay and hard to allocate. Anthropic's console shows one number per API key; OpenAI's shows one number per project. Those numbers are exact. They do not answer who spent it, on which app, in which feature, against whose budget. This post is how a gateway-level attribution layer closes that gap — the metadata-tagging schema, the per-trace cost formula across providers, the aggregation pipeline that turns billions of spans into a daily team rollup, soft and hard budget enforcement with a real concurrency model, and the chargeback report that comes out the other end.
Wednesday afternoon at Northwind. Sarah, VP Platform, gets the Slack: "Need the AI cost breakdown by team for the Q2 budget meeting on Friday." She opens the Anthropic console. One row: $47,234.12 month-to-date, billed against sk-ant-prod-northwind-shared. That key powers fifty-plus engineers across four teams and a dozen applications. The number is exact. It is also useless for the conversation she needs to have on Friday — which team, which application, which feature, which customer the bill is for.
Sarah's options are bad. She can split the key four ways and lose the gateway's cross-provider routing as collateral. She can ask each team lead for an estimate and reconcile manually — a number that will be wrong by thirty percent. Or she can pull the answer from where the work has already been recorded: the gateway's trace store. This post is how the third option works.
The structural problem with provider-native billing is that it aggregates at the credential boundary, not the team boundary. Anthropic groups spend by API key and organization; OpenAI by project; Azure by deployment and resource group; AWS Bedrock by IAM role and account. None of these match the operational unit you actually want to charge — team, application, feature, customer.
The classical workaround — one credential per team — works, but kills the value of having a gateway in the first place: the routing logic that picks Anthropic for hard requests and Haiku for simple ones, that falls back to Azure when Anthropic overloads, that load-balances across regional deployments. All of it requires the gateway to hold credentials for every provider. Per-team keys force per-team provider relationships. Application-layer instrumentation is the other dead end — it works in greenfield codebases and not for the agent that calls three providers across two SDK versions and a forked LangChain. Attribution belongs at the gateway, because that is where every provider call routes through anyway.
The pattern is straightforward: every request to the gateway carries a JSON object describing what the caller is, who they're calling for, and what they're doing. The gateway stores this object on the trace alongside the gen_ai attributes, and projects a curated subset of fields onto the metric labels used for aggregation.
HTTP — application sets the metadata header on every gateway call
POST /v1/chat/completions HTTP/1.1
Host: gateway.northwind.internal
Authorization: Bearer ...
Content-Type: application/json
X-TFY-METADATA: {
  "team": "platform-eng",
  "app": "code-review-agent",
  "feature": "pr-summary",
  "env": "production",
  "user_id": "u_12345",
  "repo": "northwind/cargo-copilot",
  "pipeline_id": "ci-run-98765"
}

{"model": "claude-sonnet-4-6", "messages": [...]}
The fields are deliberately heterogeneous. Low-cardinality fields — team, app, feature, env — project well to metric labels. High-cardinality fields — user_id, pipeline_id — would explode metric storage if projected, and stay on the trace only. The gateway has to know the difference: tag-for-aggregation fields are an explicit allow-list (a typical config: team, app, feature, env, model_class) that becomes part of the daily rollup keyspace; everything else is tag-for-audit, stored on the trace for forensics and ad-hoc queries.
The application sets metadata once, at the outer call. The gateway propagates it across the entire span tree — including across fallback (a fallback to a different provider keeps the same metadata) and across multi-turn agent loops (each tool call carries the same metadata as the parent call). Inheritance is automatic; the team doesn't have to thread metadata through every call site.
Cost is computed at span close, not at invoice time. The gateway holds a versioned pricing table per (provider, model) pair and applies it to the usage tokens reported in the final response chunk. The output is stored as gen_ai.usage.cost_usd on the provider span and rolled up to the root.
Python — cost computation at provider-span close, full multi-line-item formula
# Pricing tables are versioned with the date in force when they were set.
PRICING = {
    "openai:gpt-4o-2024-08-06": {
        "input": 2.50, "cached_input": 1.25, "output": 10.00,
        "version_date": "2024-08-06",
    },
    "anthropic:claude-sonnet-4-6": {
        "input": 3.00, "cached_input": 0.30, "cache_write_5m": 3.75,
        "cache_write_1h": 6.00, "output": 15.00,
        "version_date": "2026-02-17",
    },
    "anthropic:claude-haiku-4-5": {
        "input": 1.00, "cached_input": 0.10, "cache_write_5m": 1.25,
        "output": 5.00, "version_date": "2025-10-22",
    },
    # ... one entry per (provider, model) pair the gateway routes to
}

def compute_span_cost_usd(span_attrs: dict) -> float:
    key = f"{span_attrs['gen_ai.provider.name']}:{span_attrs['gen_ai.response.model']}"
    p = PRICING[key]

    in_tok  = span_attrs.get("gen_ai.usage.input_tokens", 0)
    out_tok = span_attrs.get("gen_ai.usage.output_tokens", 0)
    c_read  = span_attrs.get("gen_ai.usage.cache_read.input_tokens", 0)
    c_write = span_attrs.get("gen_ai.usage.cache_creation.input_tokens", 0)

    # Per OTel spec, gen_ai.usage.input_tokens INCLUDES both cache lines.
    # Subtract both before applying the fresh-input rate.
    fresh = max(in_tok - c_read - c_write, 0)
    write_rate = p.get("cache_write_5m", p.get("cache_write", 0))

    cost = (
        fresh   * p["input"]        / 1_000_000 +
        c_read  * p["cached_input"] / 1_000_000 +
        c_write * write_rate        / 1_000_000 +
        out_tok * p["output"]       / 1_000_000
    )

    # Audio (per-minute) and image (per-image) add separately, not per token.
    audio_sec = span_attrs.get("gen_ai.usage.audio_seconds", 0)
    img_count = span_attrs.get("gen_ai.usage.image_count", 0)
    cost += (audio_sec / 60) * p.get("audio_per_min", 0)
    cost += img_count        * p.get("image_each", 0)

    return round(cost, 6)
Two details matter that are easy to miss. First, the pricing table is versioned with a date stamp because providers change prices and the bill has to match what was in force at the time of the request — never re-compute historical traces with today's pricing. Second, audio and image inputs price per minute and per image, not per token; they have to be added as separate lines or the formula silently misses them.
The cache-token subtraction (fresh = input_tokens − cache_read − cache_write) is the same subtlety the OpenTelemetry GenAI spec calls out: gen_ai.usage.input_tokens is defined as the total including both cache lines, so subtracting once for cache_read but not for cache_write — a common bug — double-counts the cache-write portion at both the fresh-input rate and the cache-write rate.
A single 50-engineer org running an agent on every PR easily emits a million provider spans per day. Querying that raw volume to answer "what did the platform team spend yesterday" is technically possible and operationally terrible — full scans on a trace store cost as much per query as the underlying inference. The fix is pre-aggregation, done in three layers.
Aggregation pipeline — per-minute counters → hourly rollups → daily MV
# Layer 1 — Streaming counter (per-minute, in memory at the gateway worker)
key   = (team, app, feature, env, model, provider)
delta = (tokens_in, tokens_out, cache_read, cache_write, cost_usd, 1)
counters[key] += delta
# Flush every 60s to Layer 2.

# Layer 2 — Hourly rollup table (ClickHouse / TimescaleDB)
CREATE TABLE llm_spend_hourly (
    hour_ts          DateTime,
    team             LowCardinality(String),
    app              LowCardinality(String),
    feature          LowCardinality(String),
    env              LowCardinality(String),
    model            LowCardinality(String),
    provider         LowCardinality(String),
    input_tokens     UInt64,
    output_tokens    UInt64,
    cache_read_tok   UInt64,
    cache_write_tok  UInt64,
    cost_usd         Float64,
    request_count    UInt32,
    error_count      UInt32
) ENGINE = SummingMergeTree
  PARTITION BY toYYYYMM(hour_ts)
  ORDER BY (team, app, hour_ts);

# Layer 3 — Daily materialized view (chargeback source of truth)
# Same schema, day-grained. Refreshed at 00:15 UTC.
# Indexed on (team, app, day_ts) for sub-second UI queries.
The cost discipline that makes this affordable: never aggregate by querying the trace store. The trace store is for forensics. Aggregations come from the rollup tables. At Northwind scale (a million spans per day), the rollups stay in the gigabyte range with sub-second query latency. Engine choice is mostly taste — ClickHouse is faster on big aggregations and has better cardinality control; TimescaleDB is friendlier for teams already running Postgres. Both run this workload on a single VM at startup-to-mid-scale. Past about a billion spans per day, ClickHouse pulls ahead.
Once you can compute team spend in near-real-time, budgets follow. The pattern is two-tier.
Soft limit (80% of budget). Trigger a notification to the team owner via PagerDuty or Slack. No request is blocked. The intent is to surface the trend before it becomes a problem. Some teams set 60% / 80% / 95% three-step soft limits.
Hard limit (100% of budget). The gateway returns HTTP 429 with an error body identifying the cause, and refuses to call the provider:
HTTP 429 — budget_exhausted response shape
HTTP/1.1 429 Too Many Requests
Content-Type: application/json
Retry-After: 86400

{
  "error": {
    "type": "budget_exhausted",
    "code": "team_monthly_limit",
    "message": "Team 'platform-eng' has exhausted its $25,000.00 May budget. Contact your budget owner or request an increase.",
    "team": "platform-eng",
    "limit_usd": 25000.00,
    "spent_usd": 25032.18,
    "period_end": "2026-05-31T23:59:59Z"
  }
}
The concurrency problem is real. If team X is at $24,997 of a $25,000 budget and ten concurrent requests arrive, naive read-then-write logic has every worker see "under budget" and all ten dispatch. The fix is an atomic counter. Redis INCRBYFLOAT is the workhorse: each worker increments by the projected request cost before dispatch (estimated from token-count headroom and the cheapest plausible model the team is allowed), checks the post-increment value against the limit, and aborts if it crossed. Actual cost reconciles against the projection at span close; small adjustments settle in the daily rollup.
This pattern over-counts slightly on aborted requests but never under-counts. For a budget circuit breaker, that's the right asymmetry: a few cents of over-counting beats a thousand-dollar over-spend.
The brittlest part of a budget system is the cliff at 100%. Going from full quality to 429 in one step is a bad experience. A better pattern is graceful degradation: as utilization climbs, route to cheaper models.
The integration with the gateway's routing layer is a budget-aware policy that overrides the default model selection. A common shape:
YAML — routing policy fragment with budget-aware overrides
- team: platform-eng
  default_model: claude-sonnet-4-6
  budget_routing:
    - when: utilization < 0.80
      use: claude-sonnet-4-6
    - when: utilization >= 0.80 and utilization < 0.95
      use: claude-haiku-4-5
      notify: slack://platform-eng-budget
    - when: utilization >= 0.95
      use: claude-haiku-4-5
      max_output_tokens: 500
      notify: pagerduty://platform-eng-oncall
At 80% the team is bumped from Sonnet to Haiku — a 3x cost reduction at a quality drop most non-critical tasks tolerate. At 95% the output cap also tightens, which bounds the worst-case per-request cost. The team owner is notified at each transition. The pipeline does not stop.
The trade-off has to be made consciously per workload. Code review and ticket triage degrade gracefully; medical-record summarization probably shouldn't. The routing policy lives next to the application's other production config.
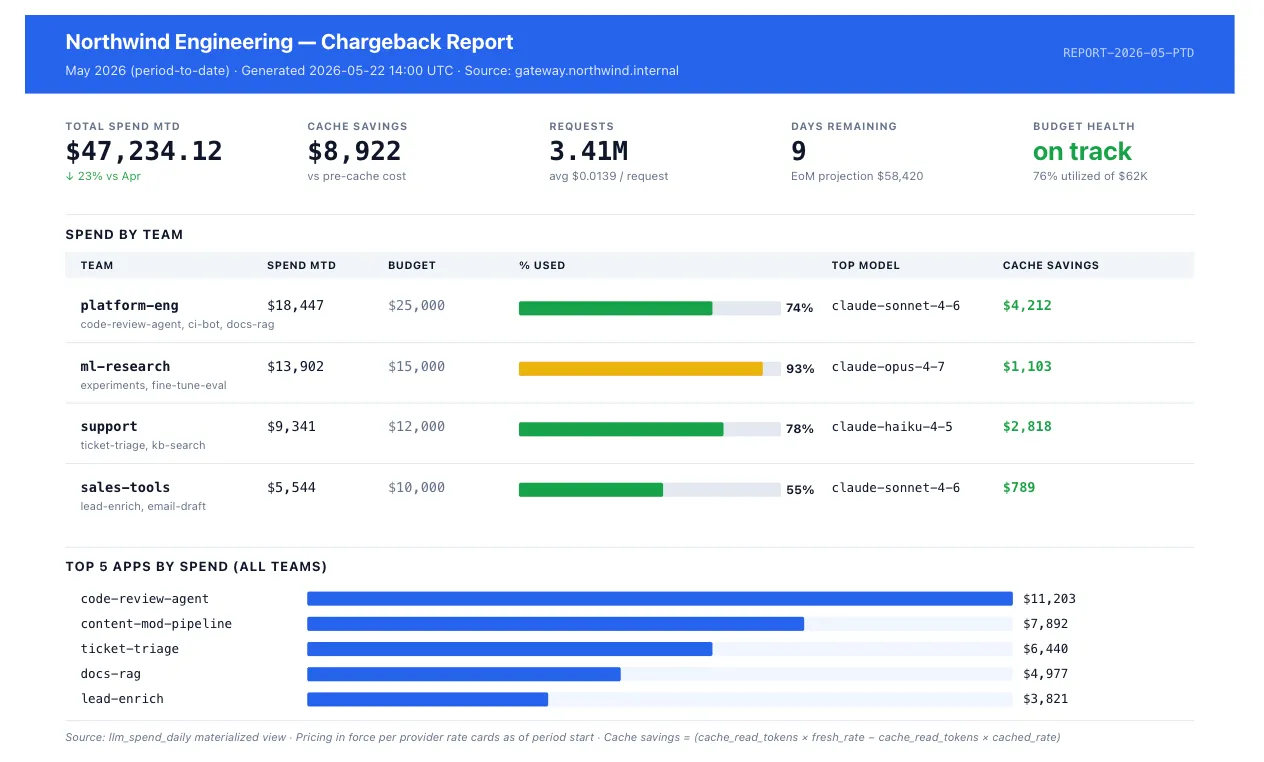
The artifact that closes the loop is a monthly chargeback report exported to whoever does cost allocation work — typically a FinOps team or finance partner. The schema is a copy of the daily rollup, filtered to the month and grouped one row per (team, app, model, provider).
The cache_savings_usd column is the one that justifies most of the platform investment. It is computed as (cache_read_tokens × fresh_input_rate − cache_read_tokens × cached_rate) / 1e6 — the gap between what those tokens cost at the cached rate and what they would have cost fresh. For agents with a stable system prompt across thousands of requests, this figure is often a third to two-thirds of total spend.
The report is generated as CSV for ingestion into the org's existing FinOps tooling and as a rendered dashboard for the team owners themselves. The mockup below is what a month-end view looks like.
Concrete numbers, using Claude Sonnet 4.6 pricing as of May 2026: $3 input, $15 output, $0.30 cache read, $3.75 cache write per million tokens.
Northwind's code review agent runs on every pull request. The per-PR shape: a 12,000-token system prompt (style guide, repo conventions, checklist, few-shot examples); a 1,500-token diff; ~800 tokens of inline review output. 50 engineers × 10 PRs/day = 500 PRs/day.
Without caching. Per PR: (12,000 + 1,500) × $3/1M + 800 × $15/1M = $0.0405 + $0.012 = $0.0525. Daily: $26.25. Monthly: $787.
With 5-minute prompt caching on the 12K system prompt — cache miss on cold path, cache read on warm path, ~85% warm hit rate on a busy repo:
At a 500-engineer org, the same calculation scales linearly to $7,870/month uncached and $3,940/month with caching. Without per-trace attribution this delta is invisible — a chunk of an undifferentiated shared-key total. With attribution, the chargeback row reads: platform-eng / code-review-agent / claude-sonnet-4-6 / anthropic — $394 spent, $393 in cache savings, 15,500 requests, 0.1% error rate. Friday's conversation is no longer about $47,234 on a shared key.
Why not just use one API key per team and look at the provider's dashboard?
You can. It costs you the gateway's value: cross-provider routing, automatic fallback, load balancing, unified rate limits, central key rotation. Most teams that start there migrate to gateway-level attribution within a quarter once they discover that splitting keys also forces them to split traffic policies. The metadata-tag approach gives you attribution without that tradeoff.
How do we keep cost data fresh? A daily rollup is too slow for real-time dashboards.
The three-tier architecture exists specifically to give both. The hourly rollup is fresh within minutes (the per-minute counters flush continuously to it), and the daily rollup is the chargeback source of truth. For real-time dashboards, query the hourly. For chargeback, query the daily.
What about non-LLM costs — embeddings, vector store, fine-tuning?
Embeddings have the same usage shape as inference and the gateway attributes them with the same metadata. Vector store and fine-tuning are typically billed outside the gateway; the chargeback report can join those external line items if your FinOps pipeline ingests them.
How does this work for streaming responses where the final cost isn't known until the stream closes?
The provider span stays open for the full stream and the cost calculation runs at span close, when the final usage block arrives in the trailing chunk. Budget pre-allocation at request start uses a projected upper bound; reconciliation happens at span close.
What about budget enforcement under Redis outage or network partition?
The atomic counter is the source of truth for hard-limit enforcement. If Redis is unreachable, the gateway has two configurable modes: fail open (allow requests, accept the over-spend risk) or fail closed (reject requests, accept the availability hit). The right call depends on workload, and the gateway exposes it as a per-team setting. Soft-limit notifications are best-effort.
Where does TrueFoundry fit?
The X-TFY-METADATA header, the pricing-table maintenance, the streaming aggregation pipeline, and the budget circuit breaker are all part of the TrueFoundry AI Gateway by default. Chargeback exports run as scheduled CSV/JSON/webhook or as an interactive dashboard for budget owners. Pricing tables track provider rate cards and historical traces continue to use the rate in force at the time of the request, so re-running last month's chargeback produces the same number it did last month.
If your LLM workload bills against a shared API key today, the highest-leverage first step is adding the metadata header at every call site, even before you deploy the full attribution pipeline. The header is forward-compatible: the data starts accumulating on traces the moment it is set, and the chargeback report becomes useful the day the rollup tables fire.
Northwind, Sarah, and the specific dollar figures here are illustrative; the data model, the X-TFY-METADATA header design, and the pipeline architecture are how a production AI gateway like TrueFoundry's actually attributes spend. Provider pricing quoted is current as of May 2026 per the providers' public rate cards.
TrueFoundry AI Gateway delivers ~3–4 ms latency, handles 350+ RPS on 1 vCPU, scales horizontally with ease, and is production-ready, while LiteLLM suffers from high latency, struggles beyond moderate RPS, lacks built-in scaling, and is best for light or prototype workloads.




The latest news, articles, and resources sent to your inbox
.webp)


.png)
.png)
.png)
.png)
.png)
.png)