.webp)
July 27, 2026
|
5 min read

Published: June 26, 2026
.webp)
Blazingly fast way to build, track and deploy your models!
LLM systems behave like distributed services. They call multiple model providers. They run across apps and agents. They ship fast and they change often. This makes debugging hard when a user reports a bad answer or a slow response.
The missing piece is a single execution boundary that every request crosses. Once you have that boundary you can apply policy. You can standardize routing. You can capture clean traces for every call.
TrueFoundry AI Gateway gives you that boundary. New Relic gives you a place to explore those traces alongside the rest of your application telemetry. With OpenTelemetry as the shared format you can export gateway traces to New Relic in a few minutes.
TrueFoundry AI Gateway sits in front of your model traffic. Apps and agents send requests to the gateway. The gateway forwards to the right provider and model. This creates one governed entry point for routing and controls. It also creates one consistent point where traces can be generated and exported.
New Relic is an observability platform that supports full stack monitoring and application performance monitoring with real time analytics. It can ingest OpenTelemetry data. This makes it a natural place to analyze LLM traces from the gateway with the same workflows you already use for services and infrastructure.
The integration is based on OpenTelemetry. TrueFoundry AI Gateway exports traces using standard OpenTelemetry protocols. New Relic accepts OTLP ingestion. This keeps the integration clean and avoids tight coupling.
You configure an OpenTelemetry traces exporter in the TrueFoundry AI Gateway UI. You point it to a New Relic OTLP traces endpoint. You add the right authentication header using a New Relic ingest license key generated from the OpenTelemetry integration in New Relic.
Once enabled the gateway continues to generate traces for its own monitoring views. Export is additive. It forwards the same traces to New Relic so you can analyze them there as well.
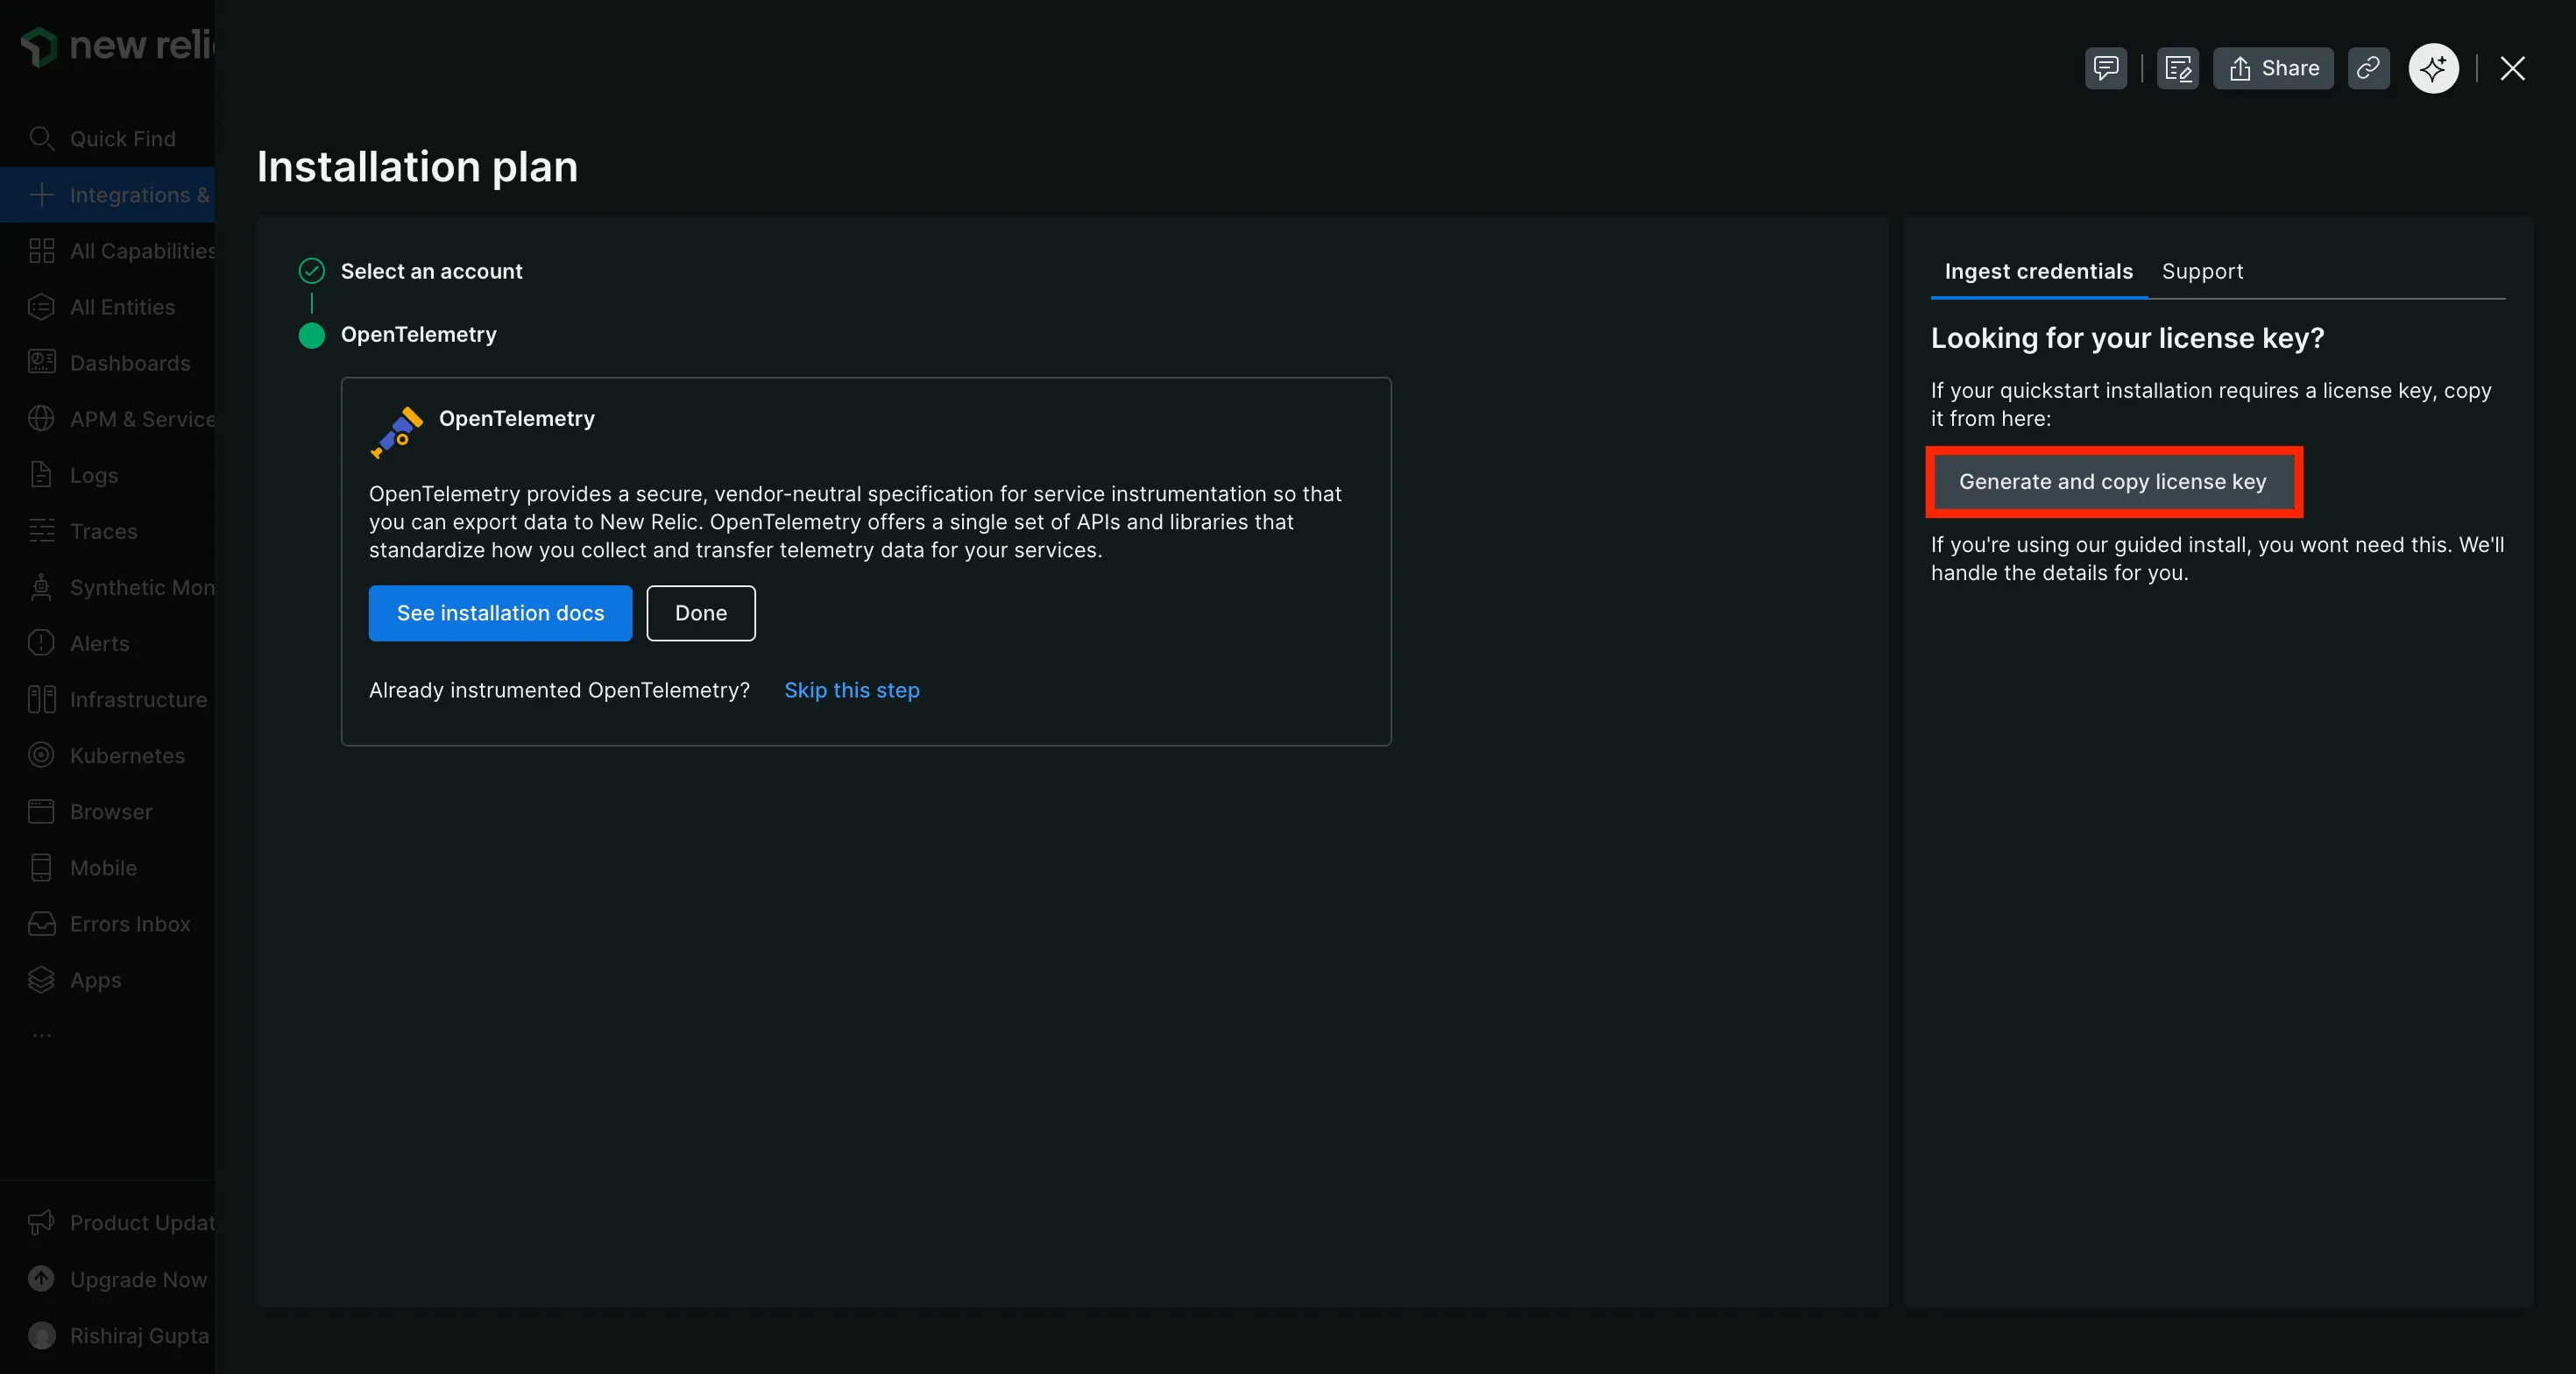
Open your New Relic dashboard. Go to Integrations and Agents. Search for OpenTelemetry and open that integration. In the installation plan find the ingest credentials area and generate the license key.
Use the ingest license key from the OpenTelemetry integration page. A regular New Relic API key will not work for OTLP ingestion.
In the TrueFoundry dashboard go to AI Gateway then Controls then Settings. Scroll to the OTEL Config section and edit the exporter configuration.
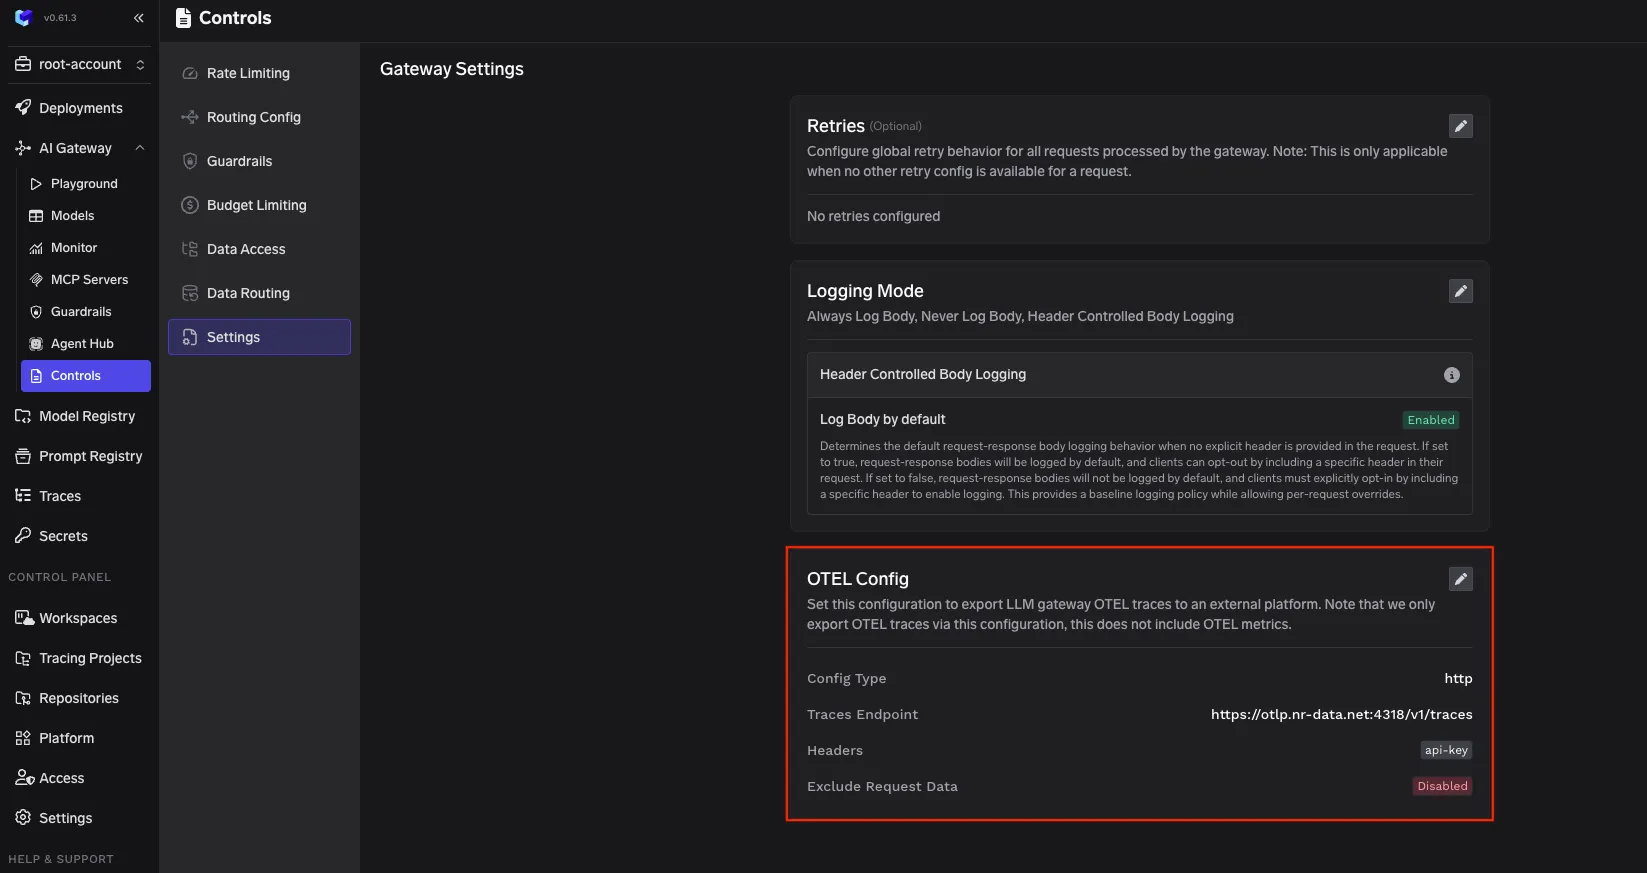
Enable the traces exporter and fill the core fields.
Config type
http
Traces endpoint for US region
https://otlp.nr-data.net:4318/v1/traces
Encoding
Json
New Relic uses regional endpoints. If your account is in the EU region use this endpoint instead.
https://otlp.eu01.nr-data.net:4318/v1/traces
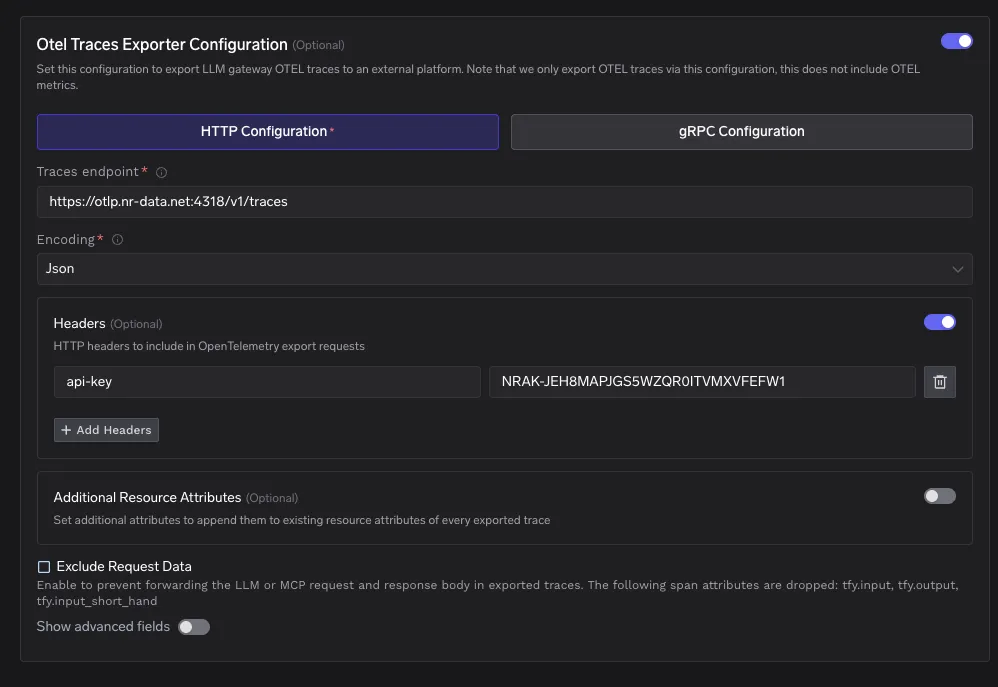
Add a header with this key and your ingest license key as the value.
api-key: <your New Relic ingest license key>
Save the configuration. Then send a few LLM requests through AI Gateway. After this the gateway will export traces to New Relic automatically.
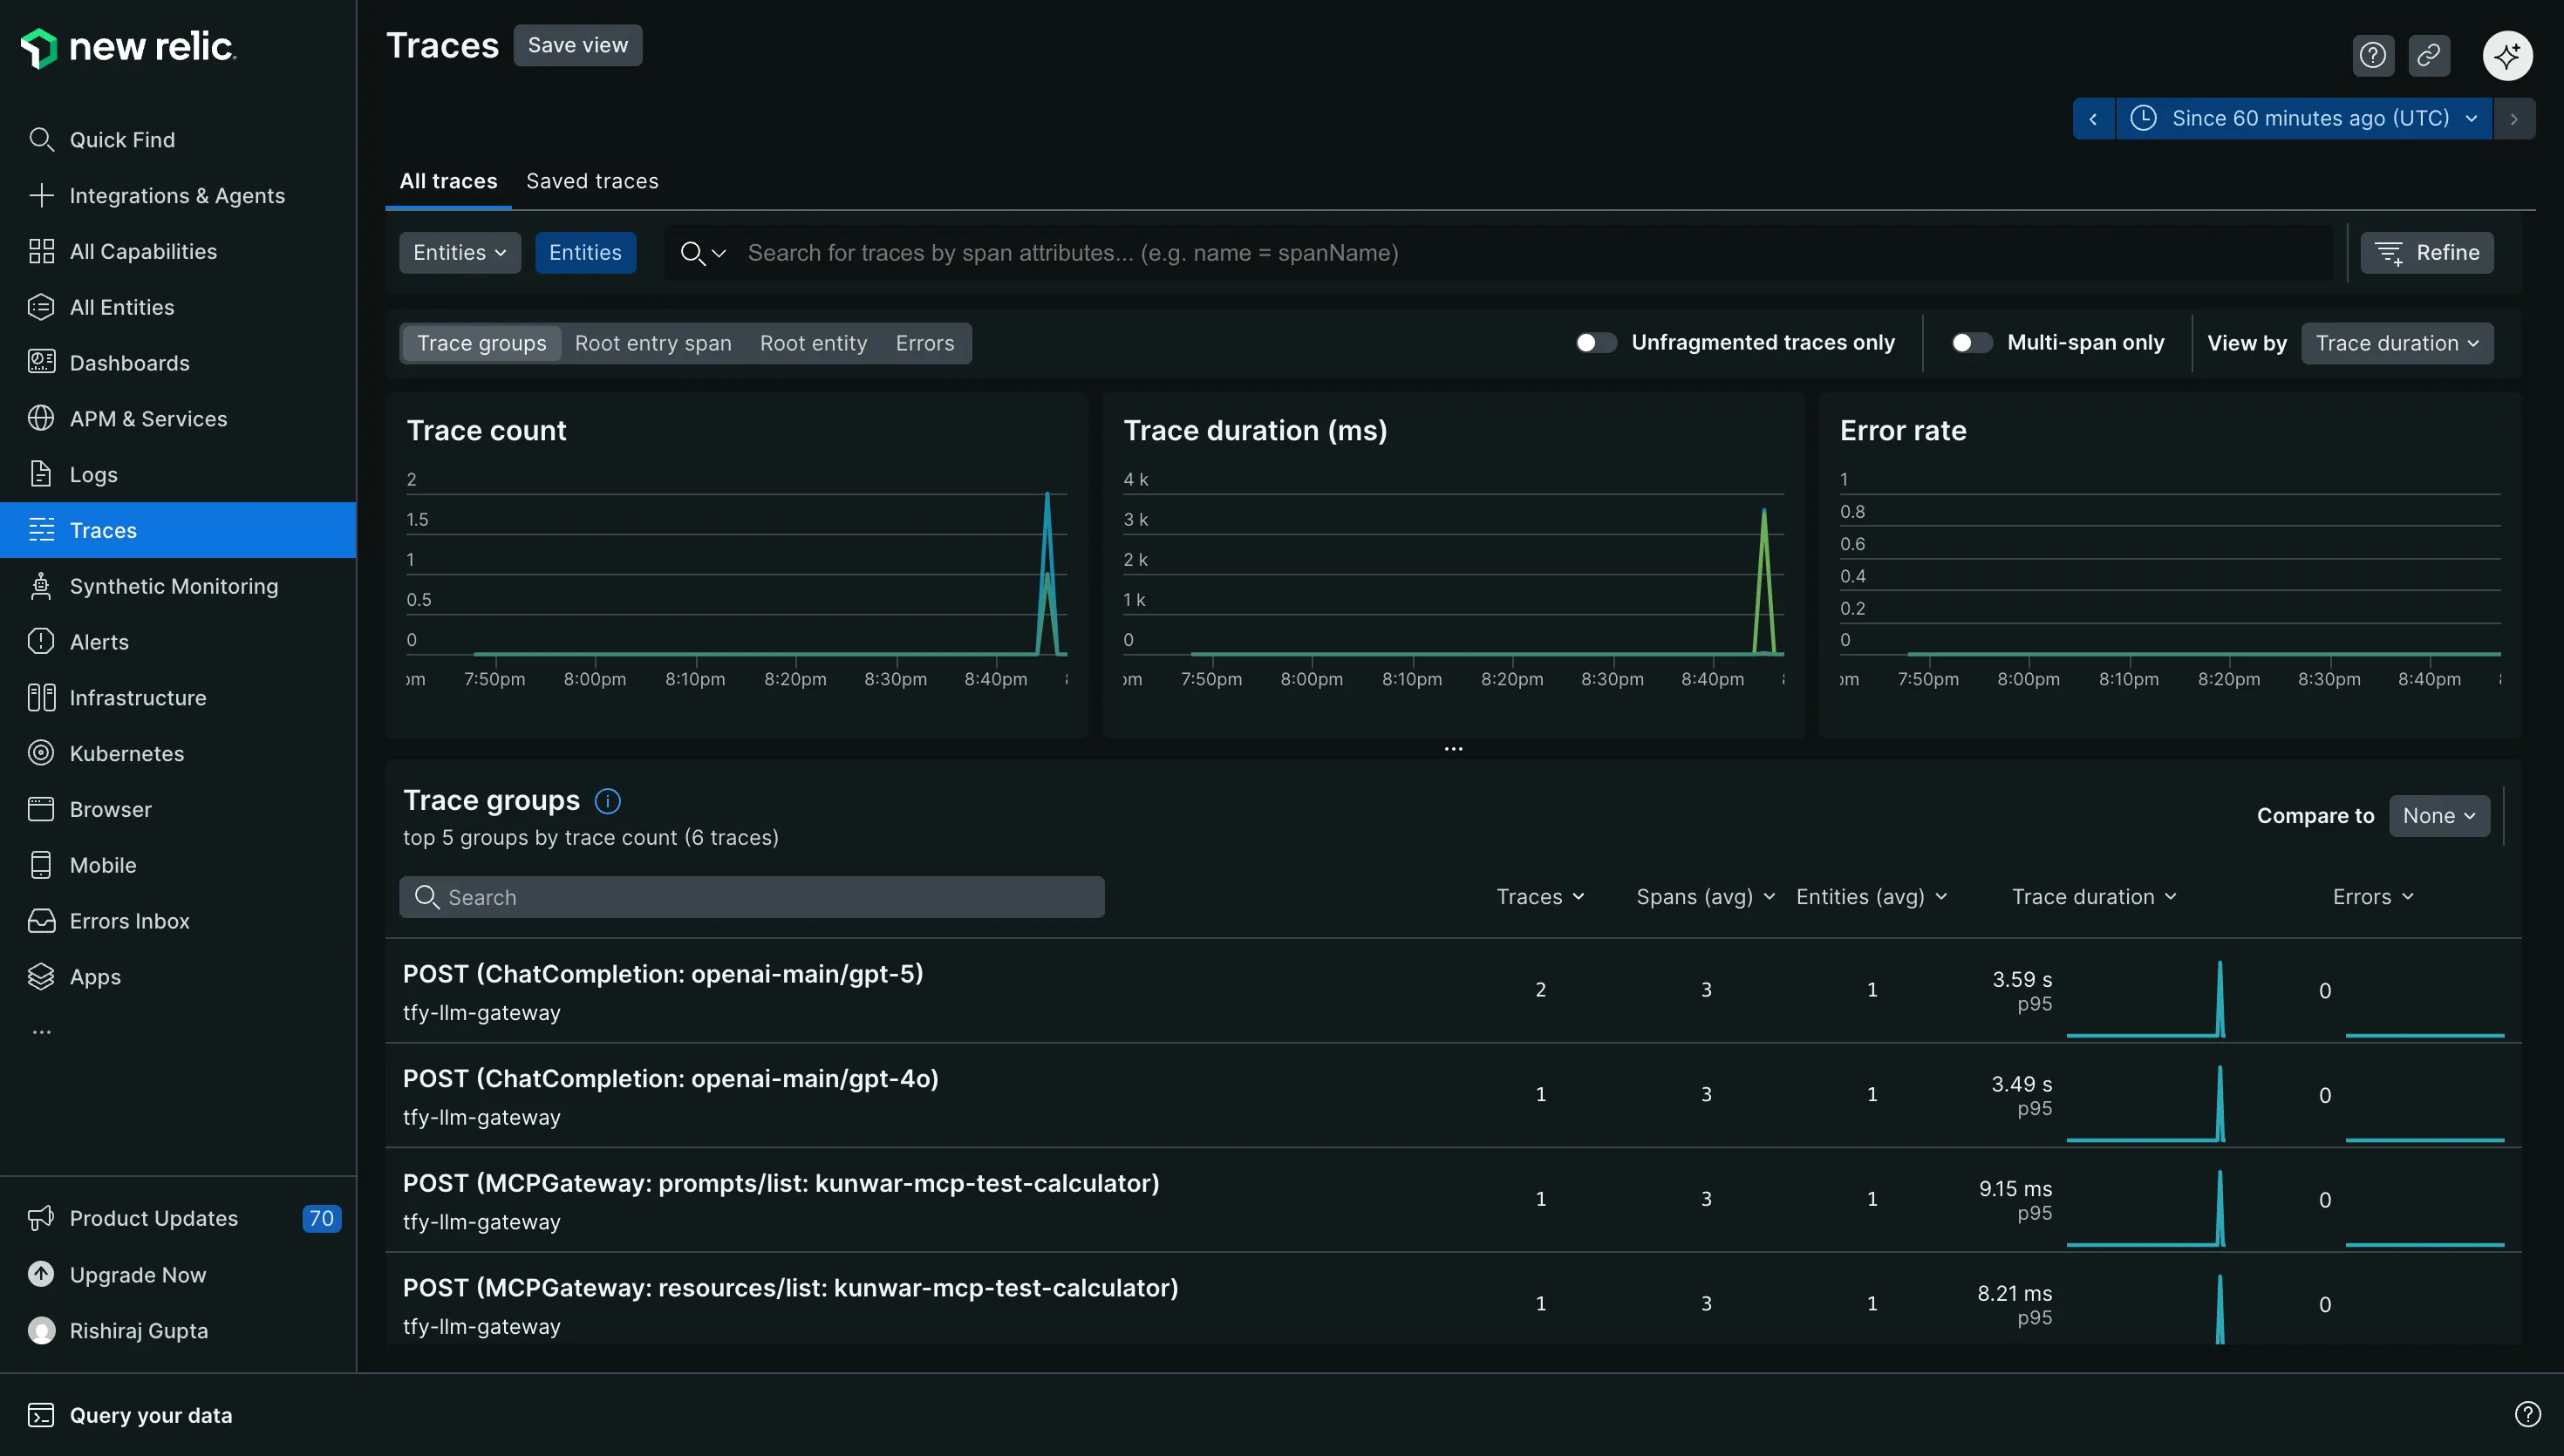
In New Relic go to Traces and look for traces from the gateway service. Then open a trace and inspect spans for the model call path and timing.
You can view LLM traces next to the rest of your telemetry. This helps when an LLM issue is actually an upstream latency spike. It also helps when a model provider slowdown is only one part of a wider incident.
You can build dashboards that track latency and volume for LLM traffic. You can create alerts for spikes in latency or error rates. You can correlate trace behavior with logs and infrastructure signals during an incident.
Pick the endpoint that matches your New Relic region. This is the most common cause of missing traces. If you want richer filtering in New Relic add additional resource attributes in the exporter config. Use these attributes for environment and team level grouping.
New Relic supports both HTTP and gRPC for OTLP ingestion. If you need higher throughput you can consider gRPC. If you want easier inspection during setup HTTP with JSON encoding is a simple starting point.
A reliable LLM system needs a reliable place to enforce controls and a reliable place to understand behavior. TrueFoundry AI Gateway provides a single execution boundary for all model traffic. New Relic provides a mature observability workflow for exploring traces and responding to incidents. OpenTelemetry connects the two with a standard export path.
If you already use New Relic for your services this integration lets your LLM traffic join the same operational loop with minimal change to your application code.
TrueFoundry AI Gateway delivers ~3–4 ms latency, handles 350+ RPS on 1 vCPU, scales horizontally with ease, and is production-ready, while LiteLLM suffers from high latency, struggles beyond moderate RPS, lacks built-in scaling, and is best for light or prototype workloads.


The latest news, articles, and resources sent to your inbox
.webp)
.webp)
.png)
.webp)
.webp)