


What Is Grafana and Why Does It Matter?

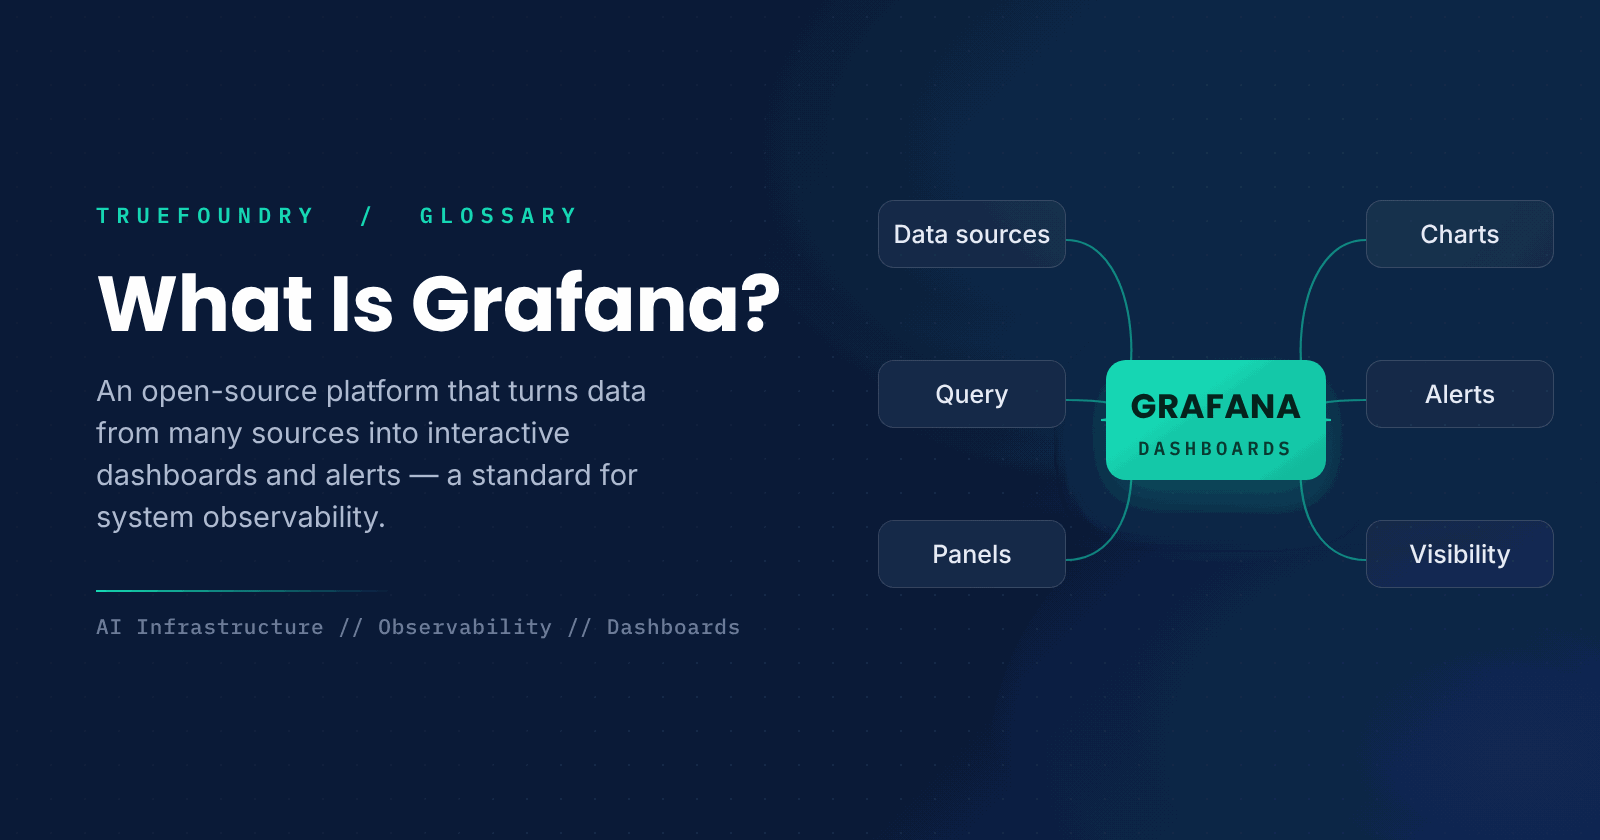
Running any serious system means watching a flood of numbers: request rates, latencies, error counts, resource usage, and more. Raw metrics in a database are hard to make sense of. Grafana turns them into dashboards, letting teams see at a glance how a system is behaving and spot trouble before it becomes an outage.
Grafana has become one of the most widely used observability tools because it is open source, flexible, and connects to almost any data source. For AI and ML infrastructure in particular, where teams track GPU usage, model latency, and throughput, Grafana is a common way to bring all those signals into one view.
This guide explains what Grafana is, how it works, how it fits with the data sources it visualizes, and when to use it.
What is Grafana?
Grafana is an open-source analytics and monitoring platform that lets you query, visualize, and alert on data from many different sources. It does not usually store data itself; instead it connects to databases and monitoring systems and presents their data as interactive dashboards built from panels like time-series charts, gauges, and tables.
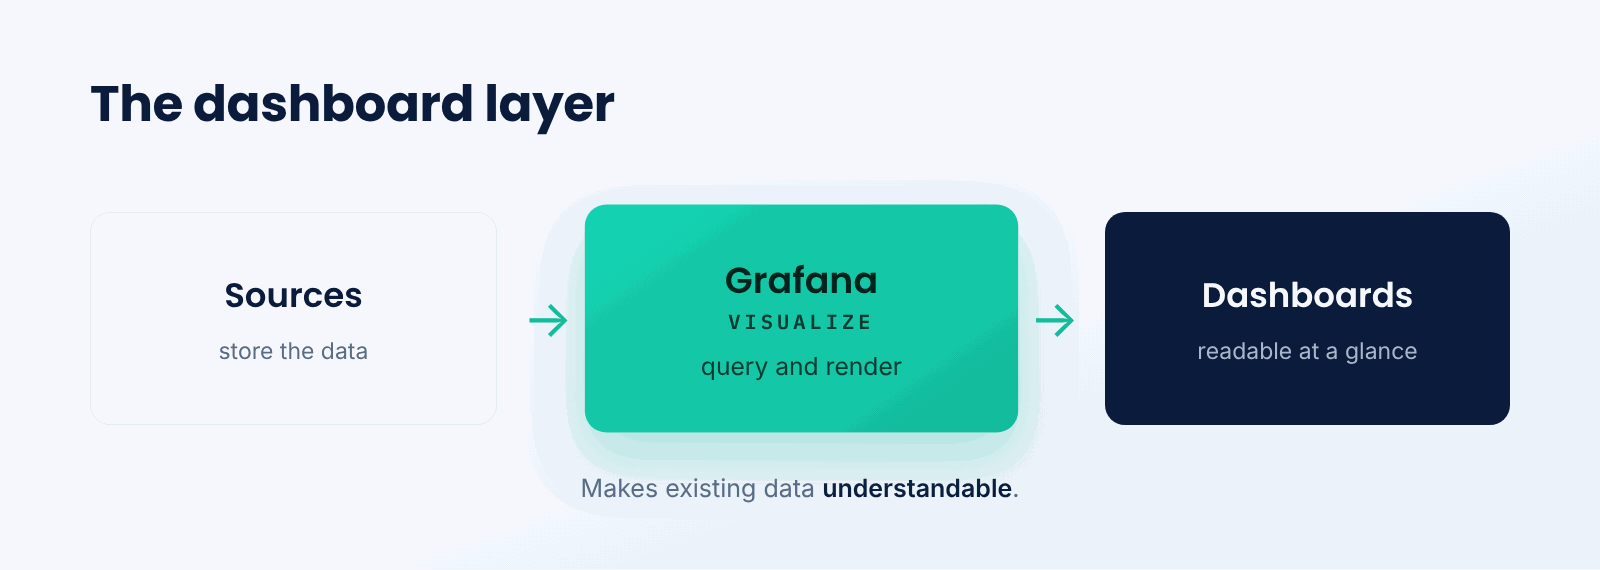
Think of it like the dashboard of a car. The car's sensors gather data from the engine, fuel system, and wheels, and the dashboard presents it as clear gauges and warning lights you can read at a glance. Grafana is the dashboard for your systems, drawing on data sources and showing their state in a readable form.
The key idea is visualization and alerting on top of existing data. Grafana's job is not to collect or store metrics but to make whatever data you already have understandable and actionable through dashboards and alerts.
How does Grafana work?
Grafana sits on top of your data sources and renders their data into dashboards.
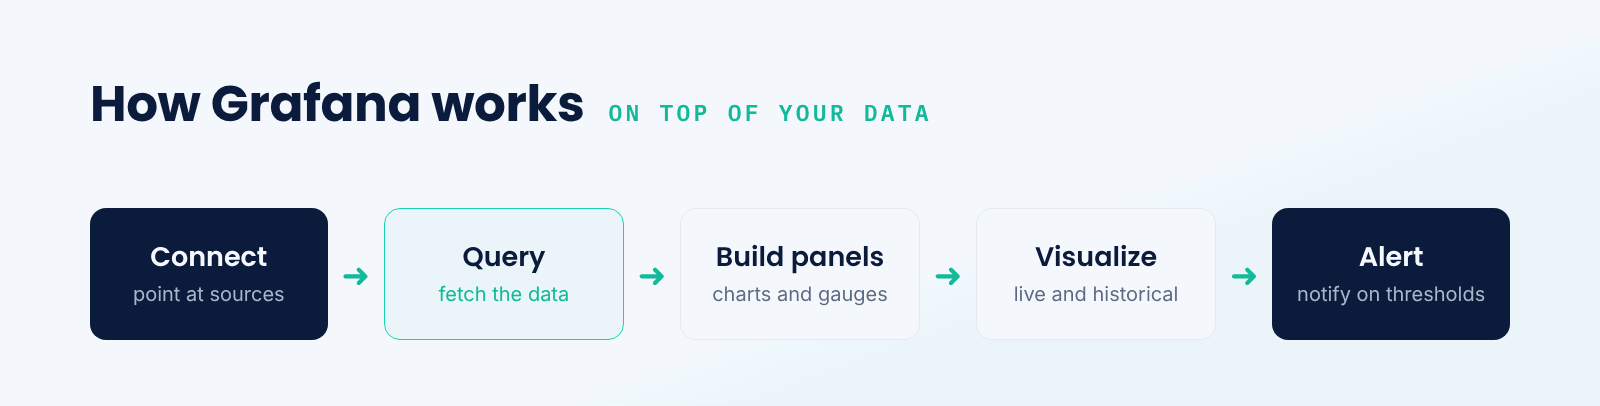
- Connect data sources. Point Grafana at databases and monitoring systems.
- Query. Dashboards query those sources for the data they display.
- Build panels. Arrange charts, gauges, and tables into dashboards.
- Visualize. View live and historical data updating in real time.
- Alert. Define rules that notify you when metrics cross thresholds.
Because Grafana queries sources on demand rather than storing their data, it stays a flexible visualization layer. You can mix panels backed by different sources on one dashboard, giving a unified view of a system assembled from many underlying tools.
Grafana vs. its data sources
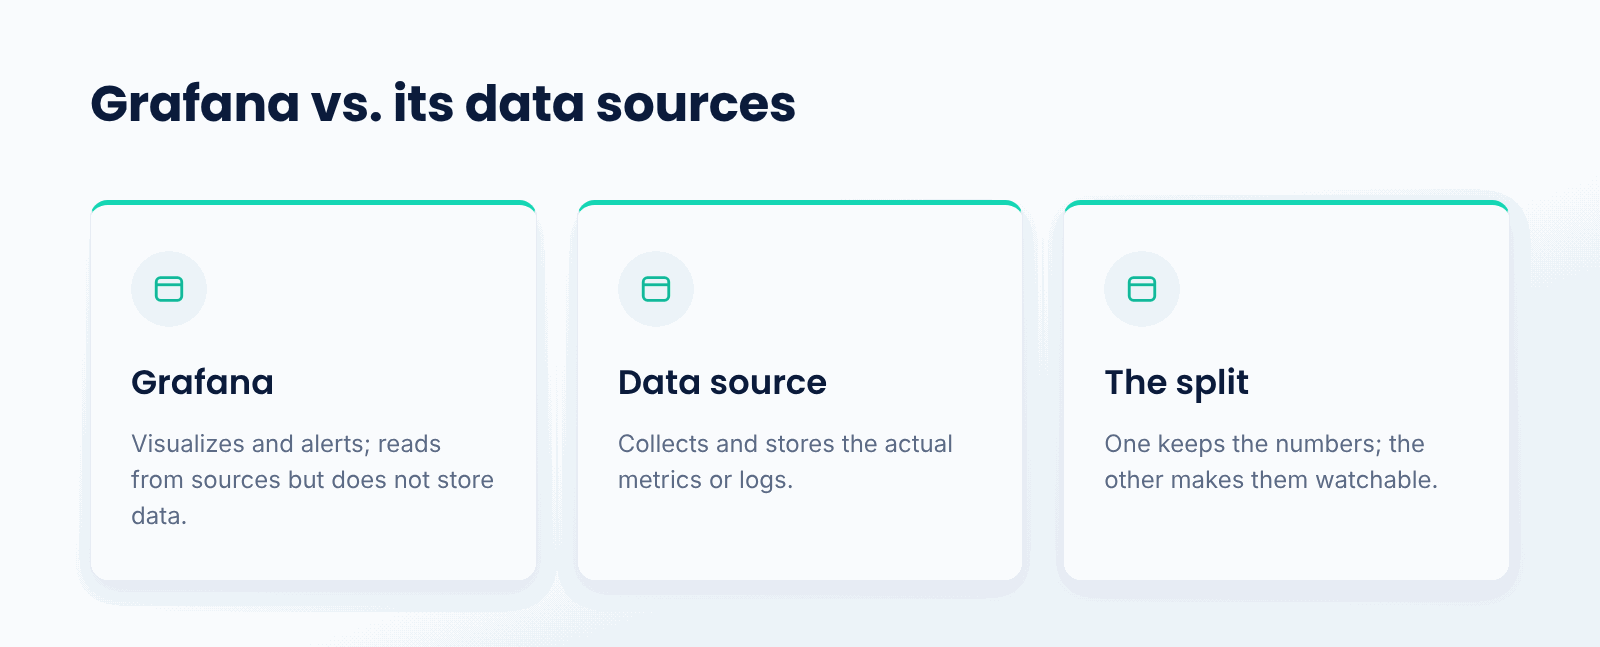
It helps to separate roles. A data source like a time-series database collects and stores the actual metrics. Grafana is the visualization and alerting layer that reads from those sources and presents the data. One gathers and keeps the numbers; the other makes them understandable and watchable.
This separation is why Grafana works with so many systems. Rather than replacing your metrics or logging stack, it sits above it, so you can keep your existing sources and still get consistent dashboards and alerts across all of them in one place.
Why does Grafana matter?
- Visibility. It makes system health and performance easy to see.
- Unified view. It brings many data sources into one dashboard.
- Alerting. It notifies teams when something goes wrong.
- Open and flexible. It is open source and highly customizable.
- Broad support. It connects to a wide range of data sources.
What are the tradeoffs?
- Not a data store. It needs separate systems to collect and store data.
- Setup. Building good dashboards and alerts takes effort.
- Dependency. Its value depends on the quality of the underlying data.
- Learning curve. Querying and configuring panels takes some practice.
When should you use Grafana?
Use it whenever you need to monitor systems and want clear, customizable dashboards and alerts over data you are already collecting. It is a natural fit for infrastructure, application, and ML observability, where many metrics from different sources need to be watched together.
If you have no metrics being collected yet, Grafana alone is not enough; you first need data sources feeding it. But once you are gathering metrics and logs, Grafana is one of the most popular and capable ways to make that data visible and actionable.
Key points about Grafana
- Grafana is an open-source dashboard and monitoring platform.
- It visualizes and alerts on data from many sources.
- It connects to data sources rather than storing data itself.
- It builds dashboards from panels like charts and gauges.
- It is widely used for infrastructure and ML observability.
- Its value depends on the quality of the underlying data.
Conclusion
Grafana is an open-source platform that turns data from many sources into interactive dashboards and alerts, making the health and performance of systems easy to see. Because it sits on top of existing data sources rather than storing data itself, it provides a unified, flexible view across an entire stack, which is why it is a standard tool for infrastructure and AI observability. Its usefulness rests on the quality of the data feeding it.
TrueFoundry helps teams deploy and observe AI systems on their own infrastructure, and integrates with tools like Grafana so metrics such as GPU usage and model latency are visible in familiar dashboards. For watching the health of AI infrastructure, Grafana is a common and powerful choice.

Govern, Deploy and Trace AI in Your Own Infrastructure
Frequently Asked Questions
What is Grafana in simple terms?
Grafana is an open-source dashboard builder that visualizes and monitors data by querying your databases and monitoring systems and representing their metrics and logs as charts, graphs, and alerts on an intuitive interface, so you can see how your systems are doing at a glance.
Does Grafana store data?
No, usually not. Grafana is a visualization and monitoring layer that integrates with independent data sources. The source collects and stores the metrics; Grafana consumes and visualizes them. Time-series databases are one type of such source, which explains the compatibility Grafana offers with so many backends.
What can Grafana connect to?
A wide range: time-series databases, logging tools, SQL databases, cloud monitoring services, and more, all feeding observability platforms like Grafana. It supports panels from multiple data sources within a single dashboard, bringing together disparate tool outputs into a cohesive view.
What is Grafana used for?
Observing system health and performance via dashboards and alerting. Infrastructure, application, and machine learning observability all involve monitoring metrics like request volume, latency, error rate, GPU utilization, and model performance in a single view.
Do I need other tools with Grafana?
Yes. Grafana visualizes data but never collects or stores any itself, so you need separate data source components providing metrics and logs. Provided you have those, Grafana translates their data streams into readable dashboards and actionable alerts.


- © 2022 ENSEMBLE Technologies



Subscribe to our newsletter
The latest news, articles, and resources sent to your inbox


