


What Is Distributed Tracing and Why Does It Matter?

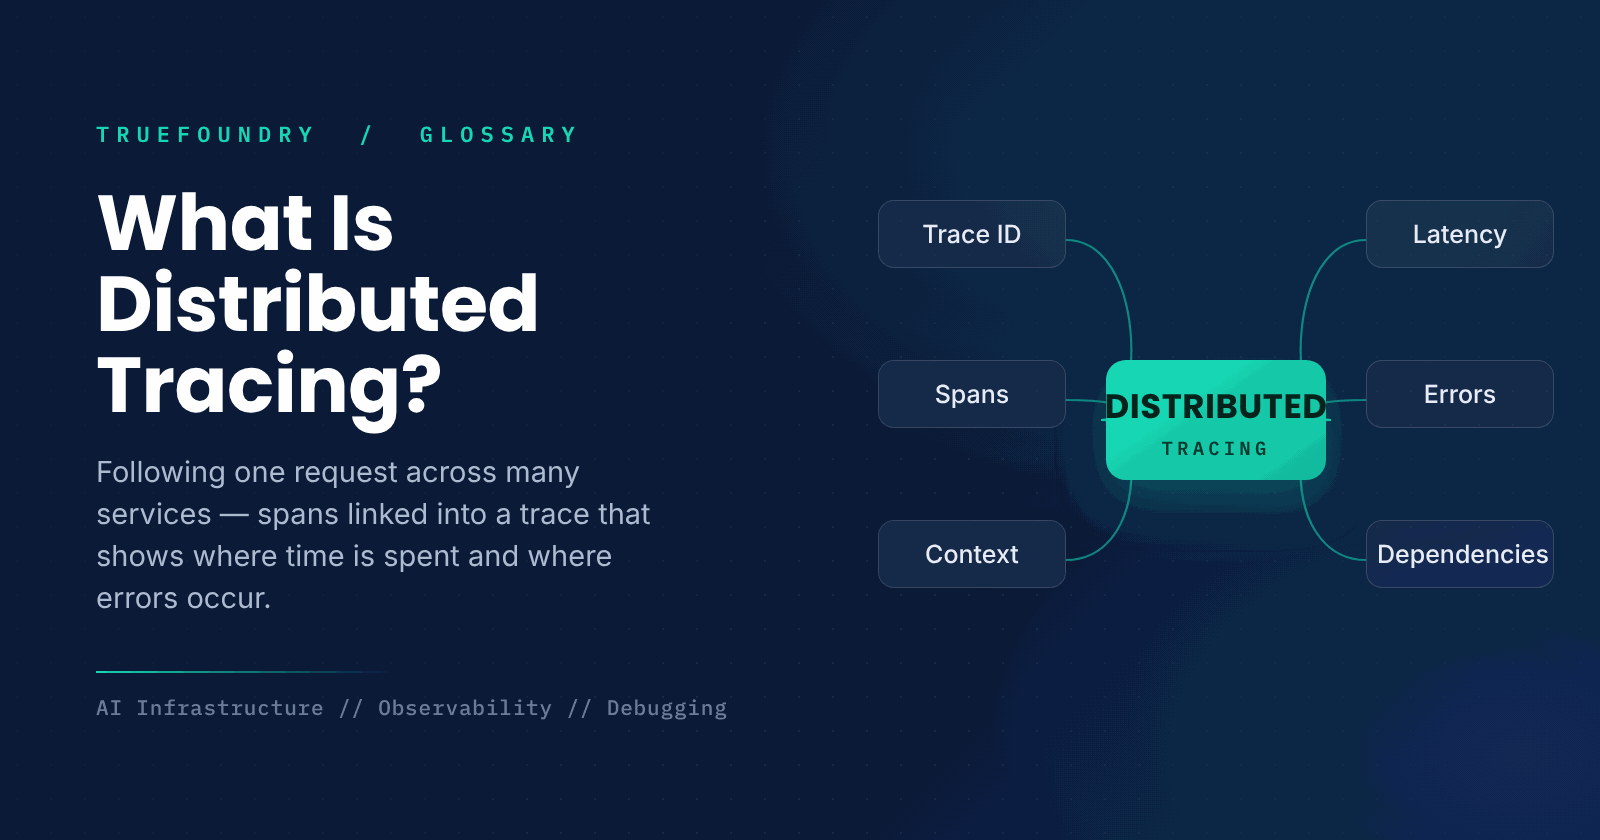
In a system made of many services, a single user request might pass through a dozen of them before a response comes back. When something is slow or broken, logs from one service rarely tell the whole story. Distributed tracing solves this by following each request end to end, across every service it touches.
As applications moved from monoliths to microservices, and as AI systems grew into multi-step pipelines of models, retrievers, and tools, understanding behavior across service boundaries became critical. Distributed tracing gives that cross-service visibility, making it possible to see exactly where a request spent its time and where it went wrong.
This guide explains what distributed tracing is, how traces and spans work, how it differs from logging and metrics, and why it matters.
What is distributed tracing?
Distributed tracing is a method of tracking a request as it flows through the components of a distributed system. Each operation along the way, a service call, a database query, a model inference, is recorded as a span with timing and metadata. The spans for one request are linked into a single trace that shows the request's full path.
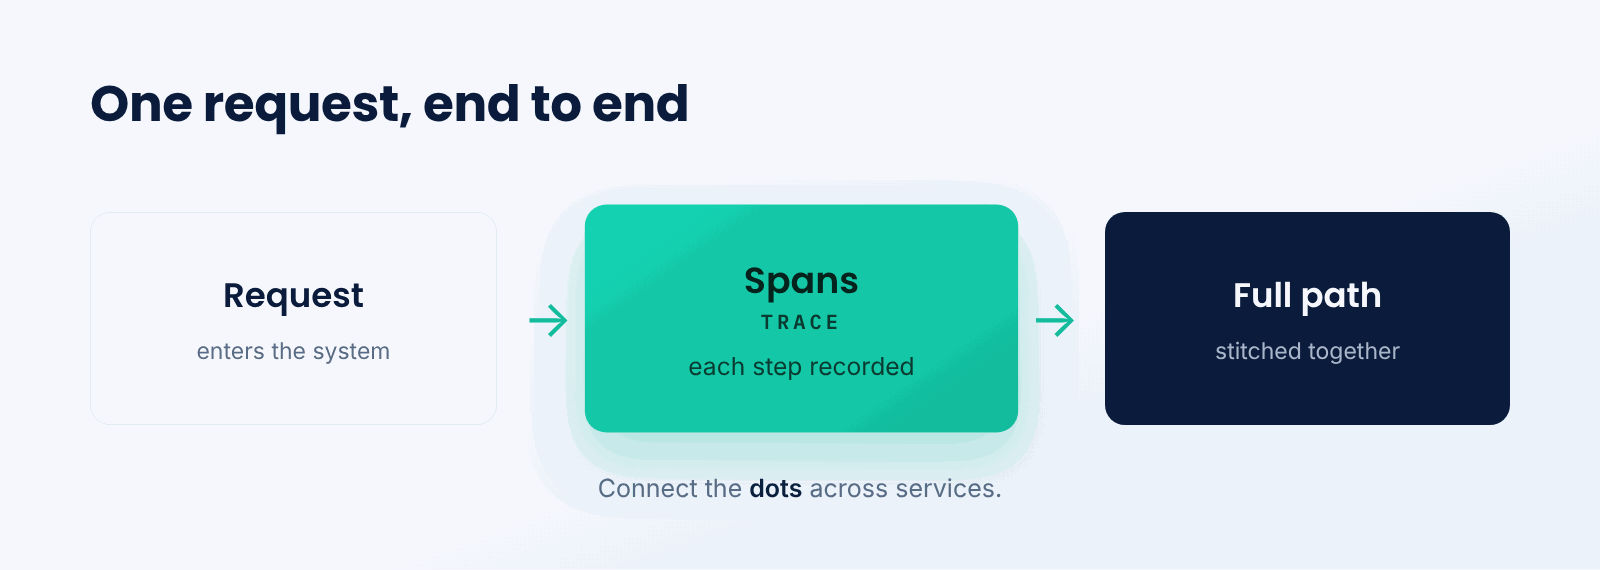
Think of it like tracking a parcel across a delivery network. Each facility it passes through scans it with a timestamp, and together those scans show the full journey: where it went, how long each leg took, and where it got stuck. A trace does the same for a request moving through services.
The key idea is connecting the dots across services. Instead of isolated logs in each component, a trace stitches the whole journey together, so you can see the request as a single, coherent flow rather than scattered fragments.
How does distributed tracing work?
Tracing works by tagging each request and recording spans as it moves through the system.
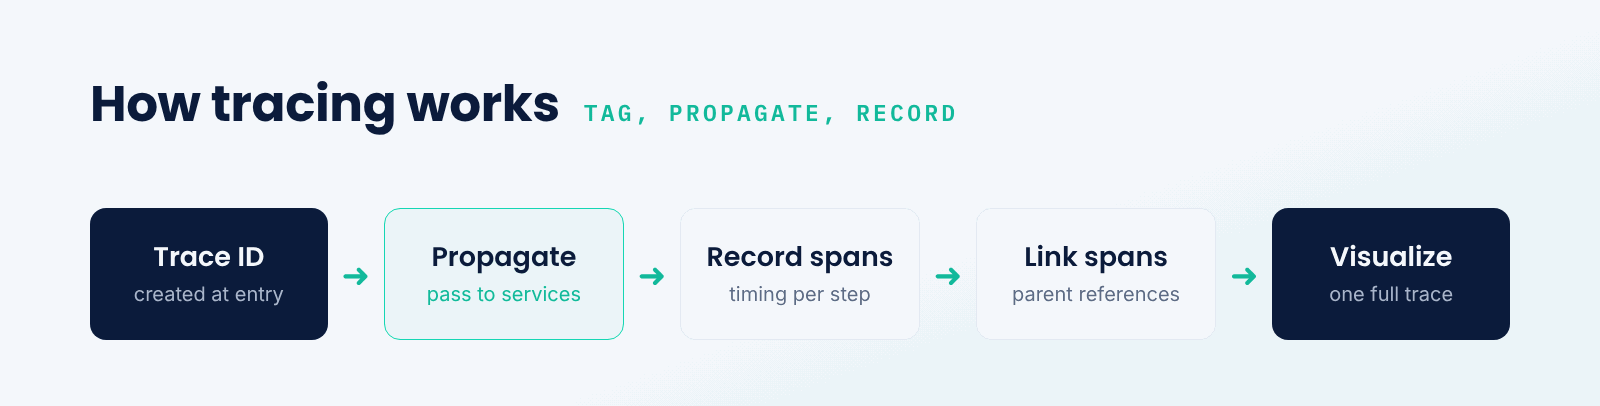
- Assign a trace ID. A unique ID is created when the request enters the system.
- Propagate context. That ID is passed along to every downstream service.
- Record spans. Each operation records a span with its timing and metadata.
- Link spans. Spans reference their parent, forming a tree for the trace.
- Collect and view. Spans are gathered and visualized as one end-to-end trace.
The critical mechanism is context propagation: passing the trace ID across service boundaries so all the spans can be tied back to the same request. Without it, each service's spans would be disconnected. With it, the full path reassembles into a single trace.
Tracing vs. logging vs. metrics
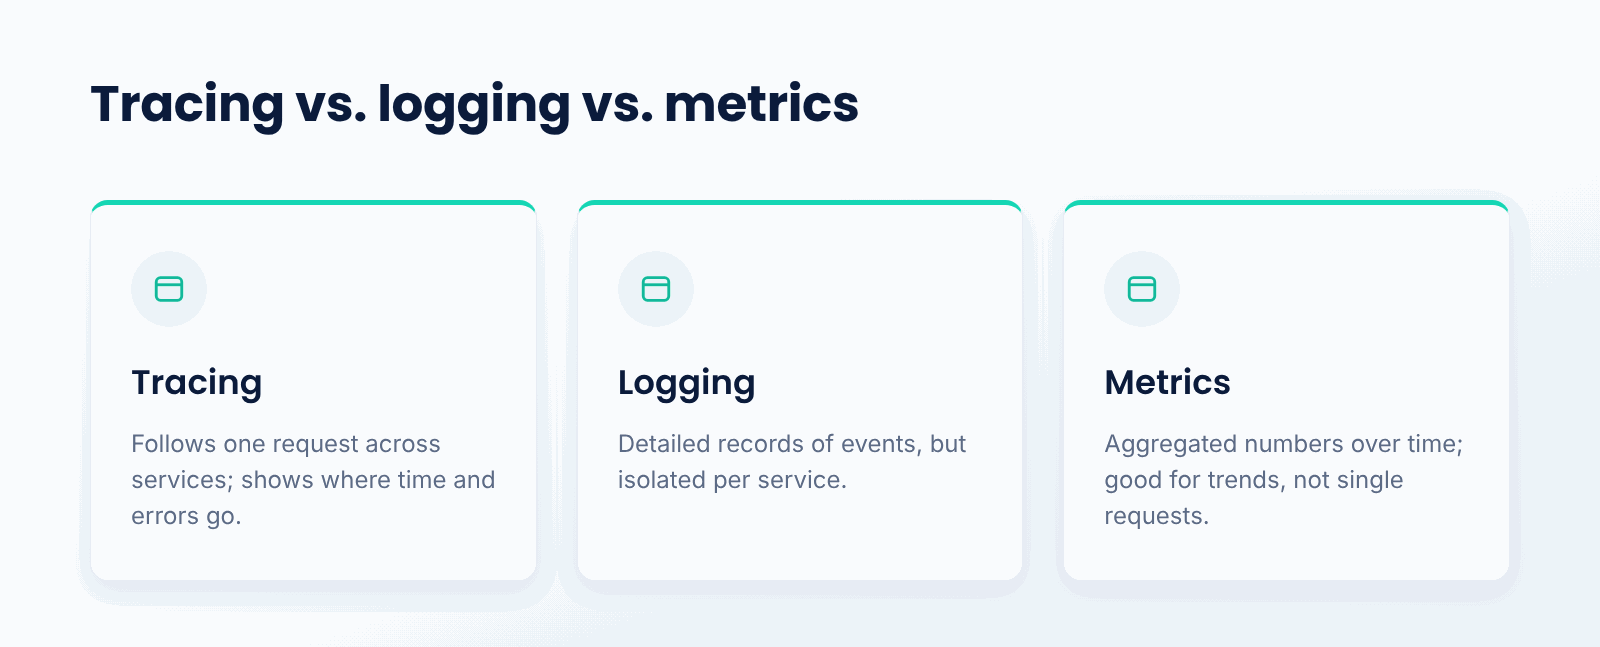
These three are the pillars of observability. Logs are timestamped records of discrete events, rich in detail but isolated per service. Metrics are aggregated numbers over time, like request rates and latencies, good for trends but not individual requests. Traces follow a single request across services, showing how its time and errors are distributed along the path.
They complement each other. Metrics tell you something is wrong and when, traces tell you where in the request flow the problem is, and logs give the detailed context at that point. Together they let you move from noticing an issue to pinpointing and understanding it.
Why does distributed tracing matter?
- Cross-service visibility. It shows a request's full path through the system.
- Latency debugging. It reveals exactly where time is being spent.
- Error localization. It pinpoints which service caused a failure.
- Dependency insight. It makes service interactions visible.
- AI pipelines. It traces requests through chains of models and tools.
What are the tradeoffs?
- Instrumentation. Services must be instrumented to emit spans.
- Overhead. Collecting and storing traces adds some cost.
- Sampling. High-volume systems often trace only a fraction of requests.
- Context discipline. Trace context must be propagated consistently to be useful.
When should you use distributed tracing?
Use it whenever requests span multiple services or steps and you need to understand performance and failures across them, which describes microservice architectures and multi-stage AI pipelines. It is most valuable when debugging latency or errors that no single service's logs can explain on their own.
For a simple, single-service application, tracing adds less value, and logs plus metrics may suffice. But as soon as a request fans out across components, distributed tracing becomes the tool that makes the system's behavior understandable.
Key points about distributed tracing
- It follows one request across many services.
- Spans record individual operations; linked spans form a trace.
- Context propagation ties spans to the same request.
- It complements logs and metrics in observability.
- It is essential for microservices and AI pipelines.
- High-volume systems often sample traces to control cost.
Conclusion
Distributed tracing follows a single request through every service it touches, recording each step as a span and linking them into one trace. This cross-service view shows where time is spent and where errors occur, making it essential for debugging microservices and multi-step AI pipelines. Together with logs and metrics, it turns a tangle of services into an understandable system.
TrueFoundry helps teams deploy and observe AI systems on their own infrastructure, with tracing that follows requests through chains of models, retrievers, and tools. When requests span many components, distributed tracing is what makes performance and failures visible.

Govern, Deploy and Trace AI in Your Own Infrastructure
Frequently Asked Questions
What is distributed tracing in simple terms?
Tracing is precisely the method of choosing one request and watching it as it traverses multiple services within a deployment. Timing data logs each step along the way, linking them all into one continuous trace, so you have everything needed to understand how long it takes, where bottlenecks occur, and where failure points emerge.
What are spans and traces?
A span is an atomic record of an individual operation, such as a service invocation or database query, including its timing data and context attributes. A trace is the linked spans for a single request, forming a hierarchical tree that maps the entire course of the request from entry to exit.
How is tracing different from logging?
Logs describe specific events in fine detail but remain segmented by service boundaries. Traces stitch together all the operations of a single request across multiple services. Logs provide context at a moment; traces show the complete journey, and the two are used together.
What is context propagation?
Context propagation is passing the trace ID along the request path, so those individual service spans have enough metadata to trace all the way back to the originating request. Strip it away, and each service operates independently; with it, the full path reassembles into a single coherent trace.
Why is tracing important for AI systems?
Because AI applications frequently chain multiple models, retrieval systems, and tools within one request. Tracing follows those requests along their journey, revealing where latency builds up and which step failed, which is difficult to infer from any individual component's logs alone.


- © 2022 ENSEMBLE Technologies



Subscribe to our newsletter
The latest news, articles, and resources sent to your inbox


