


What Is Data Drift and Why Does It Matter?

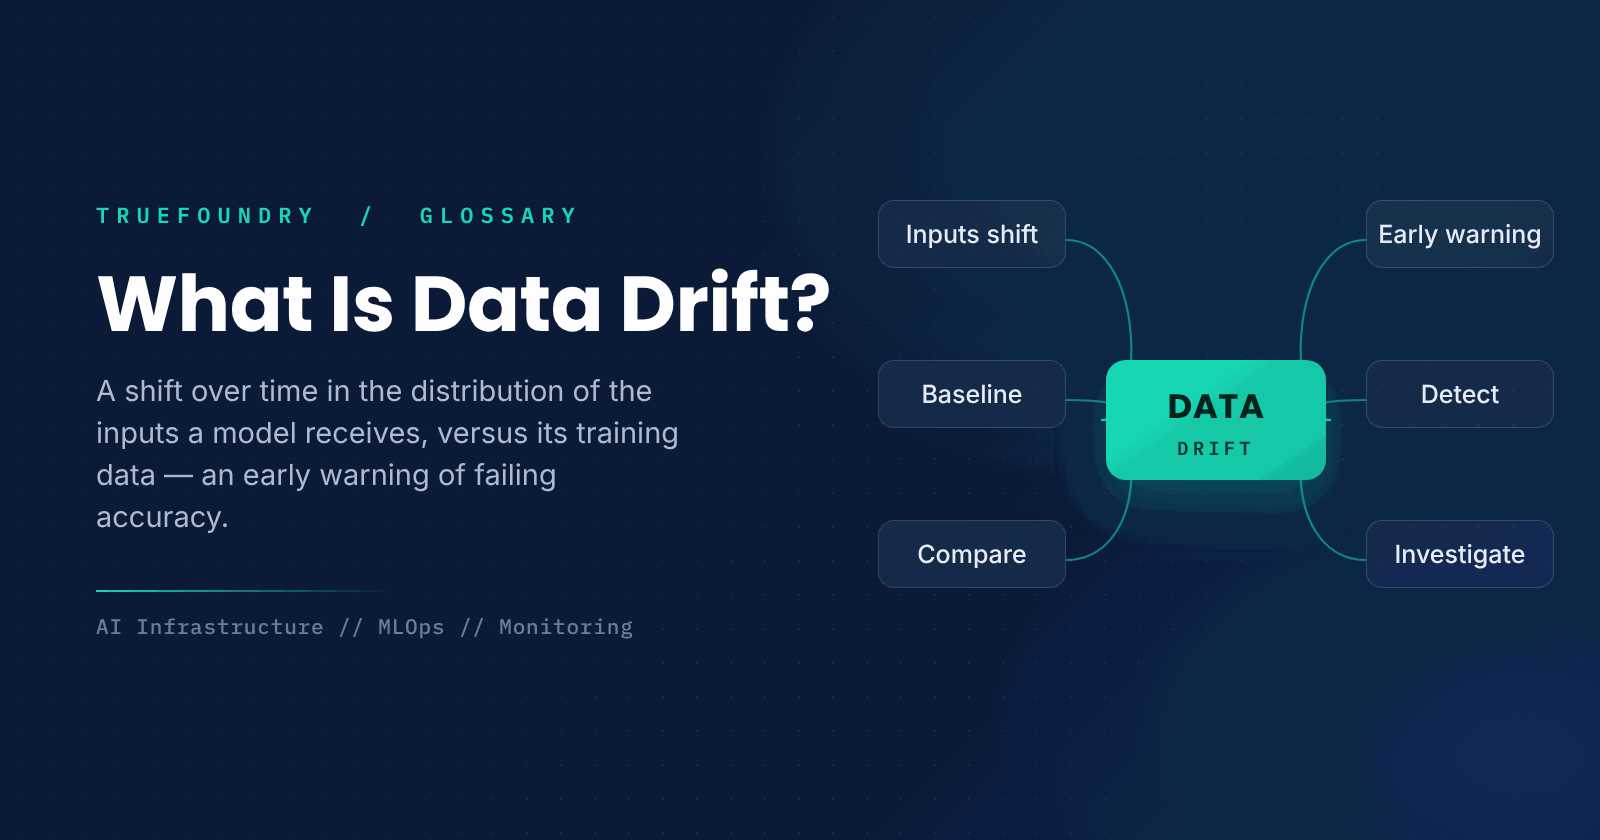
Data drift refers to the change over time in the distribution of input data received by a model in production, relative to its training data. The underlying relationships might persist while the inputs drift, impacting accuracy along the way, which is why watching input distributions acts as an early-warning system for failing models.
Data drift essentials
- Data drift describes a change in the statistical properties of input data over time.
- It evaluates live production traffic against the training distributions.
- It can reduce the model's accuracy even when the relationships stay constant.
- It is detected by monitoring input distributions.
- It often appears before performance degradation visibly impacts end users.
A model learns the patterns in its training data and assumes the data it sees later looks similar. But inputs change over time: a new customer segment arrives, a sensor is recalibrated, a feature's typical values shift. When the production data stops resembling the training data, the model is operating on unfamiliar ground. That shift is data drift.
Data drift matters because it often precedes a drop in model performance. By watching how input distributions change, teams can catch trouble early, sometimes before accuracy visibly suffers, making drift detection one of the most useful signals in production monitoring.
This guide explains what data drift is, what causes it, how it differs from concept drift, and how to detect and respond to it.
What is data drift?
Data drift is a change in the statistical distribution of a model's input data between training and production. The features the model receives take on different values, ranges, or frequencies than they did during training, so the model is increasingly asked to make predictions on data unlike anything it learned from.
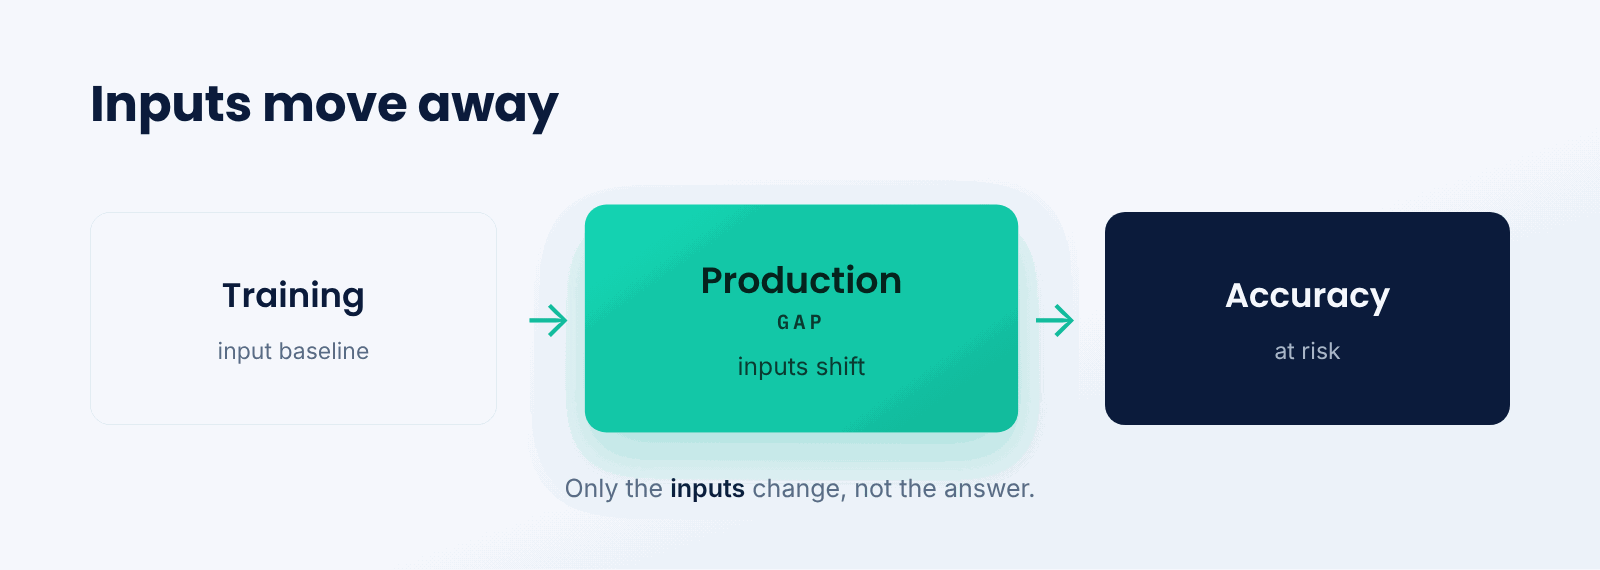
Think of it like a tailor who fits suits based on a population's measurements. If the population's typical build gradually changes, the tailor's assumptions stop fitting, even though their skill is unchanged. A model is the tailor, the measurements are the input data, and data drift is the slow shift in those measurements.
The key idea is that only the inputs are changing, not necessarily the correct answer. Even if the true relationship between inputs and output still holds, feeding the model unfamiliar inputs can push it into regions where it was never well trained, hurting accuracy.
What causes data drift?
Data drift has many ordinary causes, most of them simply the world changing.
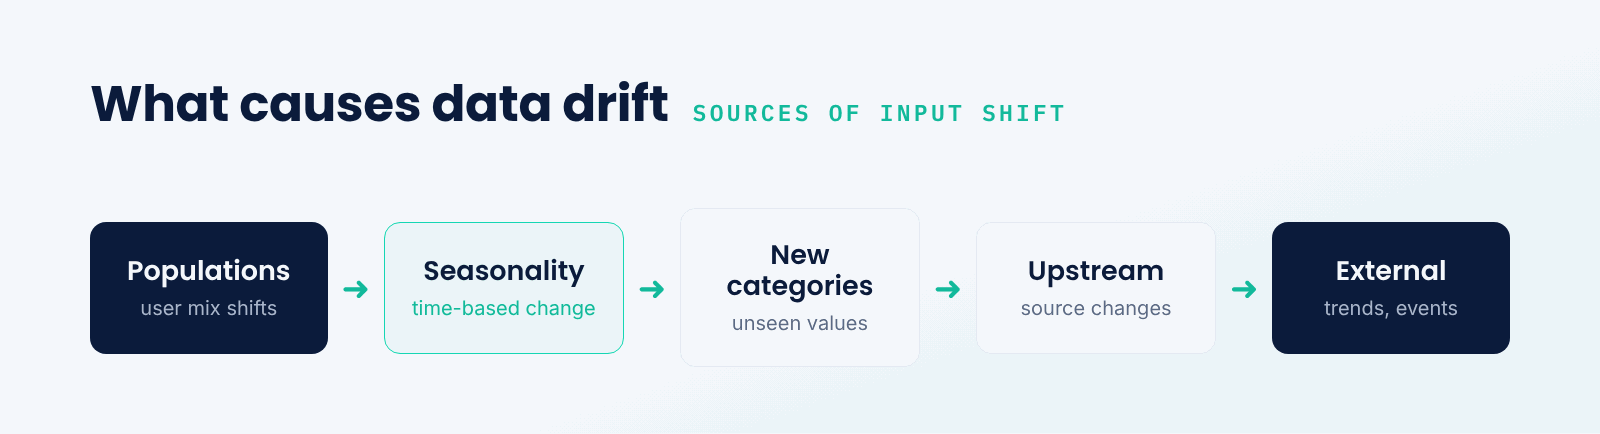
- Changing populations. The mix of users or items shifts over time.
- Seasonality. Inputs vary with time of year, week, or day.
- New categories. Values or classes appear that were rare or absent in training.
- Upstream changes. A data source, sensor, or pipeline changes how inputs are produced.
- External shifts. Trends, events, or market changes alter the incoming data.
Some of these are benign and expected, like seasonality, while others signal a real problem, like a broken upstream pipeline. Detecting drift is the first step; understanding its cause determines whether and how to respond.
Data drift vs. concept drift
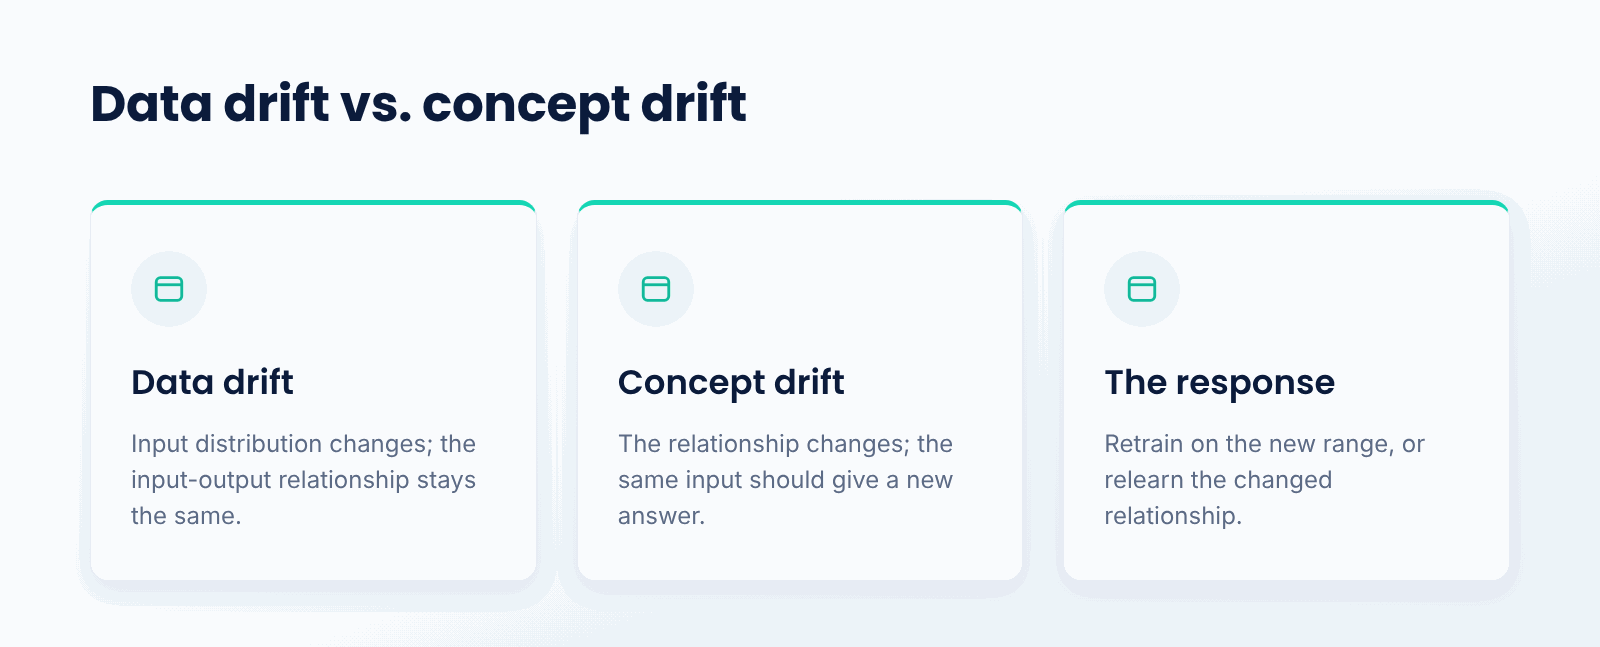
These are the two main kinds of drift, and they differ in what changes. Data drift is a change in the input distribution, the inputs look different, but the relationship between inputs and the target is unchanged. Concept drift is a change in that relationship itself, so the same input should now produce a different output.
The distinction guides the response. Data drift may be handled by retraining on data that covers the new input range, while concept drift means the learned relationship is now wrong and the model genuinely needs to relearn. Both reduce accuracy, but for different underlying reasons.
Why does data drift matter?
- Early warning. It often signals trouble before accuracy visibly drops.
- Accuracy. Unfamiliar inputs push the model outside its trained range.
- No labels needed. Input distributions can be monitored without waiting for outcomes.
- Diagnosis. It helps explain why a model's performance is changing.
- Reliability. Catching it keeps production models dependable.
How do you detect and respond to data drift?
- Baseline the training data. Record the distribution of each input feature.
- Compare in production. Measure how current input distributions differ.
- Use statistical tests. Quantify drift with distance or divergence measures.
- Alert on thresholds. Flag features whose drift exceeds a limit.
- Investigate and retrain. Find the cause and retrain if performance is at risk.
When should you monitor for data drift?
Monitor it for any model in production, especially where you cannot immediately observe outcomes. Because input distributions can be checked without waiting for ground-truth labels, drift detection often gives the earliest sign that a model may be heading for trouble.
It is especially important in fast-changing domains and in systems where labels arrive slowly or not at all, since there input monitoring may be your main early signal. Even in stable settings, periodic drift checks are cheap insurance against silent model decay.
Key points about data drift
- Data drift is a shift in the input data's distribution.
- It compares production inputs to the training baseline.
- It can hurt accuracy even when relationships are unchanged.
- It differs from concept drift, which changes input-output relationships.
- It can be detected without labels, giving an early warning.
- Responses range from investigation to retraining.
Conclusion
Data drift is a shift in the distribution of the inputs a model receives, compared to its training data, and it can erode accuracy even when the underlying relationships still hold. Because input distributions can be monitored without waiting for outcomes, drift detection is a valuable early-warning system, pointing to when a model needs investigation or retraining. It is a core part of keeping production models reliable.
TrueFoundry helps teams deploy and monitor models on their own infrastructure, including tracking input distributions to catch data drift early. Watching for drift is one of the most practical ways to keep a deployed model trustworthy over time.

Govern, Deploy and Trace AI in Your Own Infrastructure
Frequently Asked Questions
What is data drift in simple terms?
It is when the distribution of inputs fed to a model diverges from the training dataset over its lifecycle. Input features evolve through time, so the model makes predictions on data it did not see during training, which can quietly degrade accuracy.
What causes data drift?
Routine variations within the environment: demographic shifts in users, seasonality effects, the emergence of novel data categories, alterations to an upstream data feed or sensor reading, and broader trend movements. All of these drive the input distribution apart from the training data.
How is data drift different from concept drift?
Data drift involves a shift in the input distribution, leaving the function mapping inputs to outputs unchanged. Concept drift is a modification in the input-output relationship, so the very same input should now generate a new output. Data drift changes the inputs; concept drift changes the rules.
How do you detect data drift?
You detect it by baselining the training data's input distributions and comparing them to production data over time, often through statistical distances or divergences. An alert triggers when a feature's distance crosses a threshold, flagging it for investigation.
Why monitor data drift if you can monitor accuracy?
Because accuracy requires ground-truth labels, which are often delayed or missing entirely. Input distributions can be monitored right away, so data drift is likely to flag a decline long before accuracy metrics can even provide evidence of degradation.


- © 2022 ENSEMBLE Technologies



Subscribe to our newsletter
The latest news, articles, and resources sent to your inbox


