Monitor LLM and MCP performance, costs, guardrails, routing, and caching from a unified metrics dashboard
The Metrics Dashboard gives you a complete picture of your AI Gateway’s health and efficiency. Pinpoint performance bottlenecks, track spending in real-time, and see exactly how your application is being used — all from a single, interactive interface.The dashboard is organized into tabs, each providing a specific perspective on your data. Every tab supports time-range selection, filters (by model, user, virtual account, team, and more), and a Refresh button for live monitoring.
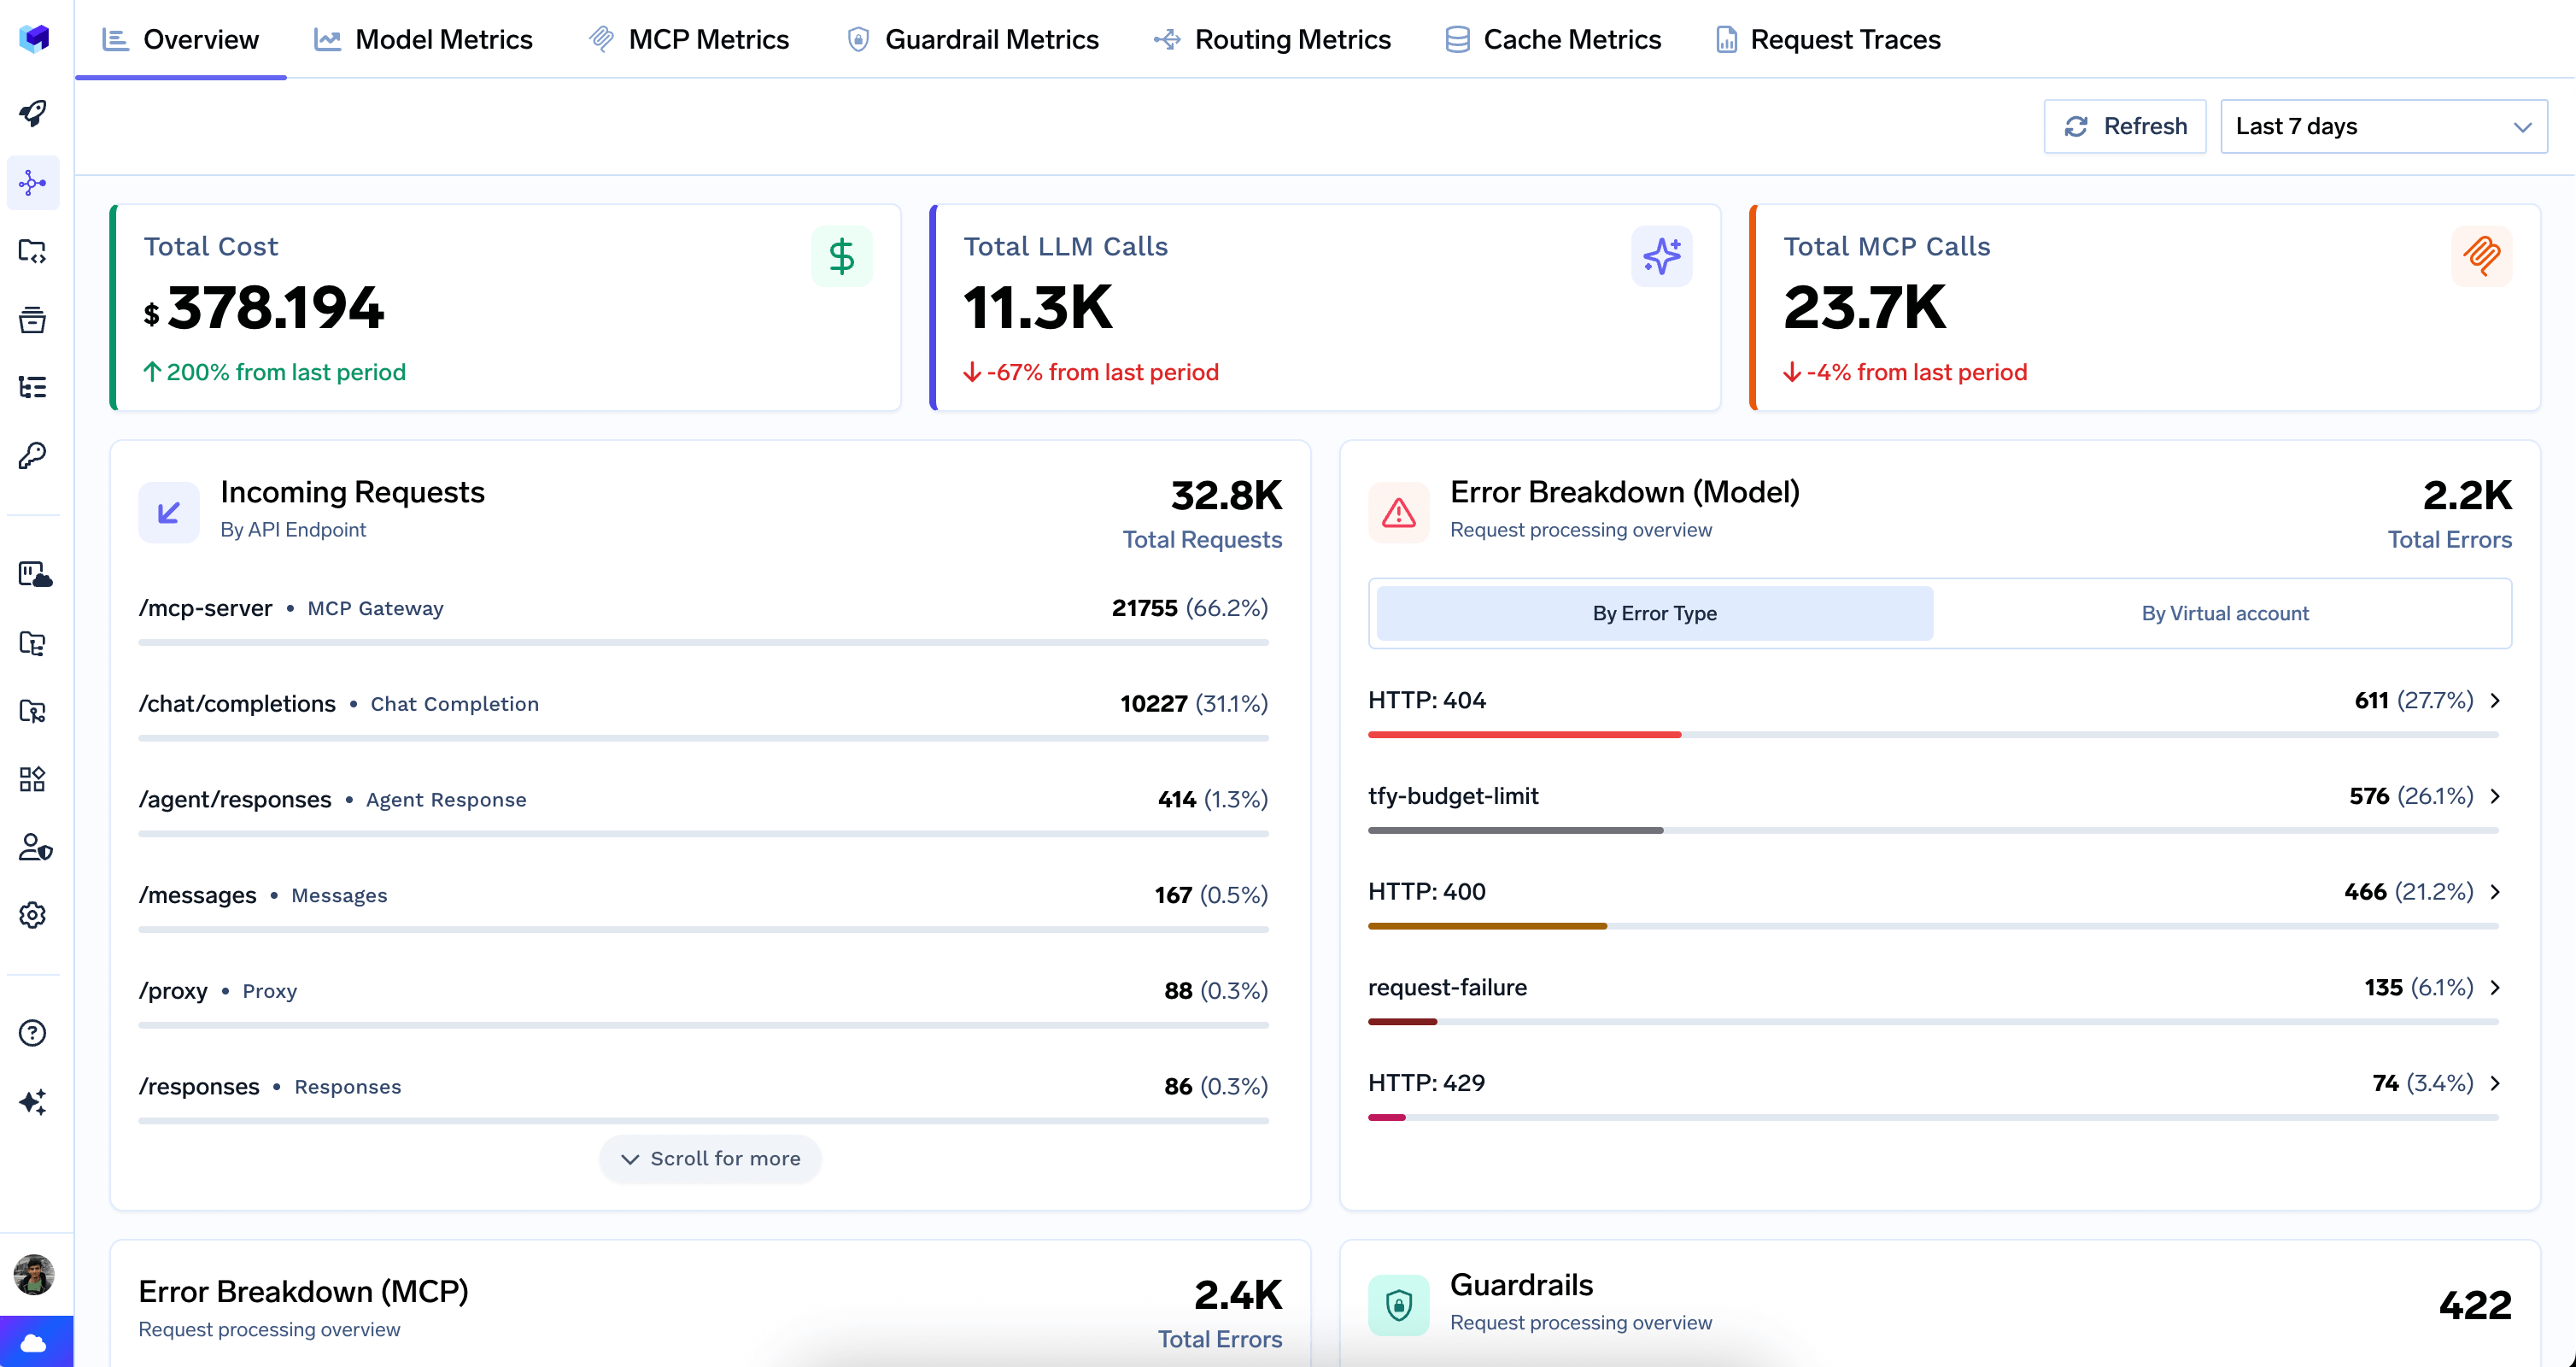
The Overview tab is the landing page of the Metrics Dashboard. It provides a single-screen summary of gateway activity across both LLM and MCP traffic.
Overview tab showing high-level gateway health
Top-Level Counters
Total Cost — aggregate spend across all models, with period-over-period comparison.
Total LLM Calls — count of all LLM API requests, with period-over-period change.
Total MCP Calls — count of all MCP requests, with period-over-period change.
Incoming Requests
Breaks down total request volume by API endpoint type. Each row shows the endpoint pattern, a friendly label, and its share of total traffic.
Endpoint
Description
/mcp-server
MCP Gateway
/chat/completions
Chat Completion
/agent/responses
Agent Response
/messages
Anthropic Messages
/proxy
Proxy
/responses
OpenAI Responses
/embeddings
Embedding
/completions
Completion
/v2/rerank
Rerank
Error Breakdowns
Error Breakdown (Model) — Displays LLM provider errors grouped by HTTP status code or virtual account.Error Breakdown (MCP) — Same structure for MCP traffic, helping identify reliability issues with specific MCP servers.
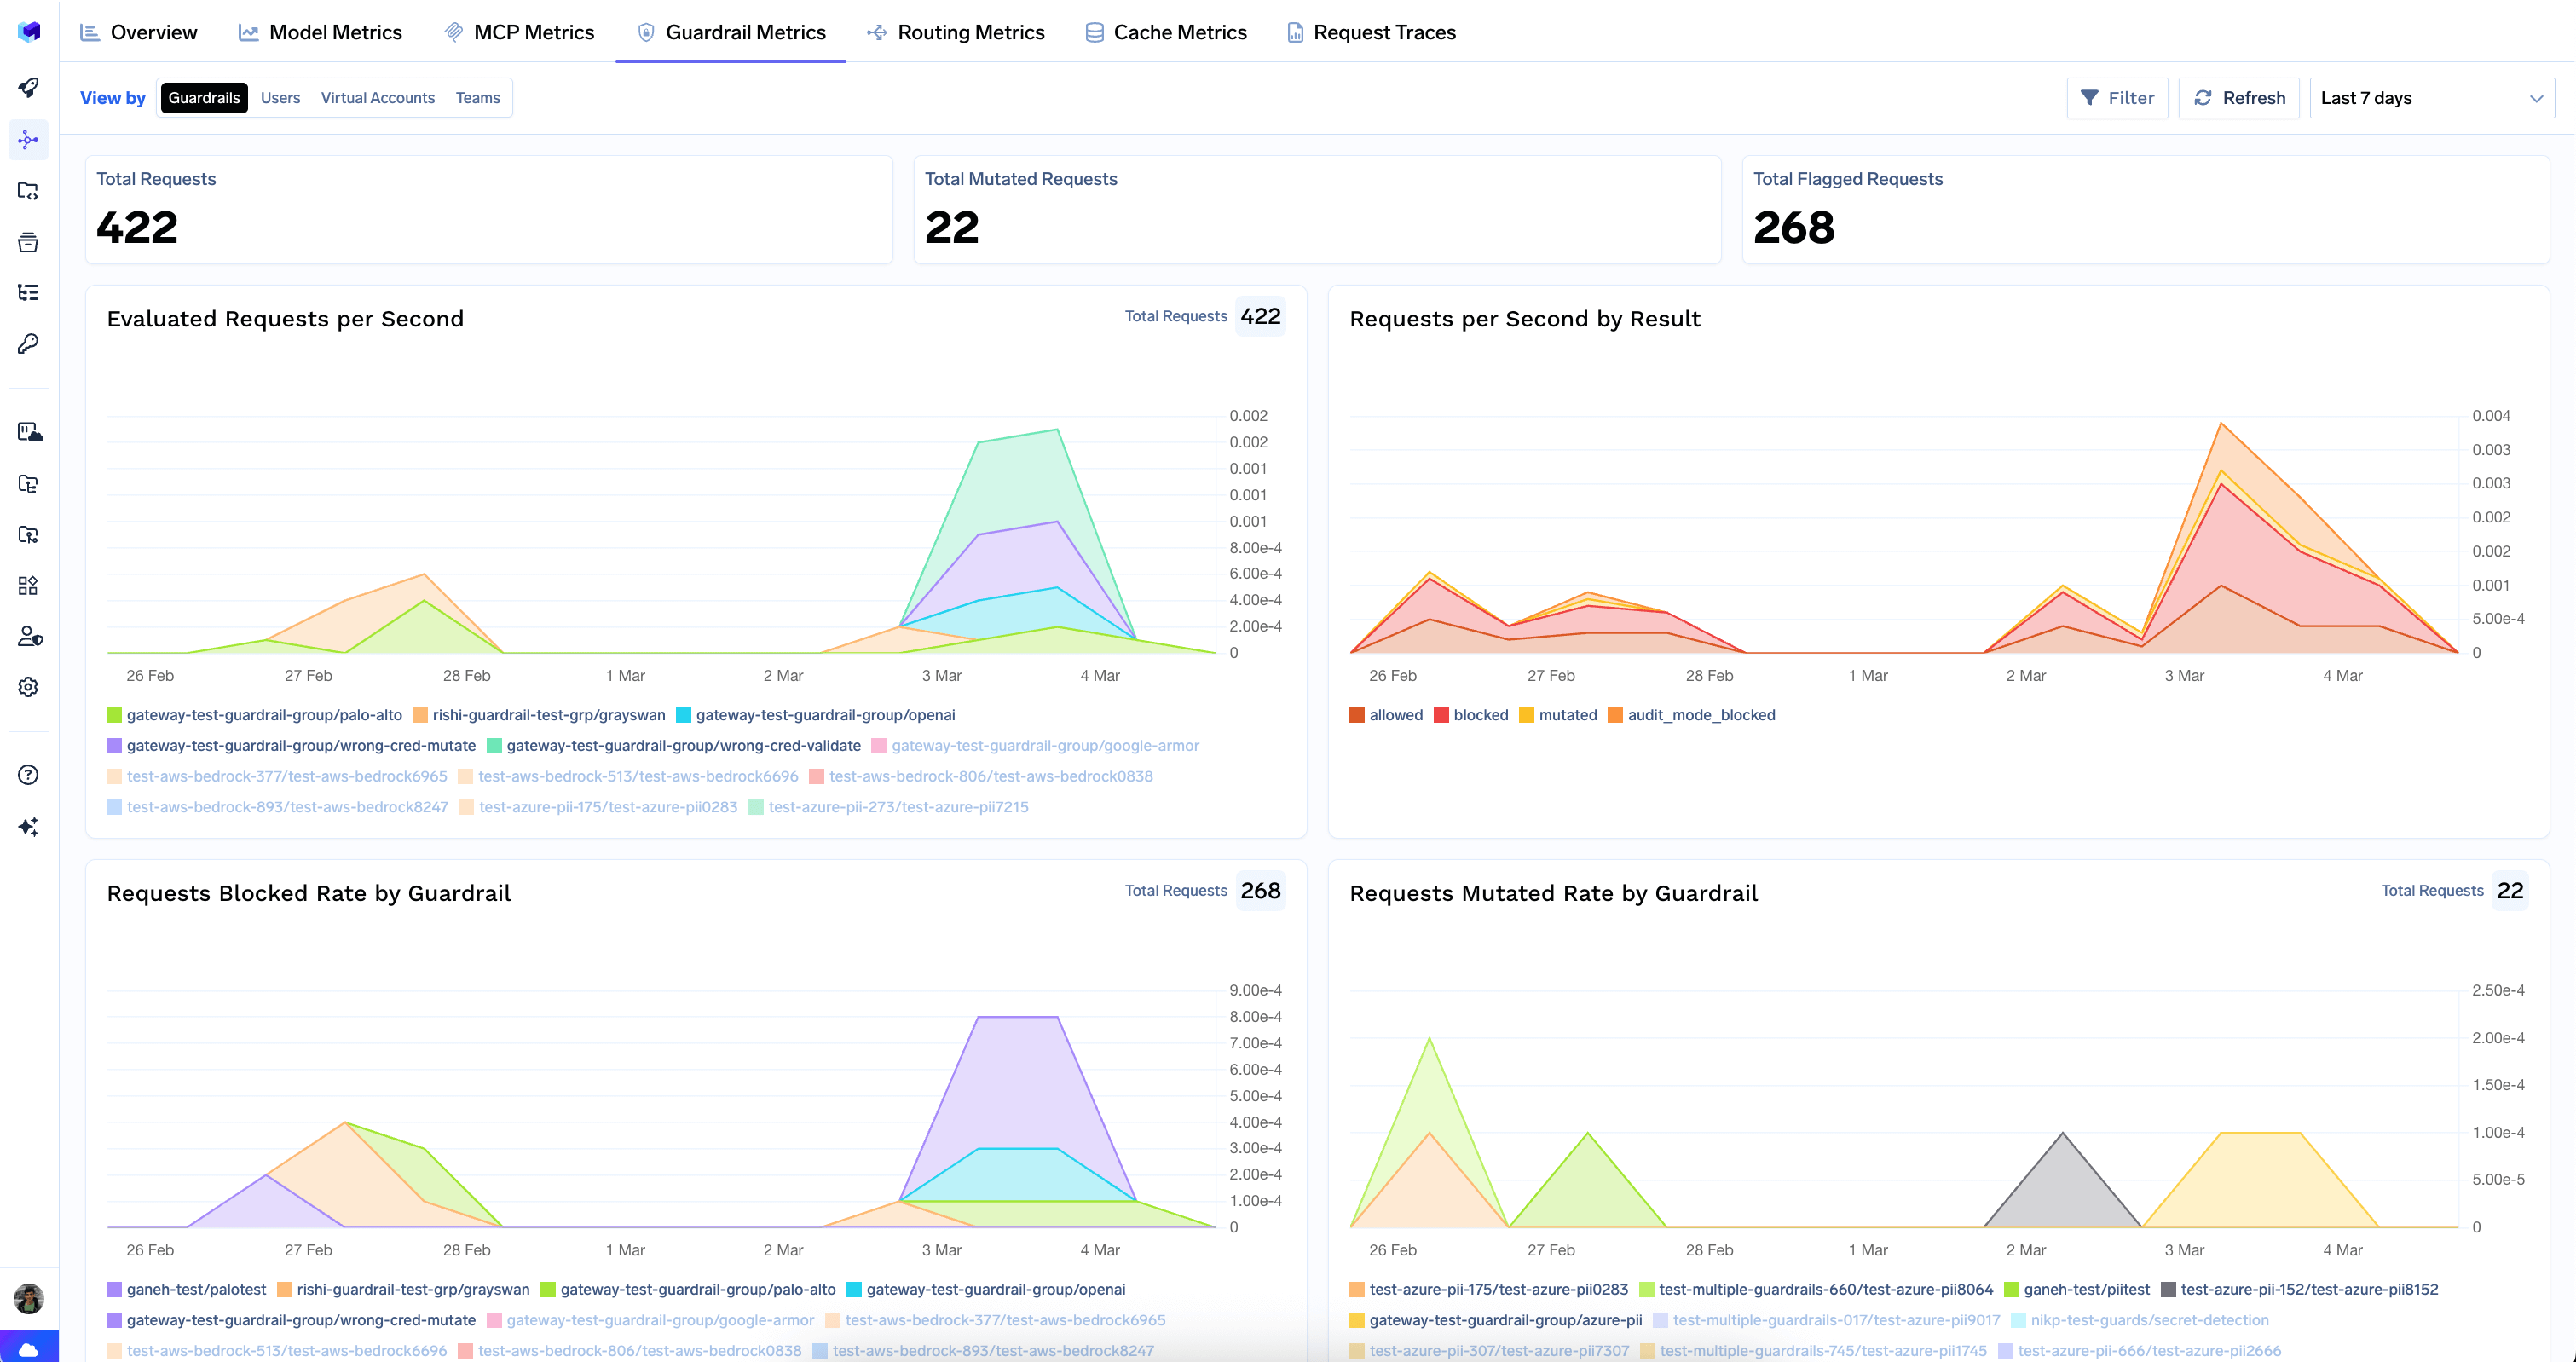
Guardrails Summary
Shows the total number of guardrail evaluations and a ranked list of which guardrail groups are triggering most often, with a breakdown of outcomes (blocked, flagged, mutated).
Top Usage Rankings
Ranked leaderboards for quick identification of the biggest consumers and most active components:
Leaderboard
What it shows
Top Models
Most-used models by request count
Top Model Providers
Most-used providers (e.g. Google Vertex, OpenAI, AWS Bedrock)
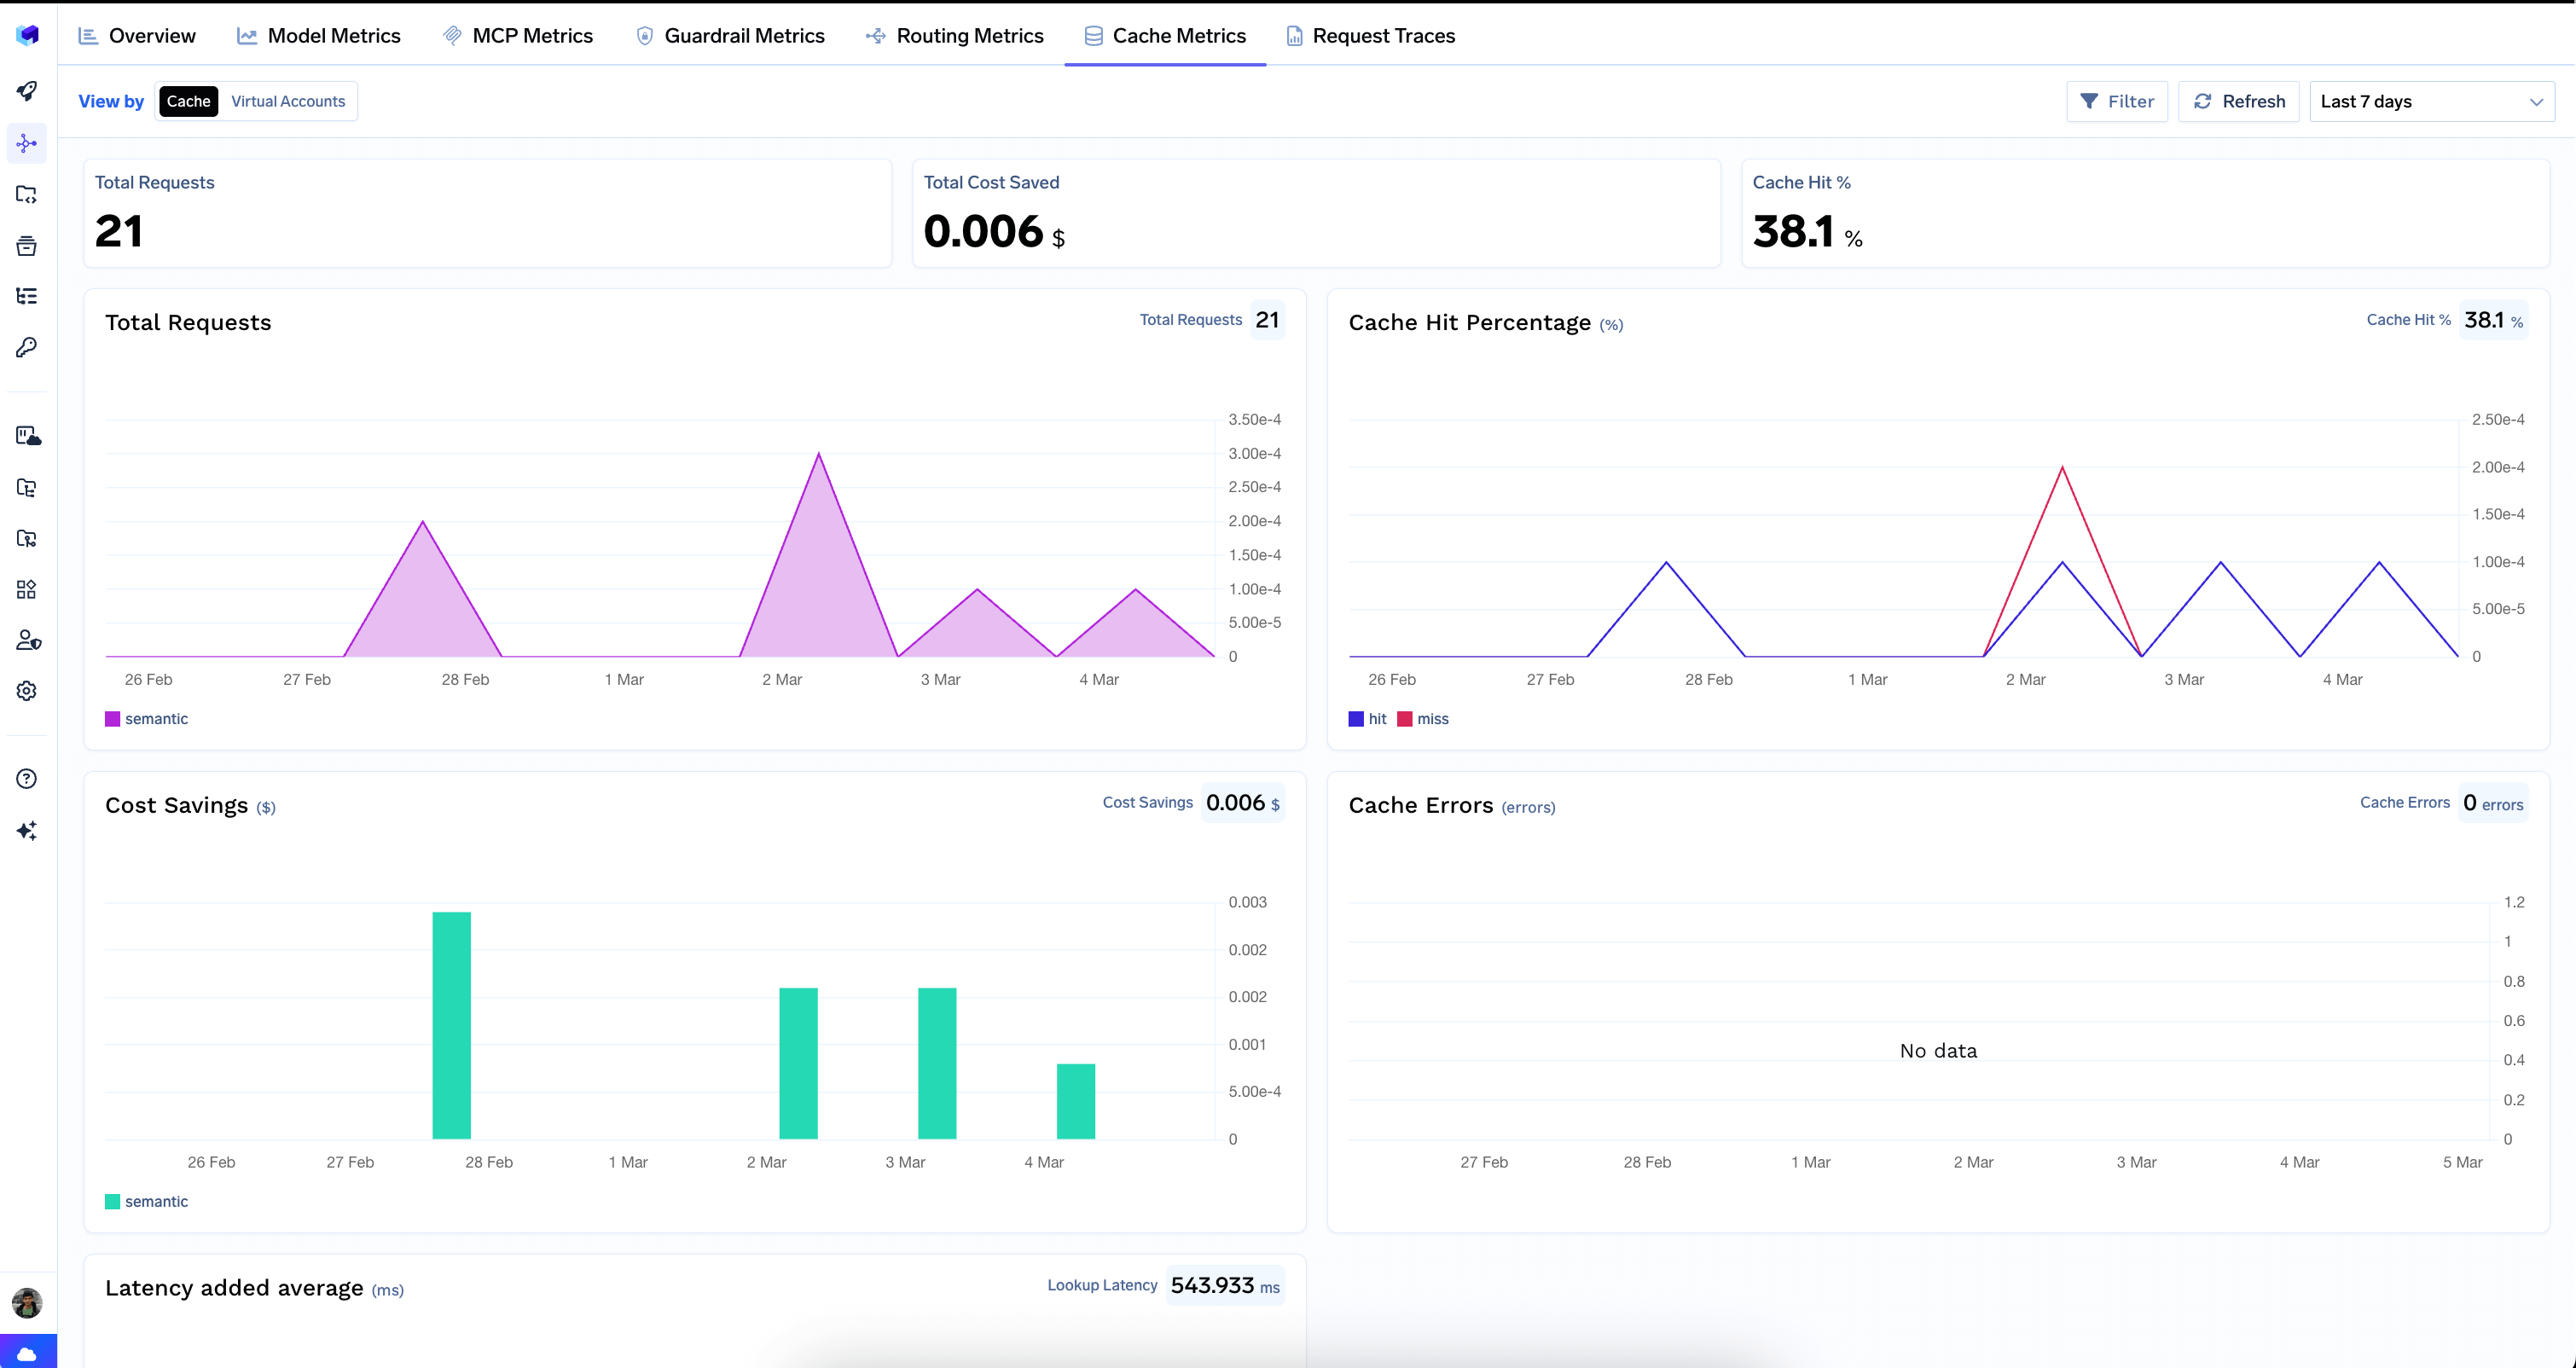
Measures the performance of your semantic cache — hit rates, cost savings, latency overhead, and errors.
Cache Metrics tab
Top-Level Counters
Total Requests — number of requests that went through the cache lookup.
Total Cost Saved — dollar amount saved by serving responses from cache.
Cache Hit % — percentage of requests served from cache.
Charts
Total Requests — cache request volume over time.
Cache Hit Percentage — hit vs. miss rate over time. A high hit rate means the cache is working well; a low or declining hit rate may indicate queries are too diverse for the current cache configuration.
Cost Savings — dollar savings from cache hits over time.
Cache Errors — errors encountered during cache operations. Ideally this should show “No data”.
Latency Added Average — average latency overhead introduced by cache lookups.
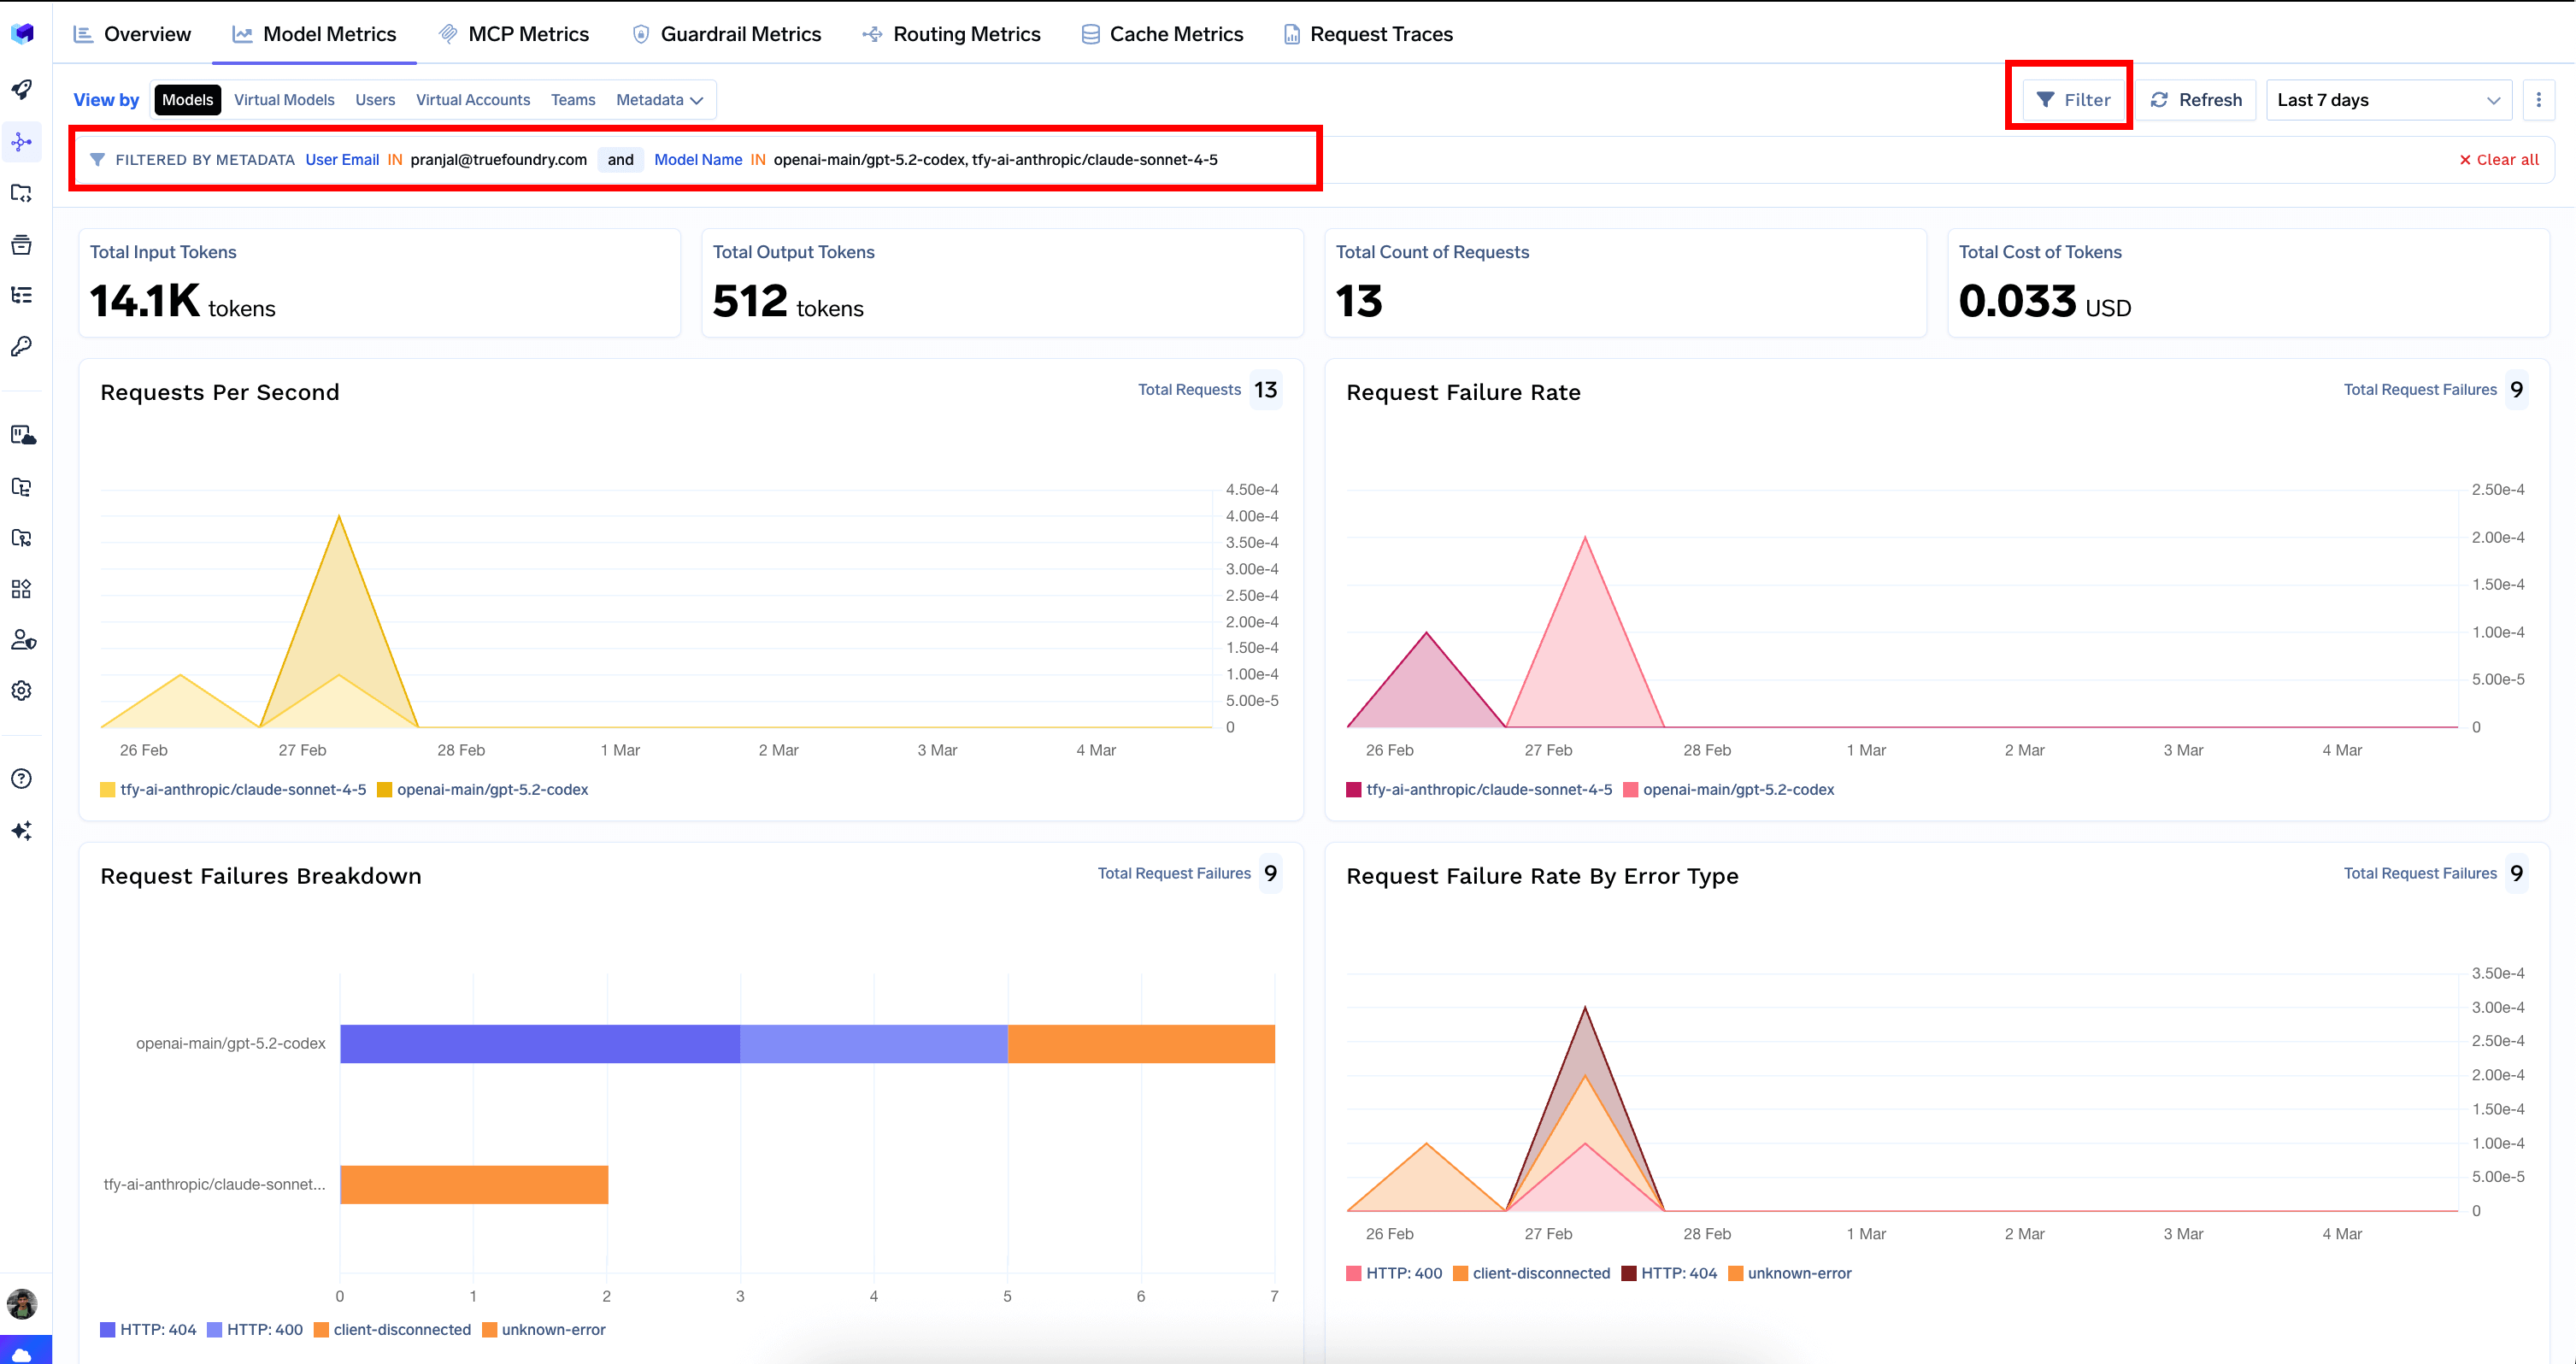
The dashboard includes filters that allow you to narrow down your analysis to specific models, users, virtual accounts, teams, MCP servers, tools, or custom metadata fields. Filters persist across tabs, making it easy to investigate a specific user or model across all dimensions.
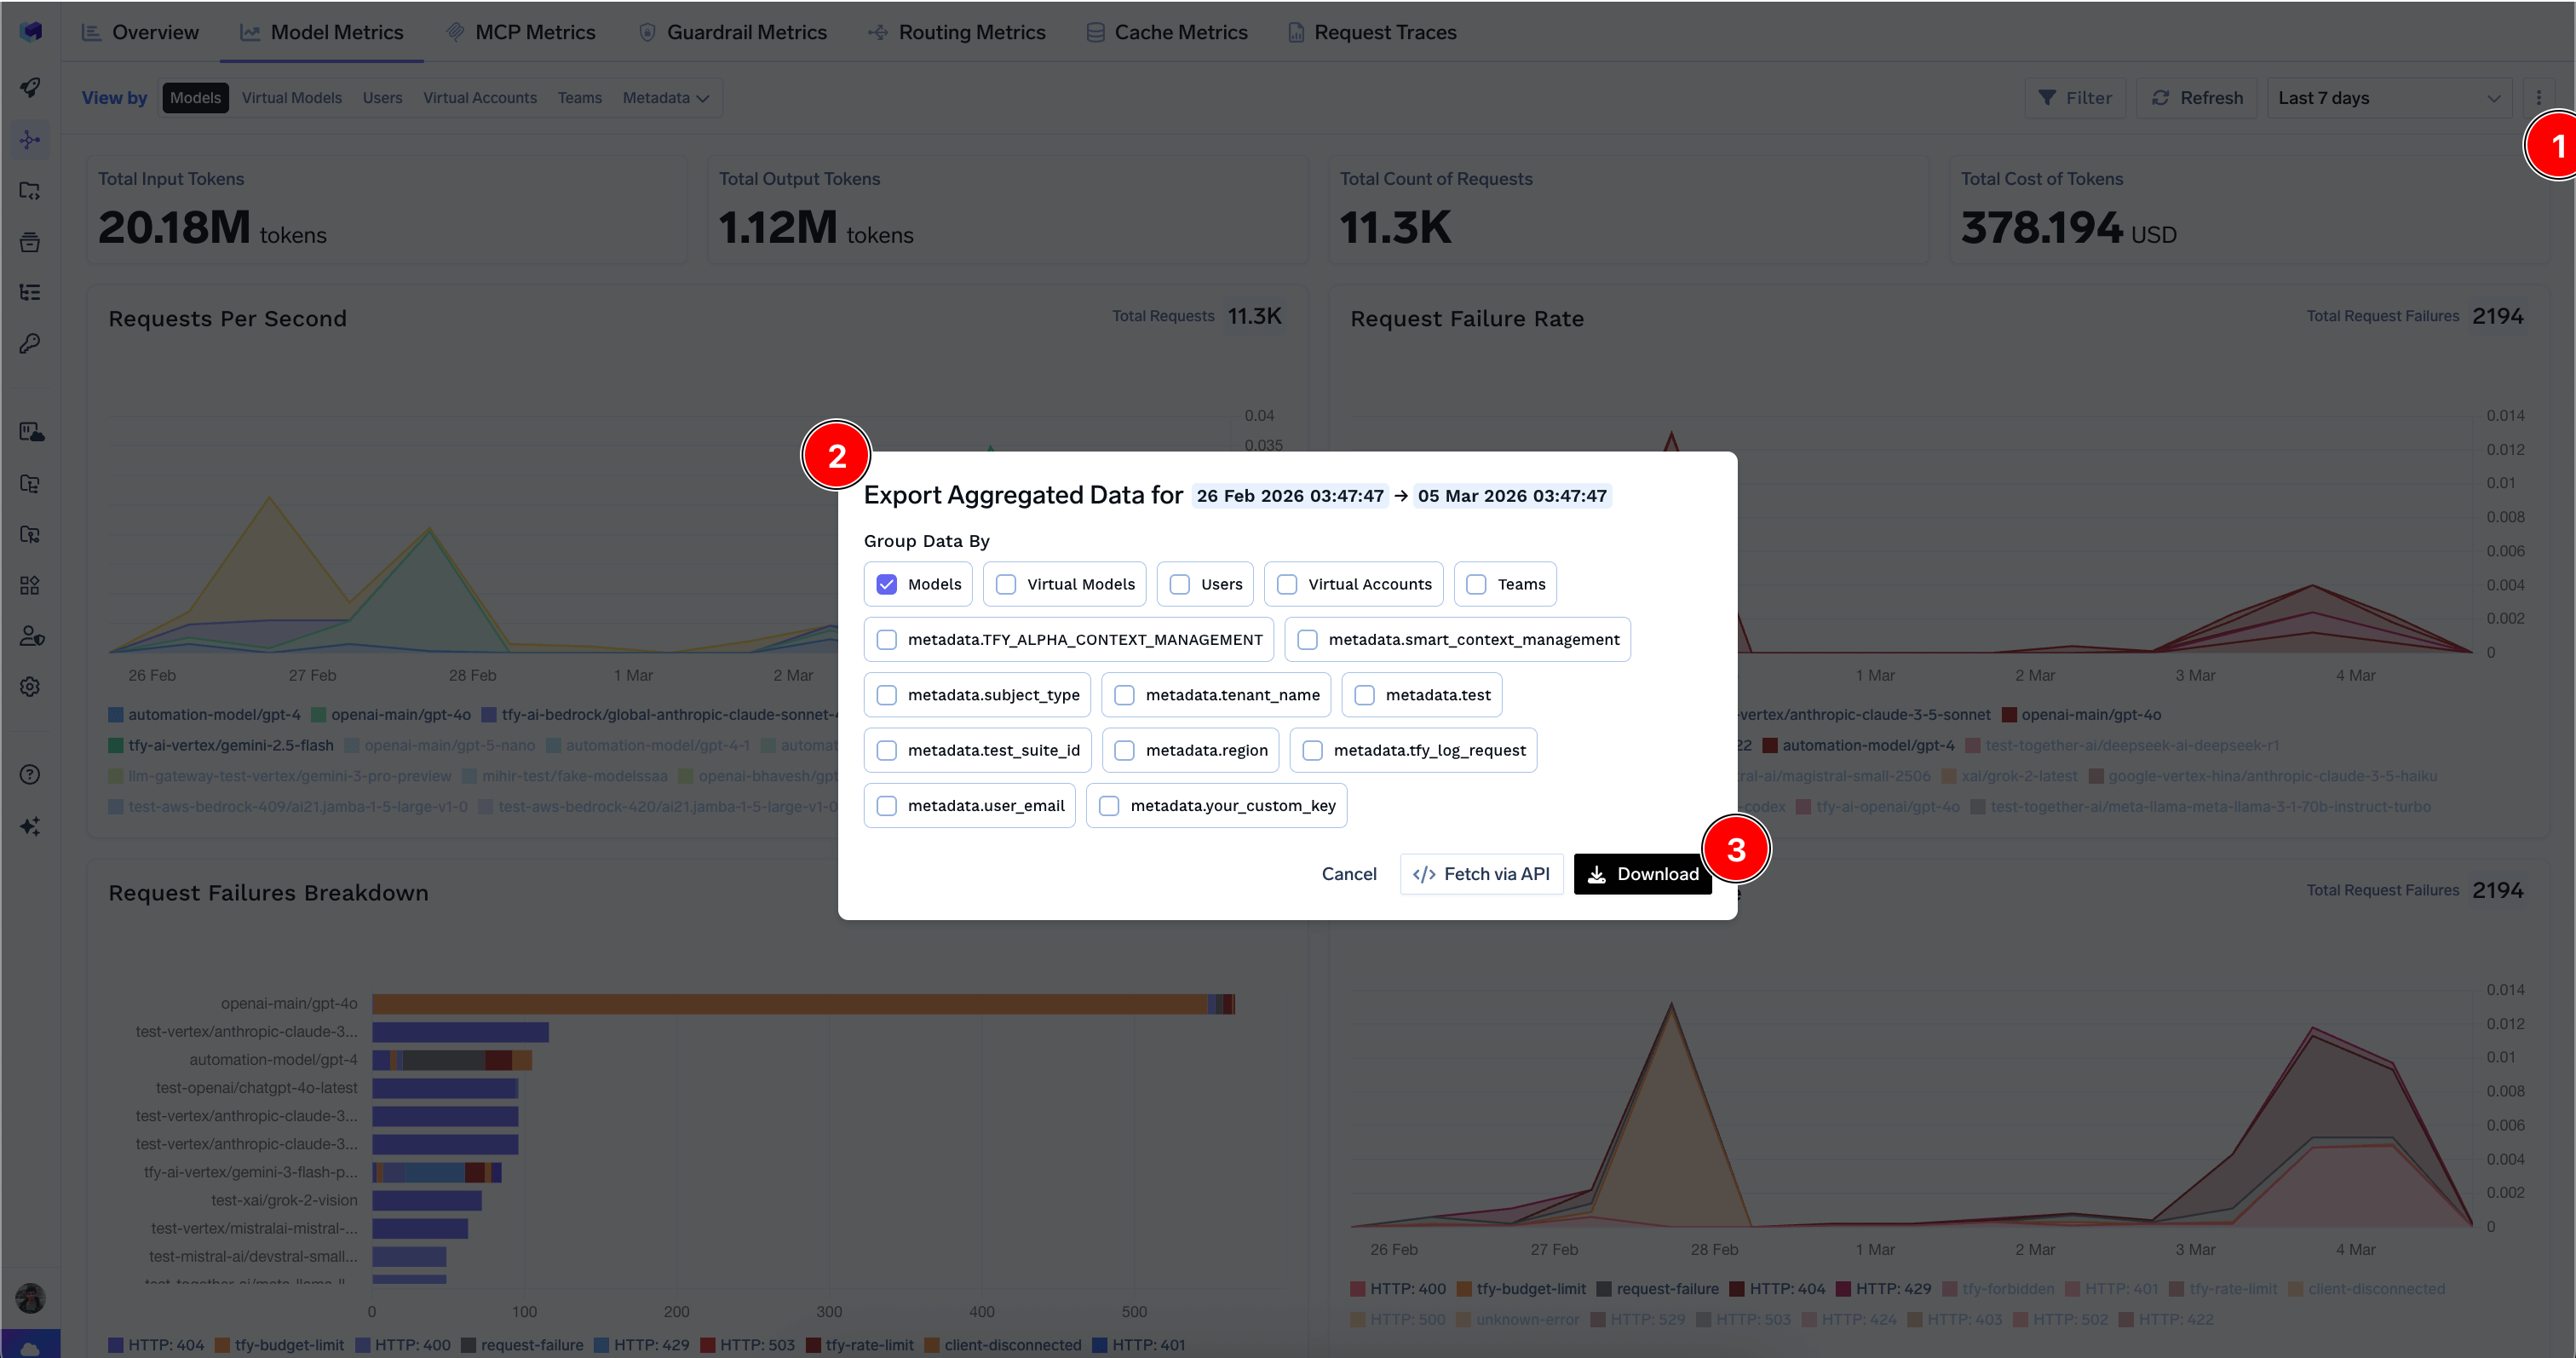
You can download aggregated metrics data in CSV format by clicking the export icon on supported tabs. Choose which dimensions to group the data by and optionally include custom metadata keys. You can also fetch the data via API for programmatic access; see the per-datasource guides for Model, MCP, Guardrail, Cache, Routing, and Agent metrics.
Export dialog for downloading aggregated metrics data