


August 27, 2025
|
5 min read

Published: June 4, 2026
Blazingly fast way to build, track and deploy your models!
TL;DR – After side‑by‑side testing on a 500 GB/7‑day workload, VictoriaLogs cut query latencies by 94 %, shrank storage by ≈40 %, and used < 50 % of the CPU & RAM we previously allocated to Loki. This post explains why we switched.
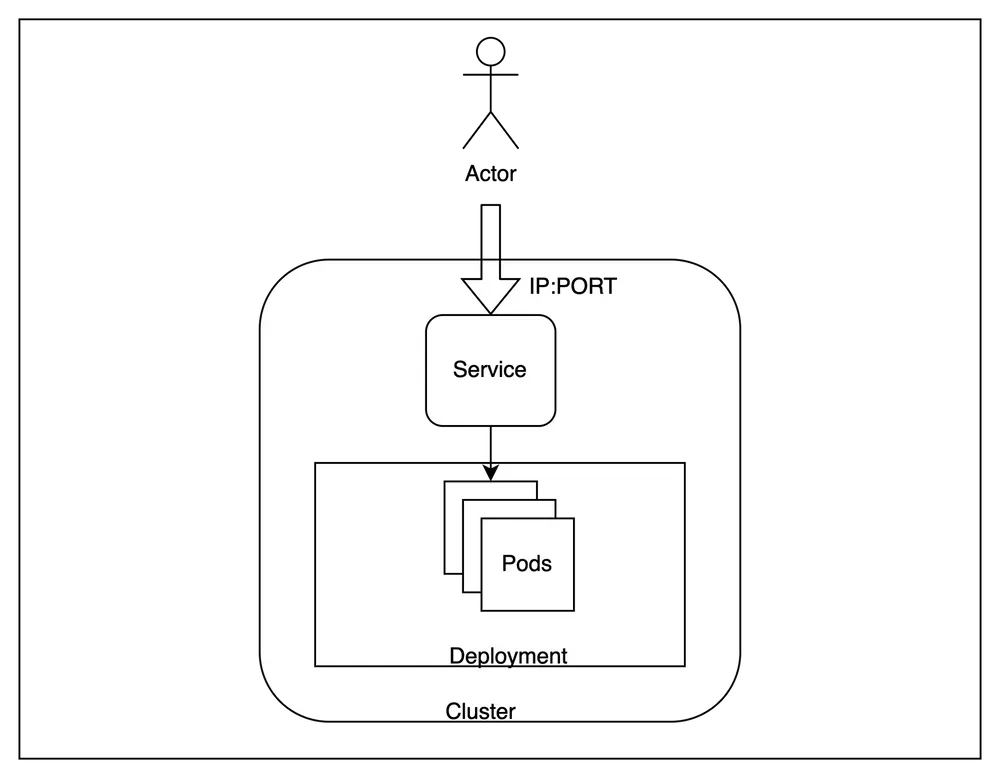
Truefoundry helps developers run multi‑tenant ML workloads on Kubernetes.
Developers need:
Loki served us well initially, but as volume grew we saw >30 s search latencies and high I/O amplification. This triggered an evaluation of VictoriaLogs.

Loki is Grafana‑Labs’ log aggregation system that stores logs in compressed chunks accompanied by an index built from labels (key–value pairs). Queries are expressed in LogQL and rely heavily on label filters followed by line filtering.
VictoriaLogs is a log database by the VictoriaMetrics team. It uses columnar LSM‑style storage with per‑field indices, SIMD‑accelerated search and SQL‑like LogSQL syntax.
[UNIQUE-STATIC-LOG] ID=abc123 XYZ in heavy log filled namespace over 7 days.Purpose: Total log lines from app="servicefoundry-server"
Purpose: Search for a unique static log line in truefoundry namespace
Purpose: Search for known restart pattern :3000 in a small subset of logs (targeting a single shard)
Result sets were verified to be identical.
Purpose: Search for non-existing log, triggering a full data search
Result sets were verified to be identical.
On 500GB processing data, Loki behaved strangely. The resources got choked. and query response halted.
Our evaluation focused on three dimensions that matter day‑to‑day for platform engineers:
Why the gap? VictoriaLogs maintains a per‑token index, so even regex‑like scans are index‑assisted. Loki, by contrast, filters line‑by‑line after a label query, which devolves to a brute‑force scan when the label set is broad.
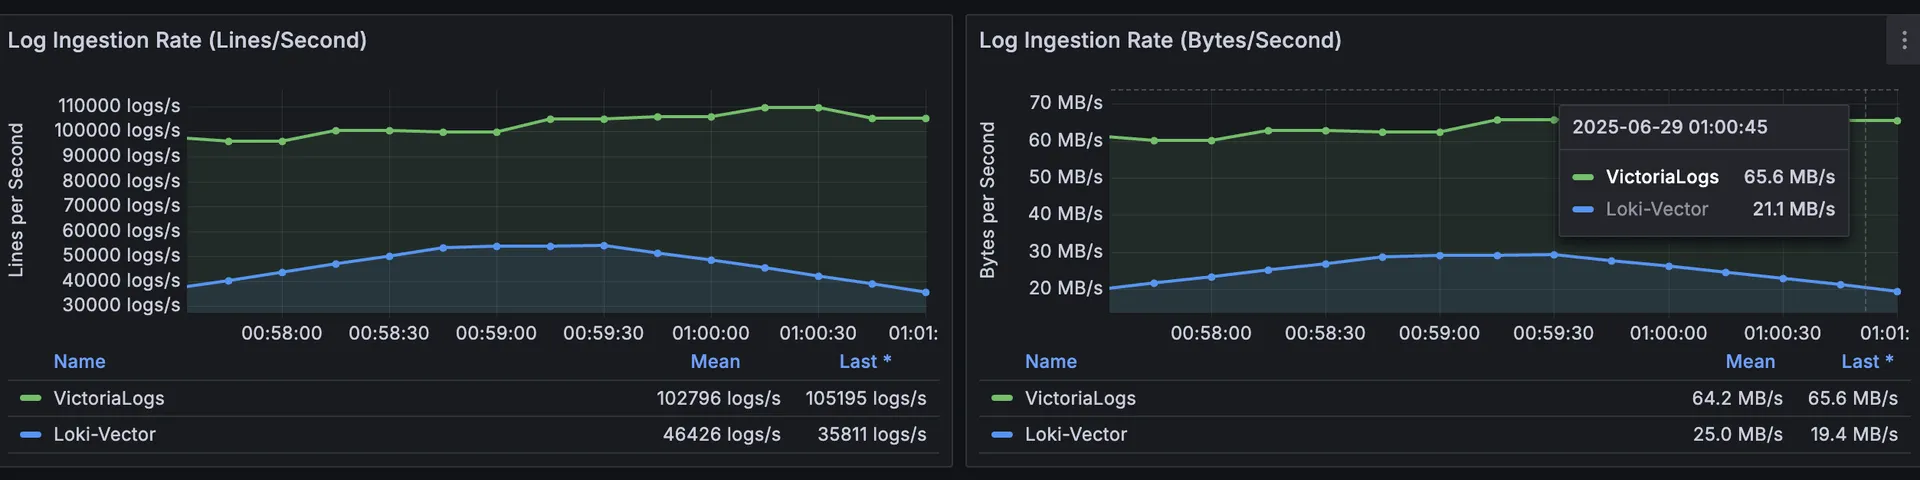
We also stress-tested ingestion with 120 replicas of our flog generator.
The results were eye-opening:
Loki:
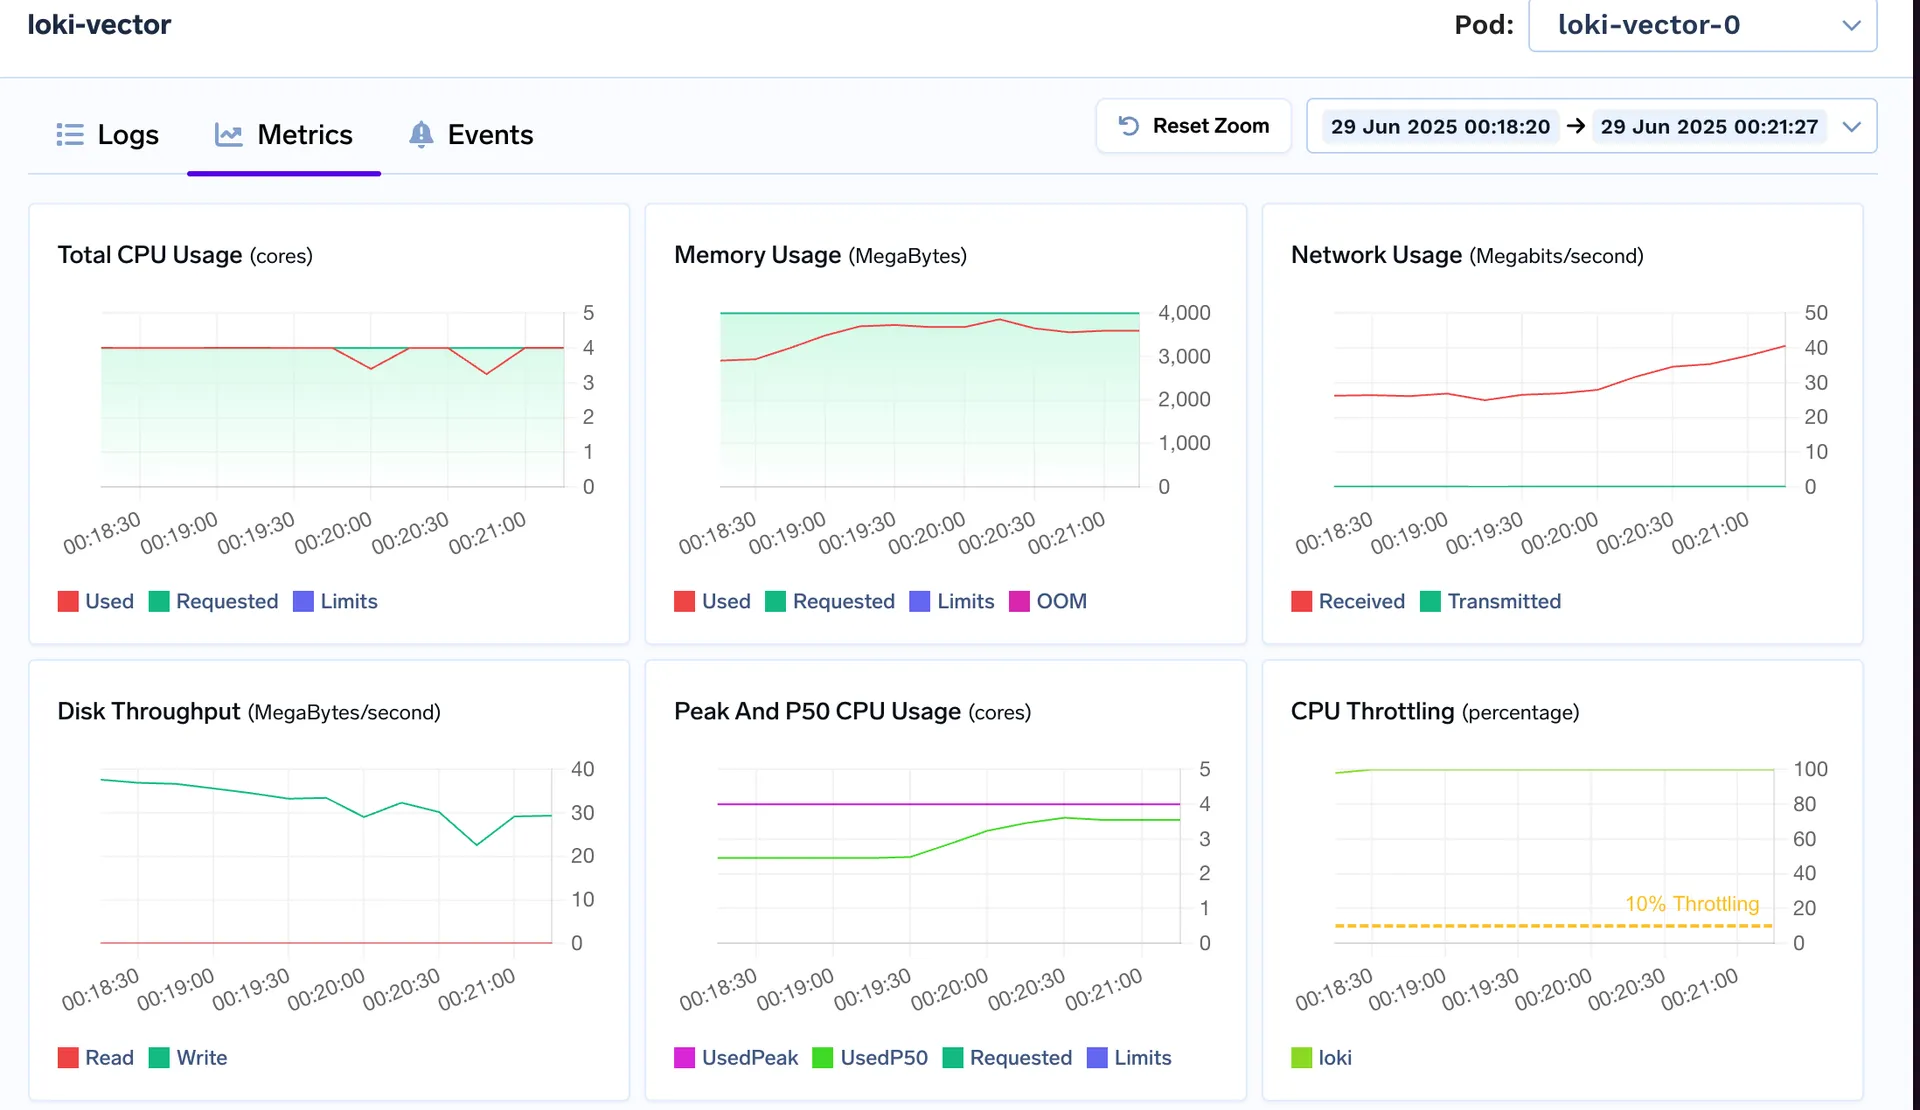
Loki spikes to 3–4 vCPU, nears its 8 GiB limit and shows throttling under the same workload
VictoriaLogs:
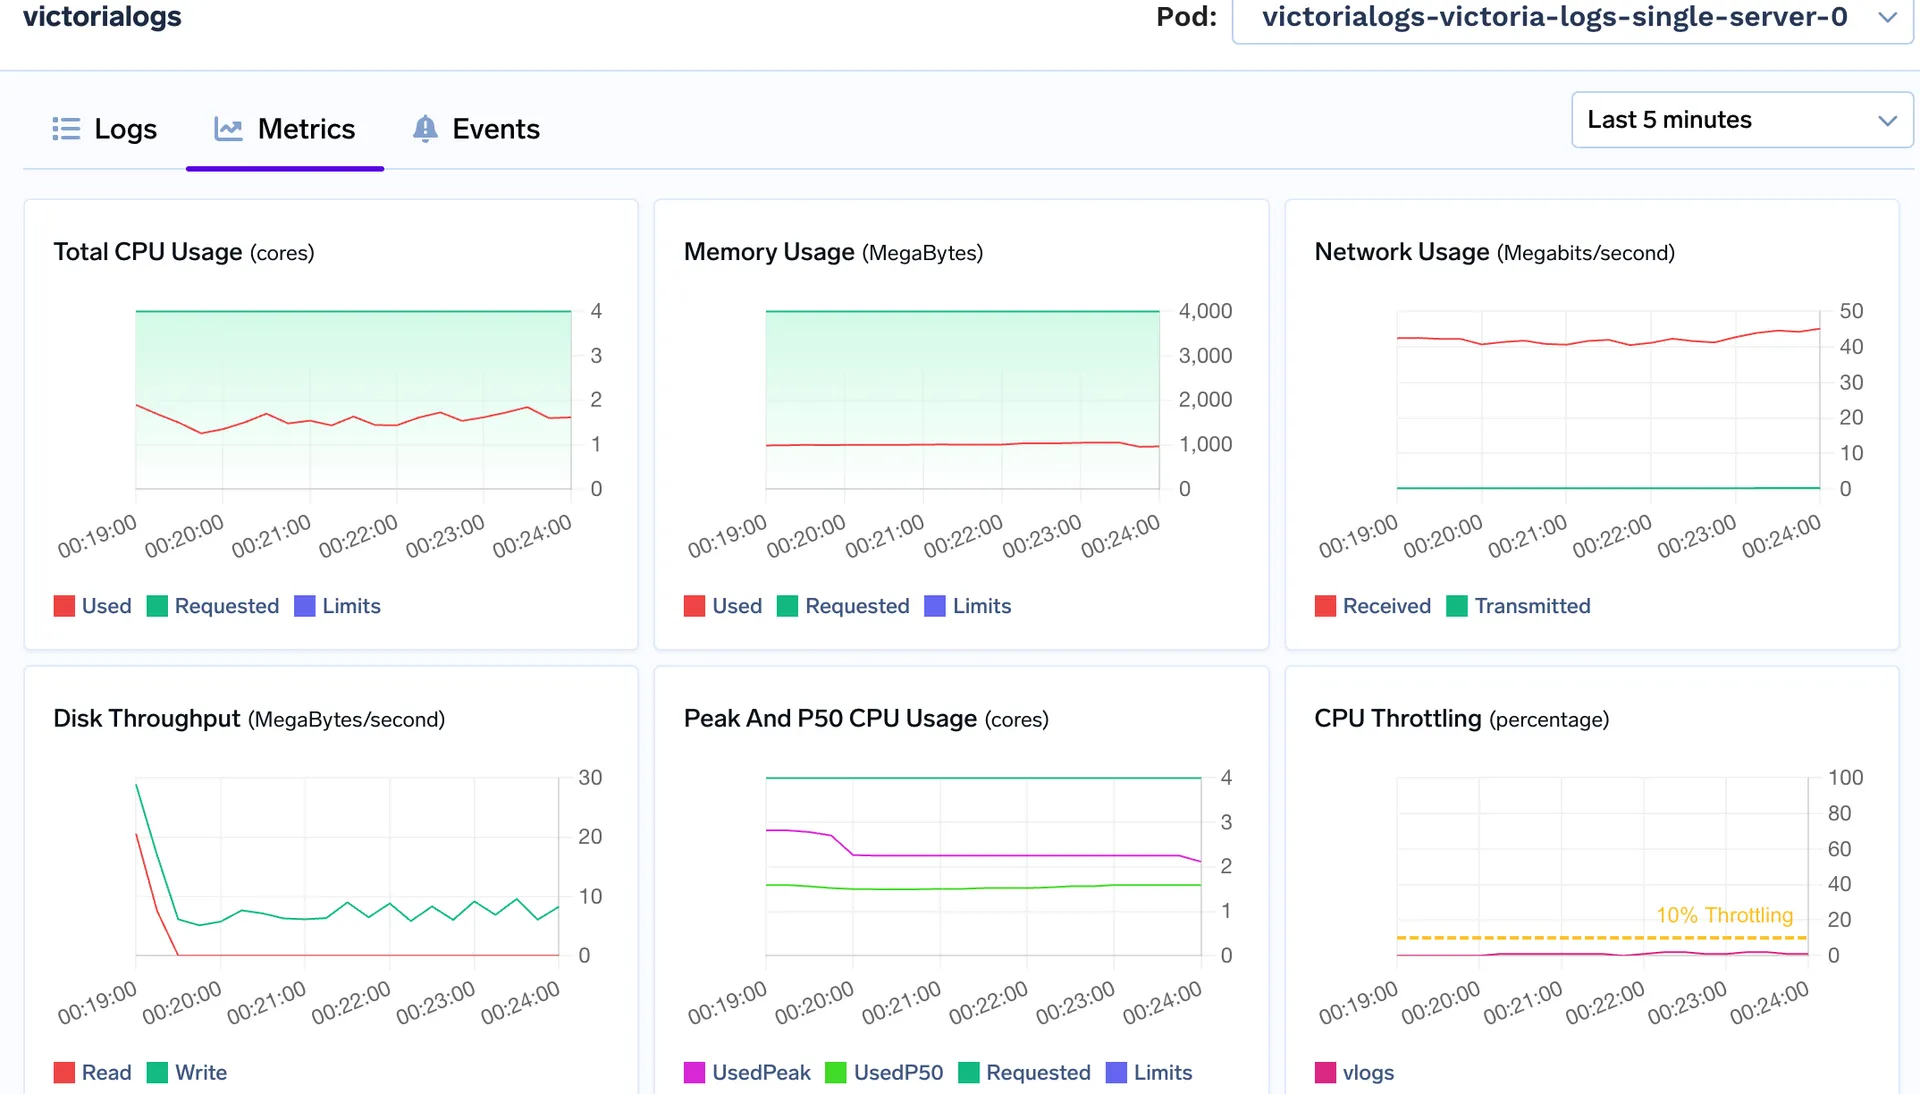
👉 Key takeaway: VictoriaLogs delivered 3× higher ingestion speed while consuming 72% less CPU and 87% less memory compared to Loki.
VictoriaLogs stays comfortably below its 4 vCPU / 8 GiB limits even during ingestion bursts
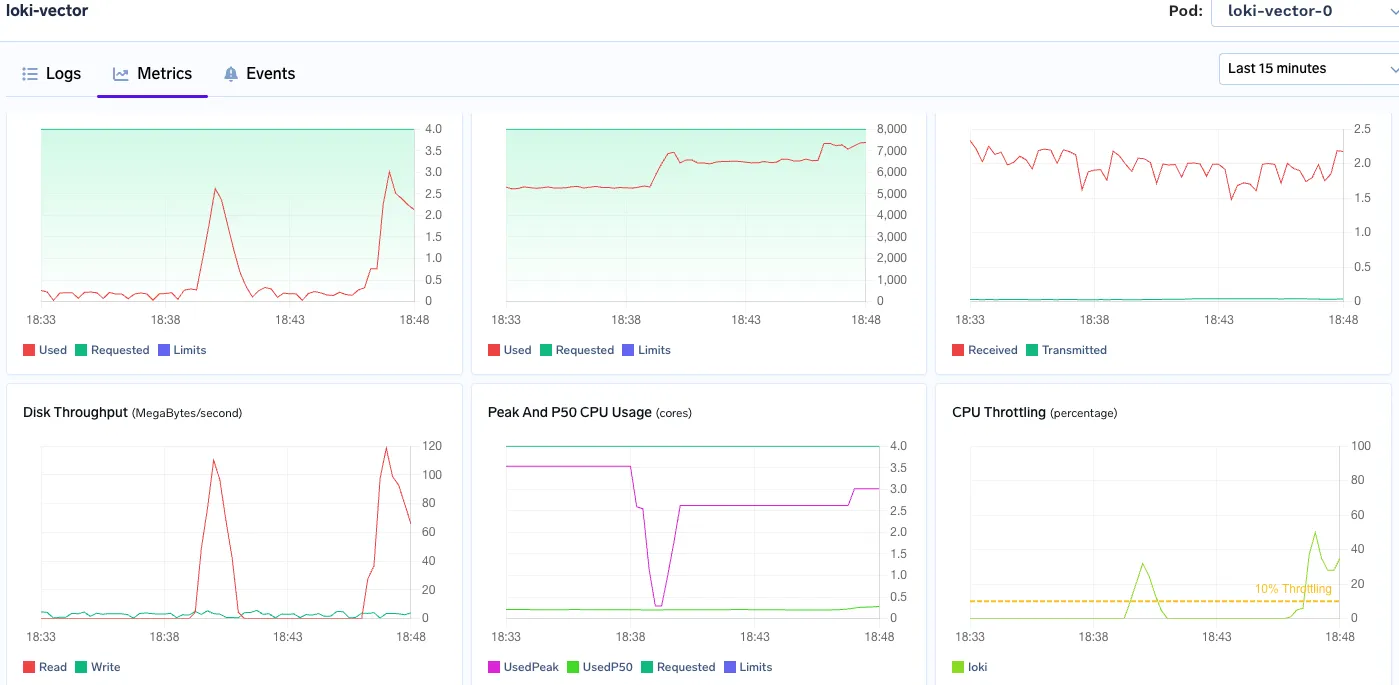
Memory Used: consistently using 6-7GB Ram
Cpu peak: 3 vCPU
VictoriaLogs
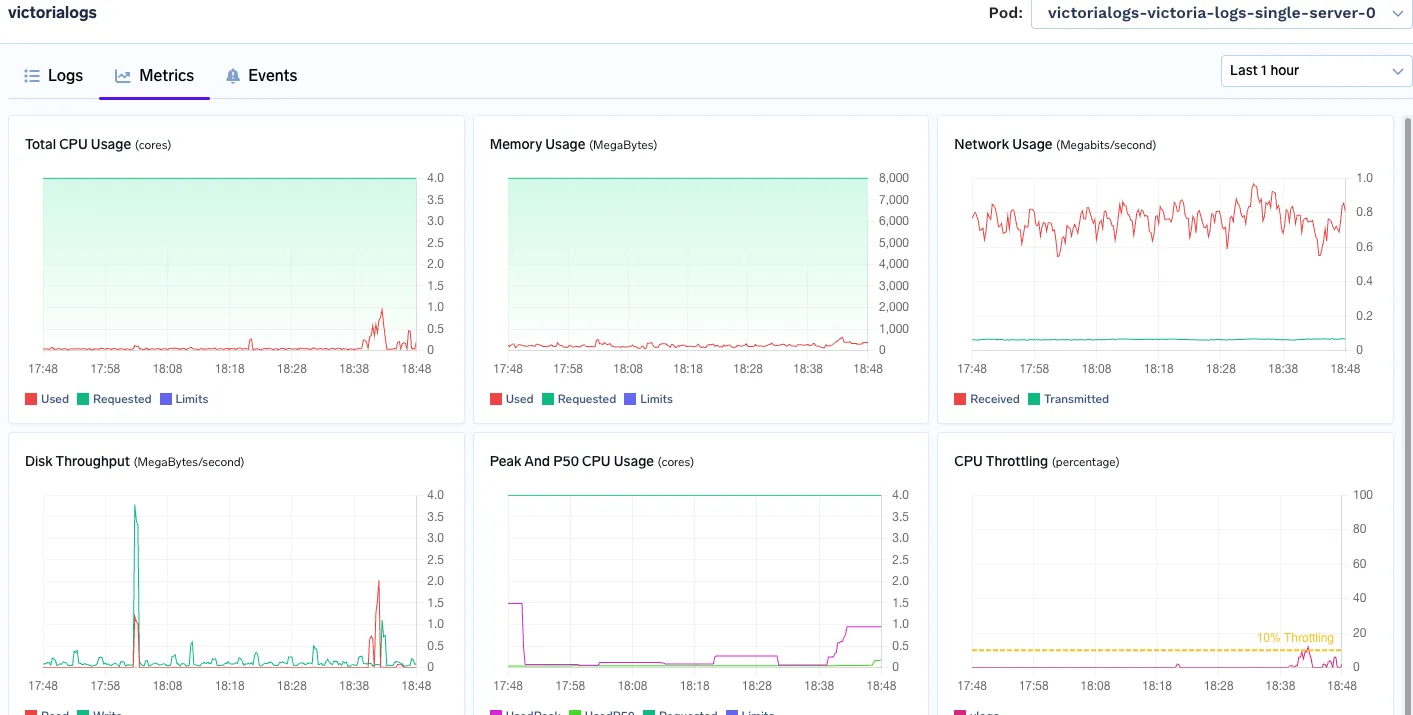
Memory Used: 800 MB - 900 MB
Peak Cpu Usage: 1.1 vCPU
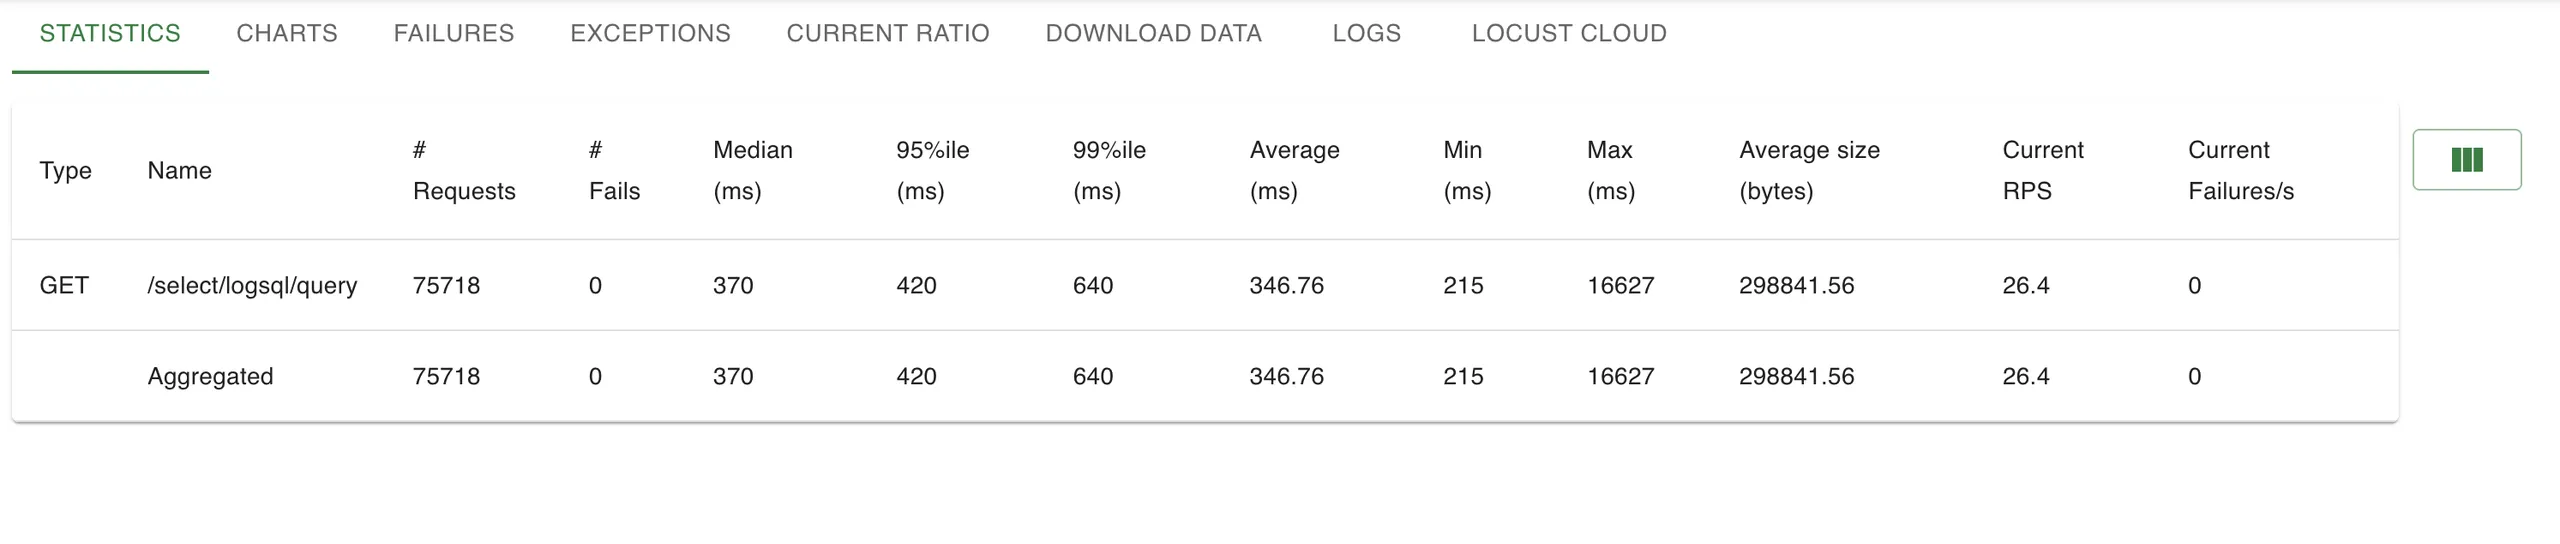
Queries were similar, with Random Limits and Random Time-range, to ensure Cache bursts.
Victoria Logs
Loki
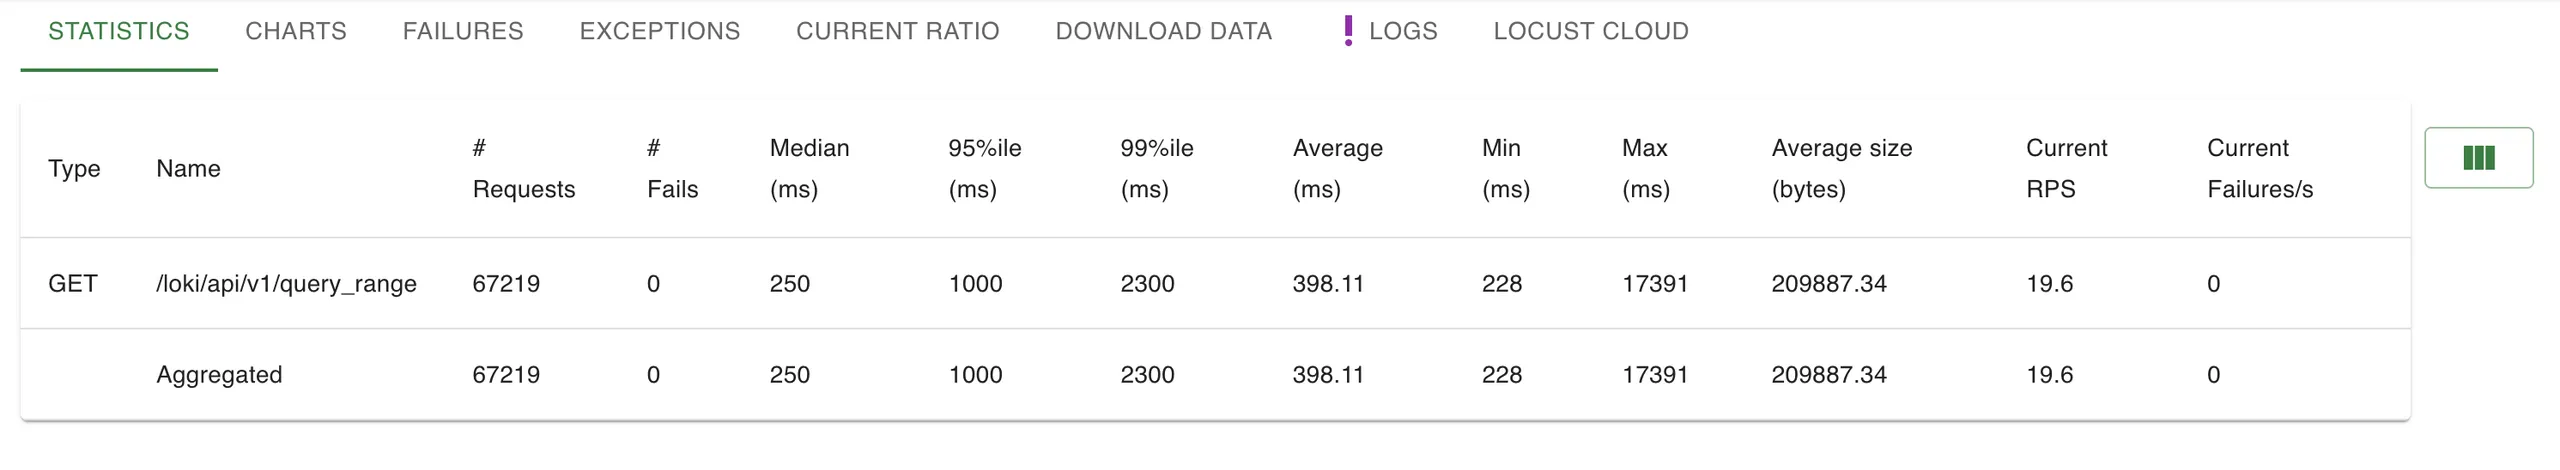
📌 Despite handling 36% higher RPS, VictoriaLogs showed lower p95% and tail latencies—proving its indexing model holds under pressure with 3.6x faster p99%ile
This test reinforced our decision: VictoriaLogs isn't just faster in theory—it scales better under stress in production-like workloads.
Bottom line: For a log‑heavy, search‑centric use case, VictoriaLogs lets us answer questions in seconds instead of minutes while cutting infra costs.
For workload profiles heavy on ad‑hoc text search, VictoriaLogs provided order‑of‑magnitude faster queries and material cost savings. Loki remains an excellent choice when tight Grafana integration and label‑first queries dominate, but VictoriaLogs is now our default for high‑ingestion, developer‑centric clusters.
The key difference in victorialogs vs loki is VictoriaLogs' advanced per-token indexing and columnar storage. This enables much faster query performance and significantly lower resource usage compared to Loki's label-only indexing, which often results in slower full-scan searches and higher operational overhead for log management.
Yes, in our rigorous benchmarking, VictoriaLogs demonstrated superior speed compared to Loki. For victorialogs vs loki comparisons, VictoriaLogs reduced query latencies by 94% and achieved 12x faster search times for complex queries. It also delivered 3x higher ingestion performance, making it significantly more efficient.
When evaluating victorialogs vs loki, knowing setup details is helpful. VictoriaLogs typically uses port 8428 for its default HTTP API and scraping endpoints. This port allows access and interaction with the log database. While our blog focuses on performance, understanding deployment basics, like the default port, is crucial for system configuration.
In benchmarks comparing victorialogs vs loki, VictoriaLogs delivered superior performance. It achieved a 94% reduction in query latencies, decreased storage usage by approximately 40%, and consumed less than 50% of allocated CPU and RAM. VictoriaLogs also showcased 3x higher ingestion throughput, making it highly efficient.
In our benchmark of victorialogs vs loki, VictoriaLogs proved superior. It cut query latencies by 94%, reduced storage by 40%, and used over 50% less CPU/RAM. TrueFoundry in the US chose VictoriaLogs for its enhanced performance and efficiency managing ML workloads.
TrueFoundry AI Gateway delivers ~3–4 ms latency, handles 350+ RPS on 1 vCPU, scales horizontally with ease, and is production-ready, while LiteLLM suffers from high latency, struggles beyond moderate RPS, lacks built-in scaling, and is best for light or prototype workloads.


The latest news, articles, and resources sent to your inbox


.png)
.webp)
.webp)
.webp)


.webp)


