.webp)
July 2, 2026
|
5 min read

Published: June 23, 2026

Blazingly fast way to build, track and deploy your models!
Large Language Models (LLMs) have rapidly become the backbone of enterprise-grade AI applications, from copilots and chatbots to autonomous agents. But as their adoption accelerates, so do the challenges of maintaining visibility into how these models behave in real-world scenarios. For many teams, deploying LLMs feels like working with a black box: unpredictable outputs, unexplained failures, and no clear path to optimization or accountability.
This lack of transparency isn't just a developer inconvenience. It’s a serious risk. In regulated industries, it undermines compliance. In customer-facing apps, it erodes trust. Mission-critical workflows also slow down incident response and improvement cycles.
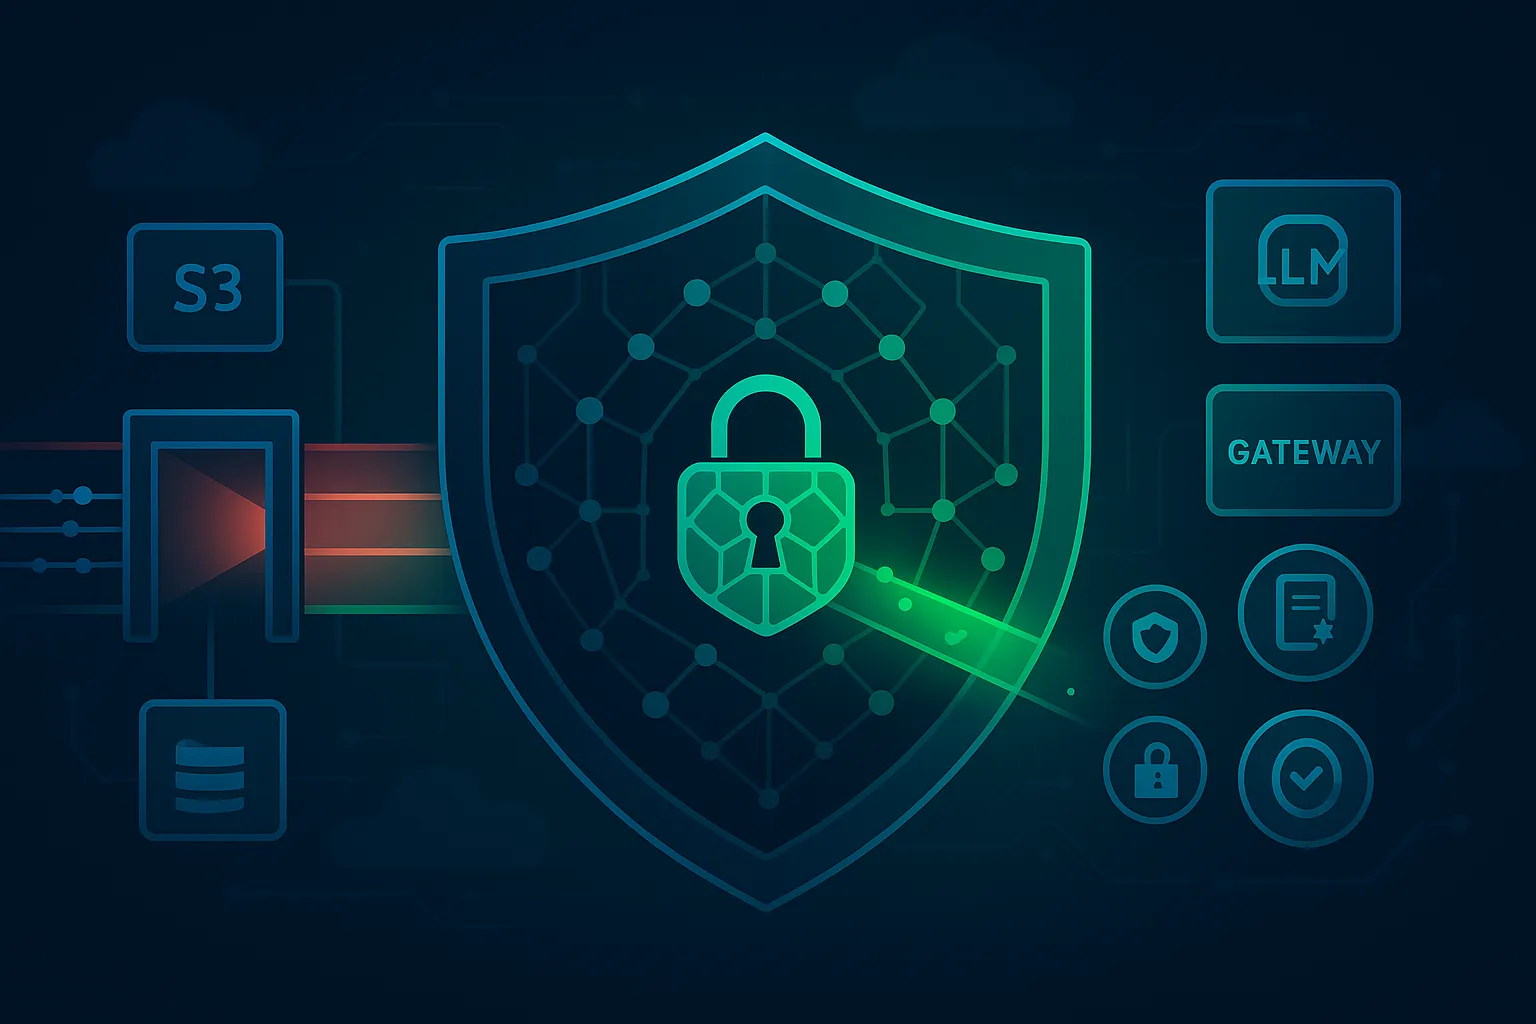
That’s where observability comes in. Just like in traditional software systems, observability in LLM pipelines gives teams the power to measure, debug, and trust their models. In this article, we explore how TrueFoundry brings glass-box visibility to LLM workflows, turning opaque inference into measurable, manageable, and auditable operations.
As organizations move from experimentation to production with LLMs, their architecture quickly evolves from simple API calls to intricate pipelines. These pipelines typically span multiple stages: gateway routing, prompt templating, external function calls, model invocation, post-processing, and app-level orchestration. Each stage introduces new variables and potential points of failure.
In such multi-component workflows, even a minor misalignment, like a poorly constructed prompt, an outdated model version, or an API latency spike, can cause output degradation, timeout errors, or silent failures. When this happens without observability, the system offers no clear trail of what went wrong or where to begin debugging. Engineers are forced to work backward from symptoms, often with limited context or data.
This black box approach is particularly problematic in enterprise environments. These use cases demand robust reliability, clear traceability, and strict compliance with internal and external policies. Without structured logging, versioned prompts, and correlated tracing, teams cannot answer simple but critical questions:
Moreover, as multiple teams—data scientists, prompt engineers, platform teams, and compliance officers—collaborate on GenAI initiatives, the need for shared visibility becomes even more urgent. Observability is no longer a backend concern. It is a cross-functional enabler and a defining capability of the best LLM observability tools used in production environments.
By instrumenting the full LLM pipeline, LLM observability transforms this opaque system into a transparent one. It allows teams to track every request from input to output, quantify performance at each stage, and identify drift in both model behavior and user experience. It empowers organizations to scale their GenAI systems with confidence, knowing they can detect anomalies, optimize bottlenecks, and ensure alignment with business and regulatory goals.
In traditional software systems, performance monitoring is a well-understood discipline that tracks CPU usage, memory consumption, request latencies, and error rates. However, in LLM pipelines, the performance envelope is different. What you need to monitor isn’t just infrastructure or service uptime, but the behavior and responsiveness of the model itself across dynamic workloads.
Each LLM interaction goes through multiple stages, and each of these introduces latency, cost, and potential failure points. The first critical metric is prompt execution time, which measures how long it takes to render and resolve a prompt before it is sent to the model. If prompts involve chaining, function calls, or contextual enrichment, this time can vary significantly and needs to be measured consistently.
Feeling blind to your LLM operations? TrueFoundry’s observability turns opaque inference into measurable, manageable, and auditable workflows.
TrueFoundry gives you full-stack insight with these observability features:
TrueFoundry provides request-level metrics for every LLM interaction, including latency, input and output token counts, model invoked, and request type (chat, completion, function call). These are automatically recorded and accessible in real time.

You can drill down into user-level metrics to track total requests, total cost incurred, average latency, and requests per second. This level of visibility enables robust LLM cost tracking solution, helping teams attribute spend across users, models, and workflows in real time.
This is essential for identifying usage spikes, abusive patterns, or high-value users.

The platform also gives visibility into aggregate usage patterns such as active users, most-invoked models, total tokens consumed (input vs output), and corresponding inference costs. These help you optimize performance and budgeting at scale.

In addition, TrueFoundry surfaces all config-related request impacts. If a model switch, prompt template update, or retry policy change affects request behavior, it's captured.

Finally, detailed logs capture all exceptions and failure categories, including rate limit violations, load balancer timeouts, fallback invocations, and invalid input errors—helping teams debug issues before they escalate.
In production LLM systems, a single user interaction often triggers a multi-stage pipeline that spans several services. Without structured tracing, it becomes nearly impossible to understand where things go wrong or why certain results differ across requests. Prompt and output tracing introduce the visibility required to observe and debug these workflows in real time.
TrueFoundry enables end-to-end tracing of every LLM request, capturing the full journey from the originating user or application to the final response. Each stage is logged in detail:
User or app request → Gateway routing → Prompt rendering → LLM API call → Post-processing → Final response

Every request is tagged with a trace ID and a correlation ID, which are automatically propagated across services. These identifiers allow teams to stitch together logs, metrics, and context across multiple systems, enabling a single-pane view into the request lifecycle.
This traceability delivers immediate value across three key areas:
TrueFoundry makes this tracing accessible with a powerful UI and API. Teams can filter by user, request type, model, or error status and then drill into individual trace views to explore tokens, latency, cost, and intermediate states, all in one place. Traces can also be integrated into external observability stacks for extended workflows.
This level of transparency turns your LLM system from a black box into a structured, explainable, and trustworthy pipeline ready for scale, compliance, and iteration.

Observability is only as powerful as the insights it can surface, and that’s where integrations and visual dashboards come in. TrueFoundry doesn’t just collect data from LLM pipelines, it turns that data into actionable intelligence through seamless integrations and intuitive dashboards built for real-world operations.
Out of the box, TrueFoundry supports native integration with leading observability tools such as OpenTelemetry, Datadog, Prometheus, and Grafana. These integrations allow organizations to consolidate LLM metrics and traces alongside infrastructure and application-level observability, creating a unified monitoring experience across the entire stack. Whether your team is already instrumented with Prometheus exporters or relies on Datadog for centralized monitoring, TrueFoundry fits naturally into your workflow.
Beyond third-party tools, TrueFoundry provides its own custom dashboards designed specifically for LLM workflows. These dashboards give teams immediate visibility into:
These dashboards are fully configurable, allowing teams to build views that reflect their organizational structure, usage patterns, and SLAs. You can group data by model, app, user segment, or business unit, ensuring the right stakeholders see the right metrics at the right time.
With TrueFoundry’s observability layer tightly integrated into both your tooling and your workflows, teams gain more than just visibility. They gain control, foresight, and confidence in every aspect of their GenAI infrastructure.
TrueFoundry’s observability tools are designed for real-world LLM challenges, helping teams resolve issues quickly and make informed decisions.
Debugging inconsistent responses

A team noticed erratic outputs from their AI assistant. Using TrueFoundry’s trace logs, they pinpointed the issue: certain prompts had higher token counts and latency. The system highlighted these anomalies, enabling the team to adjust the prompt logic and configure alerts for future latency spikes.
Fixing prompt failures in a financial chatbot

Frequent errors were reported in a chatbot used for financial compliance. By filtering failed requests and inspecting token metrics, the team found that prompts referencing long documents exceeded token limits. With TrueFoundry’s tracing, they optimized those prompts and set safeguards to catch similar failures early.
Monitoring usage and cost by team

A platform team needed visibility into which tenants were driving model usage. TrueFoundry’s per-user and per-team dashboards surfaced token usage, request counts, and cost metrics. One team’s test workload was consuming excessive resources, so they shifted it to a smaller model and set budget alerts.
These use cases show how observability with TrueFoundry enables fast debugging, better cost control, and increased reliability across production LLM pipelines.
Adopting observability across LLM pipelines brings tangible advantages across engineering, product, and compliance teams:
By making LLM systems observable, teams move from operating in the dark to working with clarity, speed, and control.
To build reliable and scalable LLM systems, observability should be an intentional part of your architecture from day one. Here are key practices to follow:
TrueFoundry enables all of these best practices out of the box. From automatic instrumentation and trace propagation to custom alerting and audit-ready logs, it provides teams with a robust, production-grade observability layer purpose-built for GenAI workflows.
As GenAI moves from prototypes to production, visibility becomes non-negotiable. Teams can no longer afford to operate LLM systems as black boxes, especially when reliability, cost, and compliance are on the line. Observability transforms these pipelines into transparent, measurable, and controllable systems that support rapid iteration and enterprise-grade trust.
TrueFoundry makes this transition seamless. By combining real-time metrics, end-to-end tracing, and flexible integrations, it turns every LLM workflow into a glass box that is fully observable, auditable, and ready to scale.
TrueFoundry AI Gateway delivers ~3–4 ms latency, handles 350+ RPS on 1 vCPU, scales horizontally with ease, and is production-ready, while LiteLLM suffers from high latency, struggles beyond moderate RPS, lacks built-in scaling, and is best for light or prototype workloads.


The latest news, articles, and resources sent to your inbox
© 2026 All rights reserved.


.png)
.webp)
.webp)

.webp)
.webp)
.webp)
.png)