

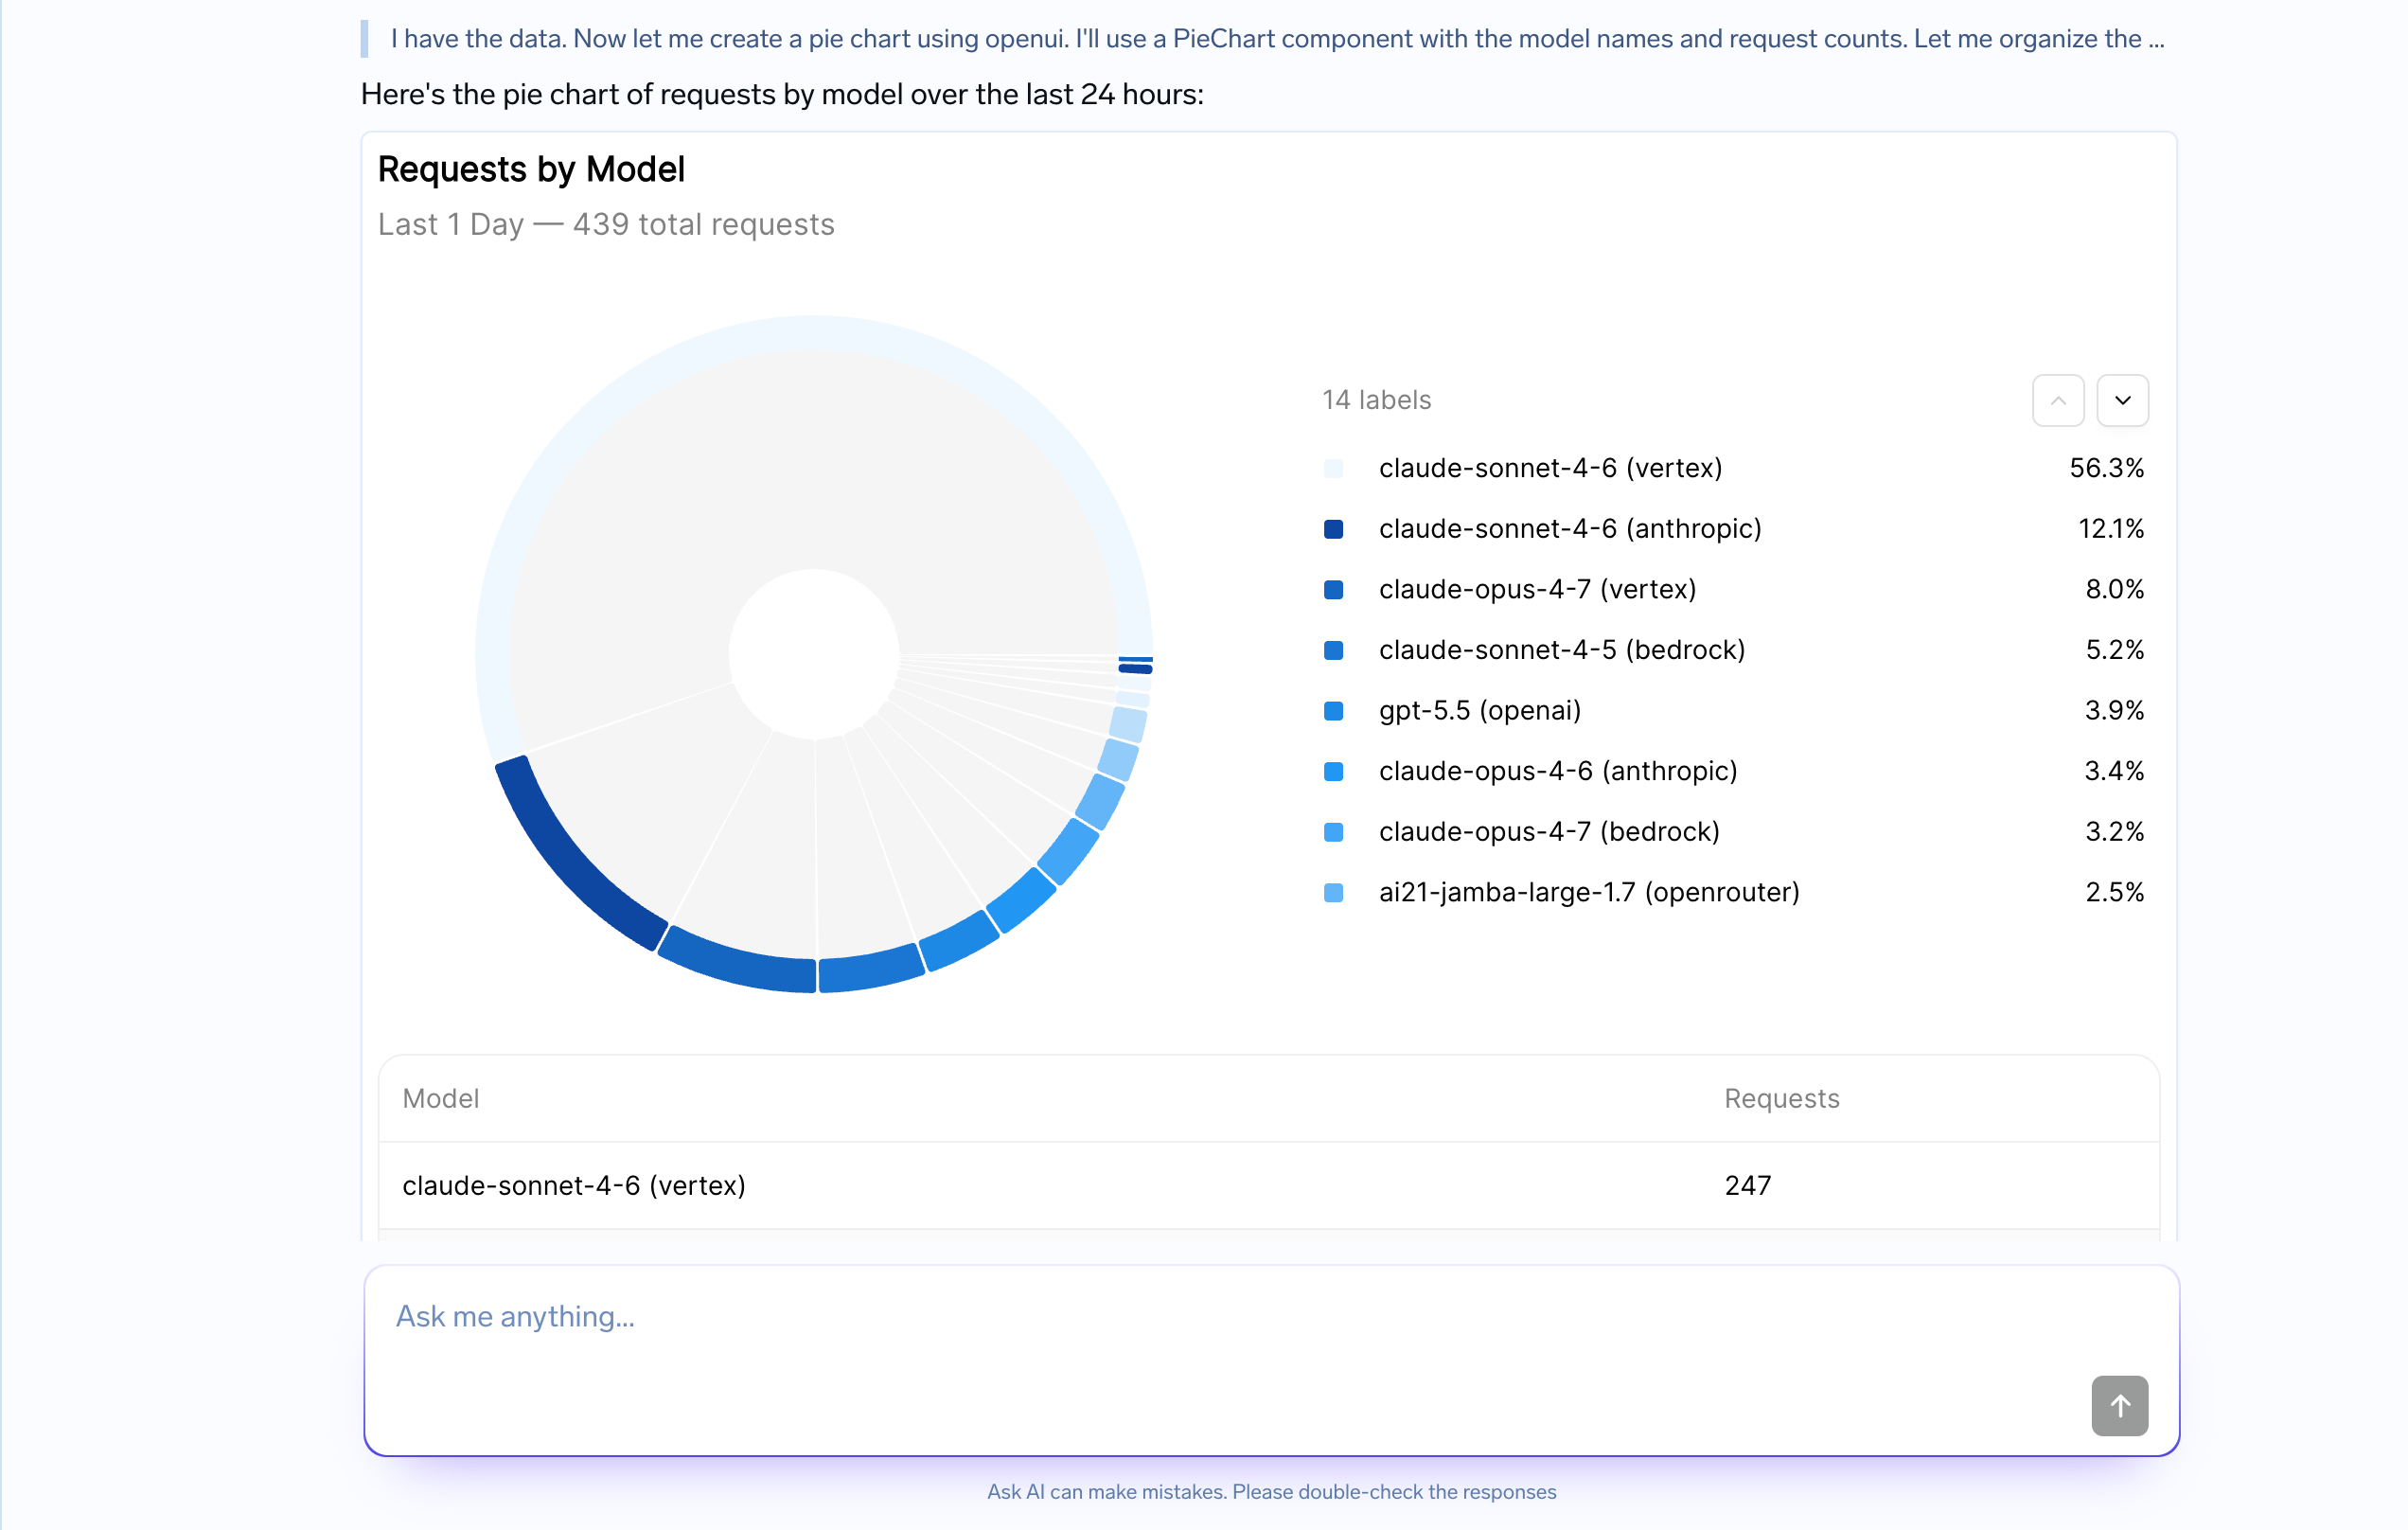
The agent renders a pie chart of request volume by model — a real interactive component, not a markdown table
Why it matters
A few patterns where Generative UI changes the experience dramatically:- Analytics & dashboards — “Show me request volume by model” returns a chart with a sortable table, not a paragraph of numbers.
- Comparisons — “Compare cost across my last 3 deployments” returns a bar chart and a side-by-side table.
- Reports & summaries — Multi-section results with KPI cards, charts, and supporting data laid out cleanly.
- Forms & guided actions — The agent gathers structured input from the user — dropdowns, toggles, text fields — instead of asking question after question in chat.
- Browsable results — Search results, log entries, or resources rendered as cards or tables the user can scan.
How it works
Generative UI is not a separate tool call. The agent simply writes a small, streaming-friendly snippet inside its normal assistant message, and the client renders it on the fly as tokens arrive. Under the hood, this uses OpenUI — an open standard for agent-generated UI:- OpenUI Lang — A compact, streaming-first language for describing UI. ~67% more token-efficient than equivalent JSON, so charts and tables stream in fast.
- Component library — Built-in charts, tables, forms, cards, layouts, and more — ready to use or extend with your own design system.
- Streaming renderer — Parses and renders UI progressively in React as the response streams in.
- Safe by default — No arbitrary code execution. The agent can only emit components you’ve registered.
model.message events (and their deltas). The only difference is that some message content contains an ```openui fenced block that the client extracts and renders as React components.
When to use Generative UI
Turn it on whenever your agent’s answers benefit from visual structure:
The agent can still include brief text alongside the UI to explain the result — it just stops repeating values that the components already show.
Skip Generative UI for simple answers where markdown is enough — a short explanation, a bullet list, or a code block. The overhead of structured components is not worth it for small tasks. Generative UI is also not a replacement for server-side actions: if a UI button needs to trigger a follow-up, the client sends that back as a normal user message in the next turn.
Available components
The OpenUI built-in library covers the patterns most agents need out of the box:
Need something custom? Register your own components using
defineComponent and createLibrary from @openuidev/react-lang. The agent will only ever emit components that are registered — it cannot generate arbitrary HTML or code.
Example
User
Show me a dashboard comparing request volume and error rate across my three production models.
Assistant
I will summarize the model traffic visually.The highest traffic is on
gpt-4.1, while llama-3.1 has the highest error rate despite lower volume.Client usage
For the streaming event format and a full working client example, see Complete example.Disabling Generative UI
To turn it off, setconfig.generative_ui.enabled: false on the agent. See config.generative_ui in the agent manifest reference.