

Plain text and markdown work for short answers, but they fall flat the moment an agent needs to show a dashboard, compare metrics across models, render a sortable table, or guide a user through a form. Users end up squinting at walls of numbers when a single chart would have told the story in seconds. Generative UI lets your agent respond with real, interactive components — charts, tables, cards, forms, layouts — that your client renders as actual React UI. The agent decides what to show; the harness ships it in a standard format your renderer turns into pixels.Documentation Index
Fetch the complete documentation index at: https://www.truefoundry.com/llms.txt
Use this file to discover all available pages before exploring further.
Why it matters
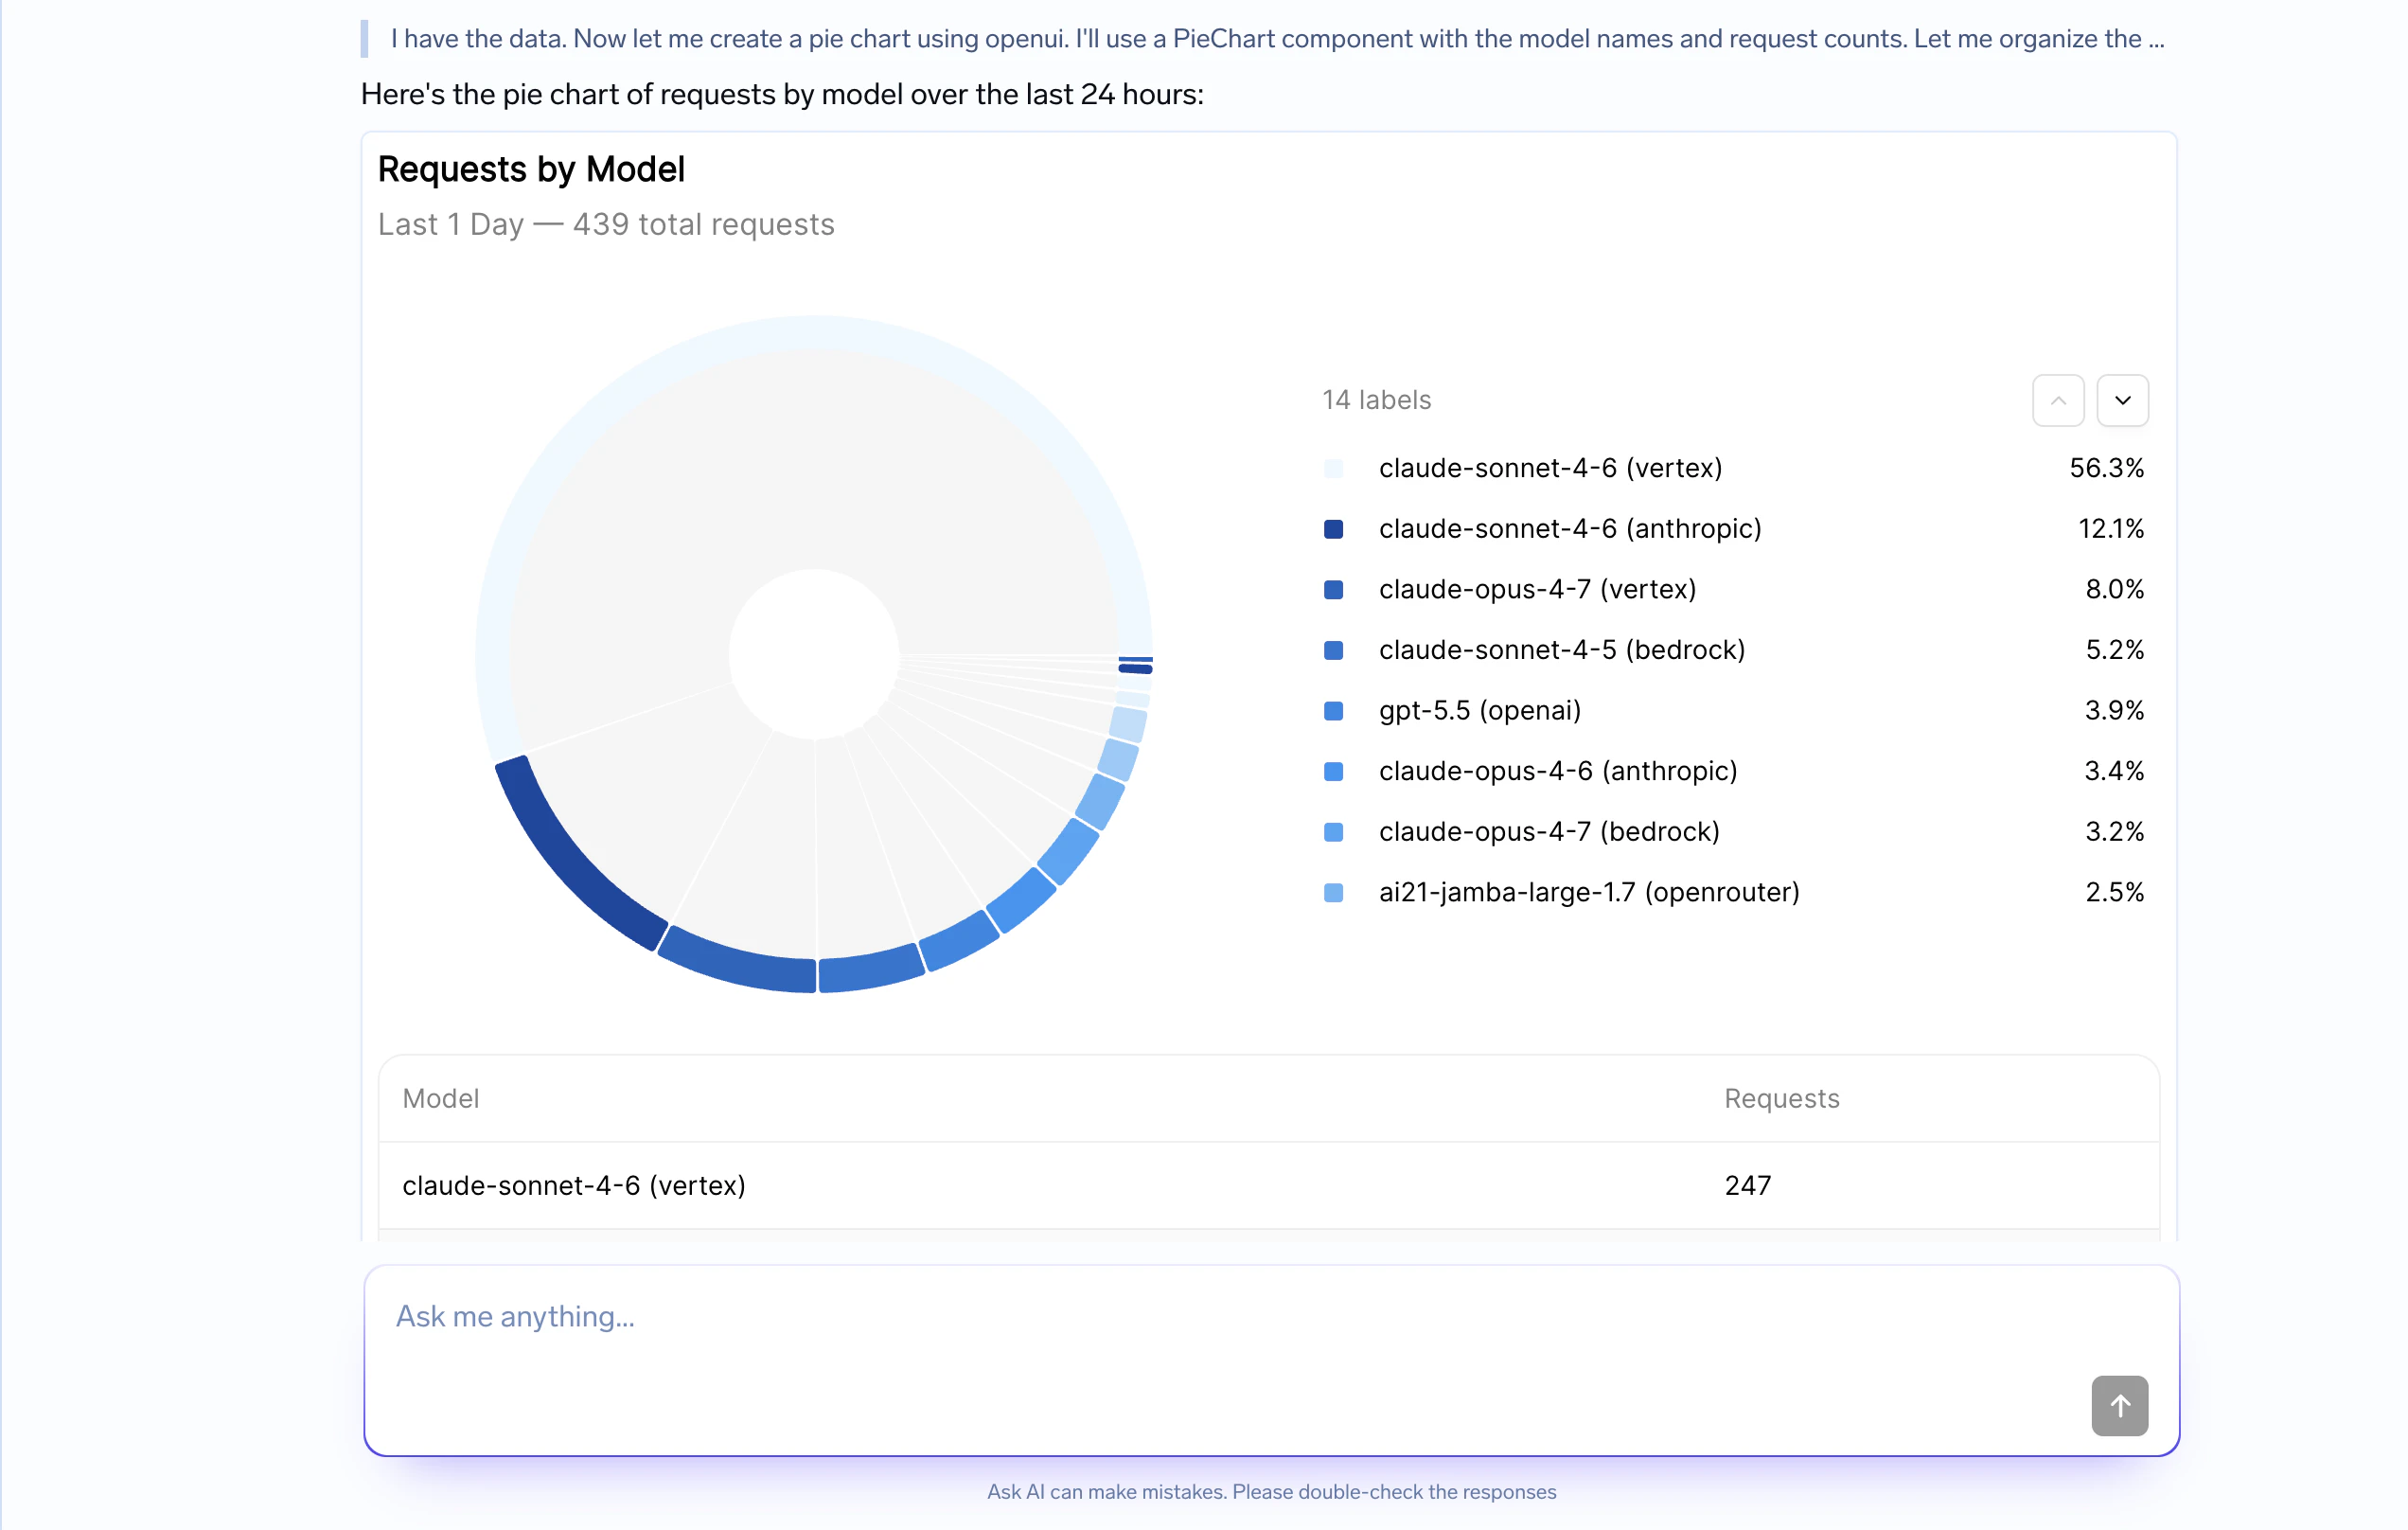
A few patterns where Generative UI changes the experience dramatically:- Analytics & dashboards — “Show me request volume by model” returns a chart with a sortable table, not a paragraph of numbers.
- Comparisons — “Compare cost across my last 3 deployments” returns a bar chart and a side-by-side table.
- Reports & summaries — Multi-section results with KPI cards, charts, and supporting data laid out cleanly.
- Forms & guided actions — The agent gathers structured input from the user — dropdowns, toggles, text fields — instead of asking question after question in chat.
- Browsable results — Search results, log entries, or resources rendered as cards or tables the user can scan.
Enabling Generative UI
This is the entire setup on the agent side — flip the capability on, and the agent gains the ability to emit UI in its responses.Open your agent in the Agent Harness
Go to the agent’s configuration in the TrueFoundry Agent Playground.
Enable Generative UI rendering
Toggle on Generative UI under the agent’s capabilities. The harness will automatically inject the OpenUI component library and instructions into the agent’s system prompt — you do not need to write any prompt logic yourself.
Use a client that renders OpenUI
The TrueFoundry Agent Playground renders OpenUI out of the box. If you are building your own client, drop in the OpenUI React renderer (a few lines — see Client usage) and you are done.
How it works
Generative UI is not a separate tool call. The agent simply writes a small, streaming-friendly snippet inside its normal assistant message, and the client renders it on the fly as tokens arrive. Under the hood, this uses OpenUI — an open standard for agent-generated UI:- OpenUI Lang — A compact, streaming-first language for describing UI. ~67% more token-efficient than equivalent JSON, so charts and tables stream in fast.
- Component library — Built-in charts, tables, forms, cards, layouts, and more — ready to use or extend with your own design system.
- Streaming renderer — Parses and renders UI progressively in React as the response streams in.
- Safe by default — No arbitrary code execution. The agent can only emit components you’ve registered.
agent.message events. The only difference is that some message content contains an ```openui fenced block that the client extracts and renders as React components.
When to use Generative UI
Turn it on whenever your agent’s answers benefit from visual structure:| Use case | What the agent renders |
|---|---|
| Dashboards | KPI cards, charts, and tables for metrics, trends, and comparisons |
| Tables | Sortable structured data — logs, resources, results to scan |
| Charts | Bar, line, and pie charts that show patterns faster than prose |
| Cards & layouts | Summary panels, multi-section reports, side-by-side comparisons |
| Forms | Inputs, dropdowns, and selections that guide the user’s next action |
Skip Generative UI for simple answers where markdown is enough — a short explanation, a bullet list, or a code block. The overhead of structured components is not worth it for small tasks. Generative UI is also not a replacement for server-side actions: if a UI button needs to trigger a follow-up, the client sends that back as a normal user message in the next turn.
Available components
The OpenUI built-in library covers the patterns most agents need out of the box:| Category | Components |
|---|---|
| Layout | Stack, Card, Tabs, Accordion |
| Text | TextContent, Markdown |
| Data | Table, Col |
| Charts | BarChart, LineChart, PieChart, Series |
| Input | TextInput, Select, Button, Form |
| Media | Image, Link |
defineComponent and createLibrary from @openuidev/react-lang. The agent will only ever emit components that are registered — it cannot generate arbitrary HTML or code.
Example
User
Show me a dashboard comparing request volume and error rate across my three production models.
Assistant
I will summarize the model traffic visually.The highest traffic is on
gpt-4.1, while llama-3.1 has the highest error rate despite lower volume.