

What you get today
Unified metrics
Every registered agent — wherever it actually runs — reports into one dashboard: request counts, latency percentiles, error rates, and usage over time. This is the “which agents are active, and what should we invest in?” view, and it works identically for an agent on Bedrock, LangGraph, or a custom HTTP service.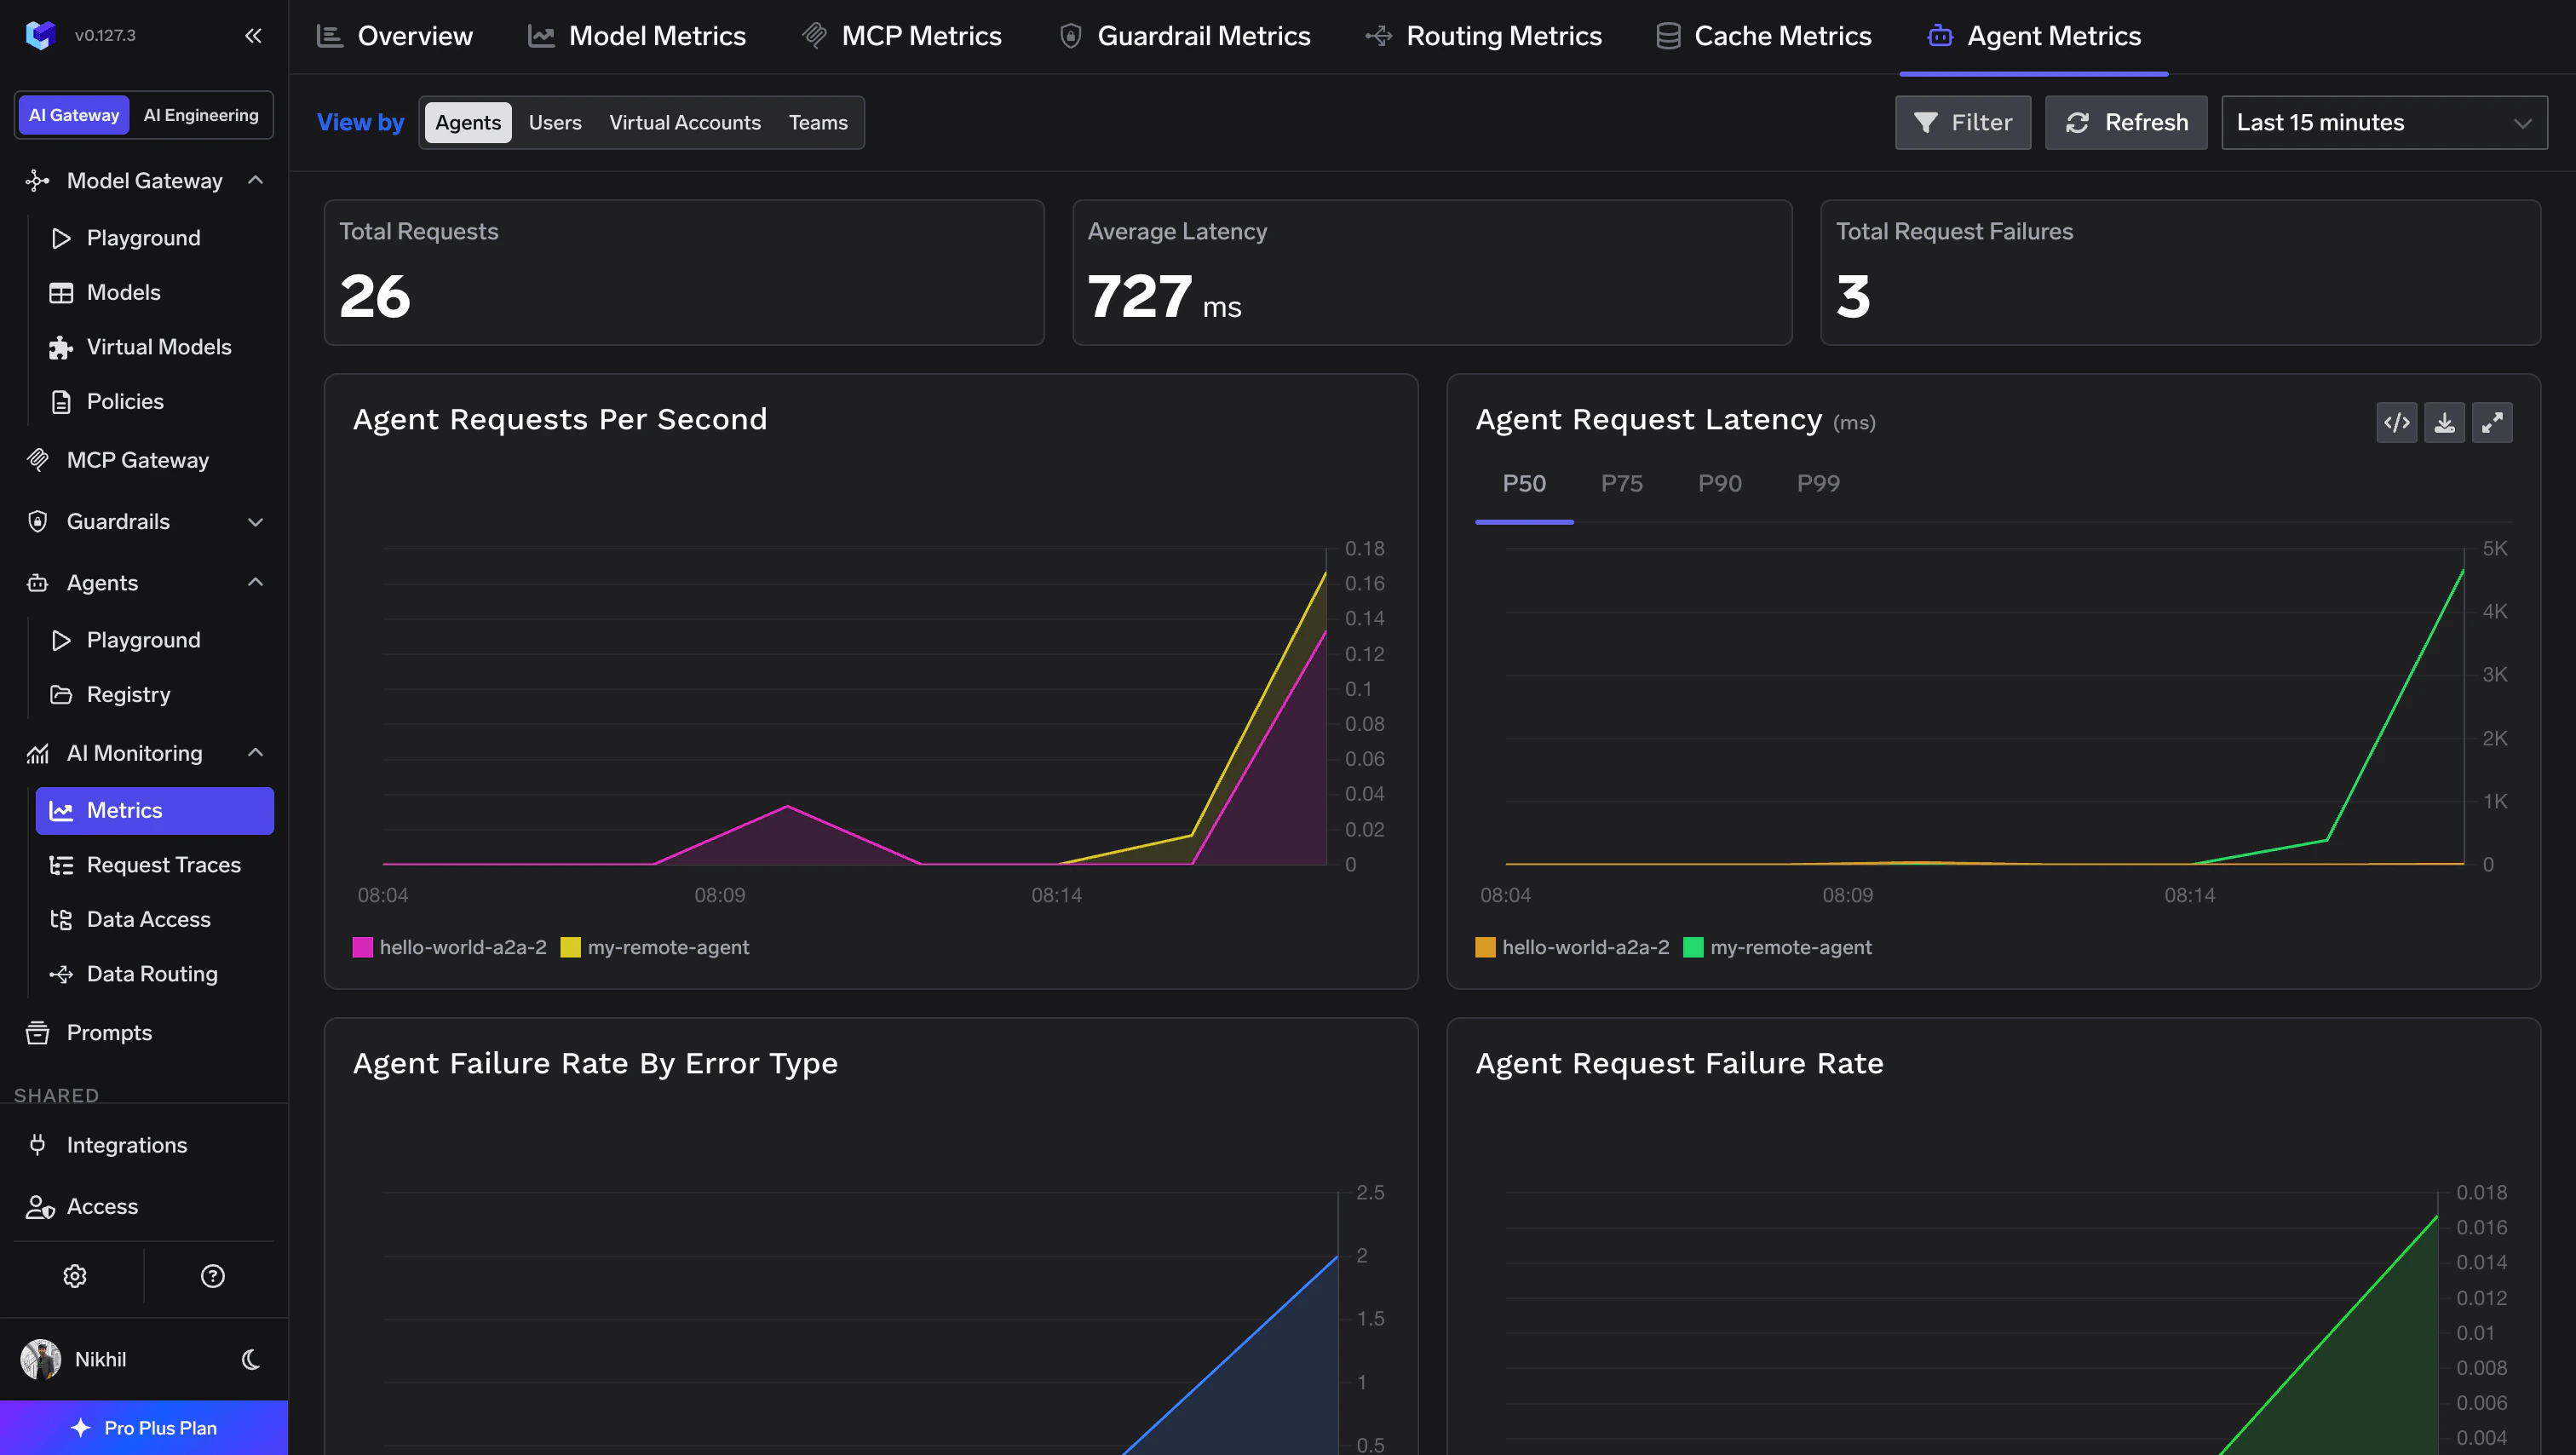
Unified Agent Metrics dashboard showing request volume, latency, and failure rates
Request traces with per-hop attribution
Navigate to AI Monitoring → Request Traces to inspect individual requests. Each trace records which agent made the call and which user it acted for — the per-hop attribution the blueprint is built on — along with the full payload (including the JSONRPC request/response for A2A agents).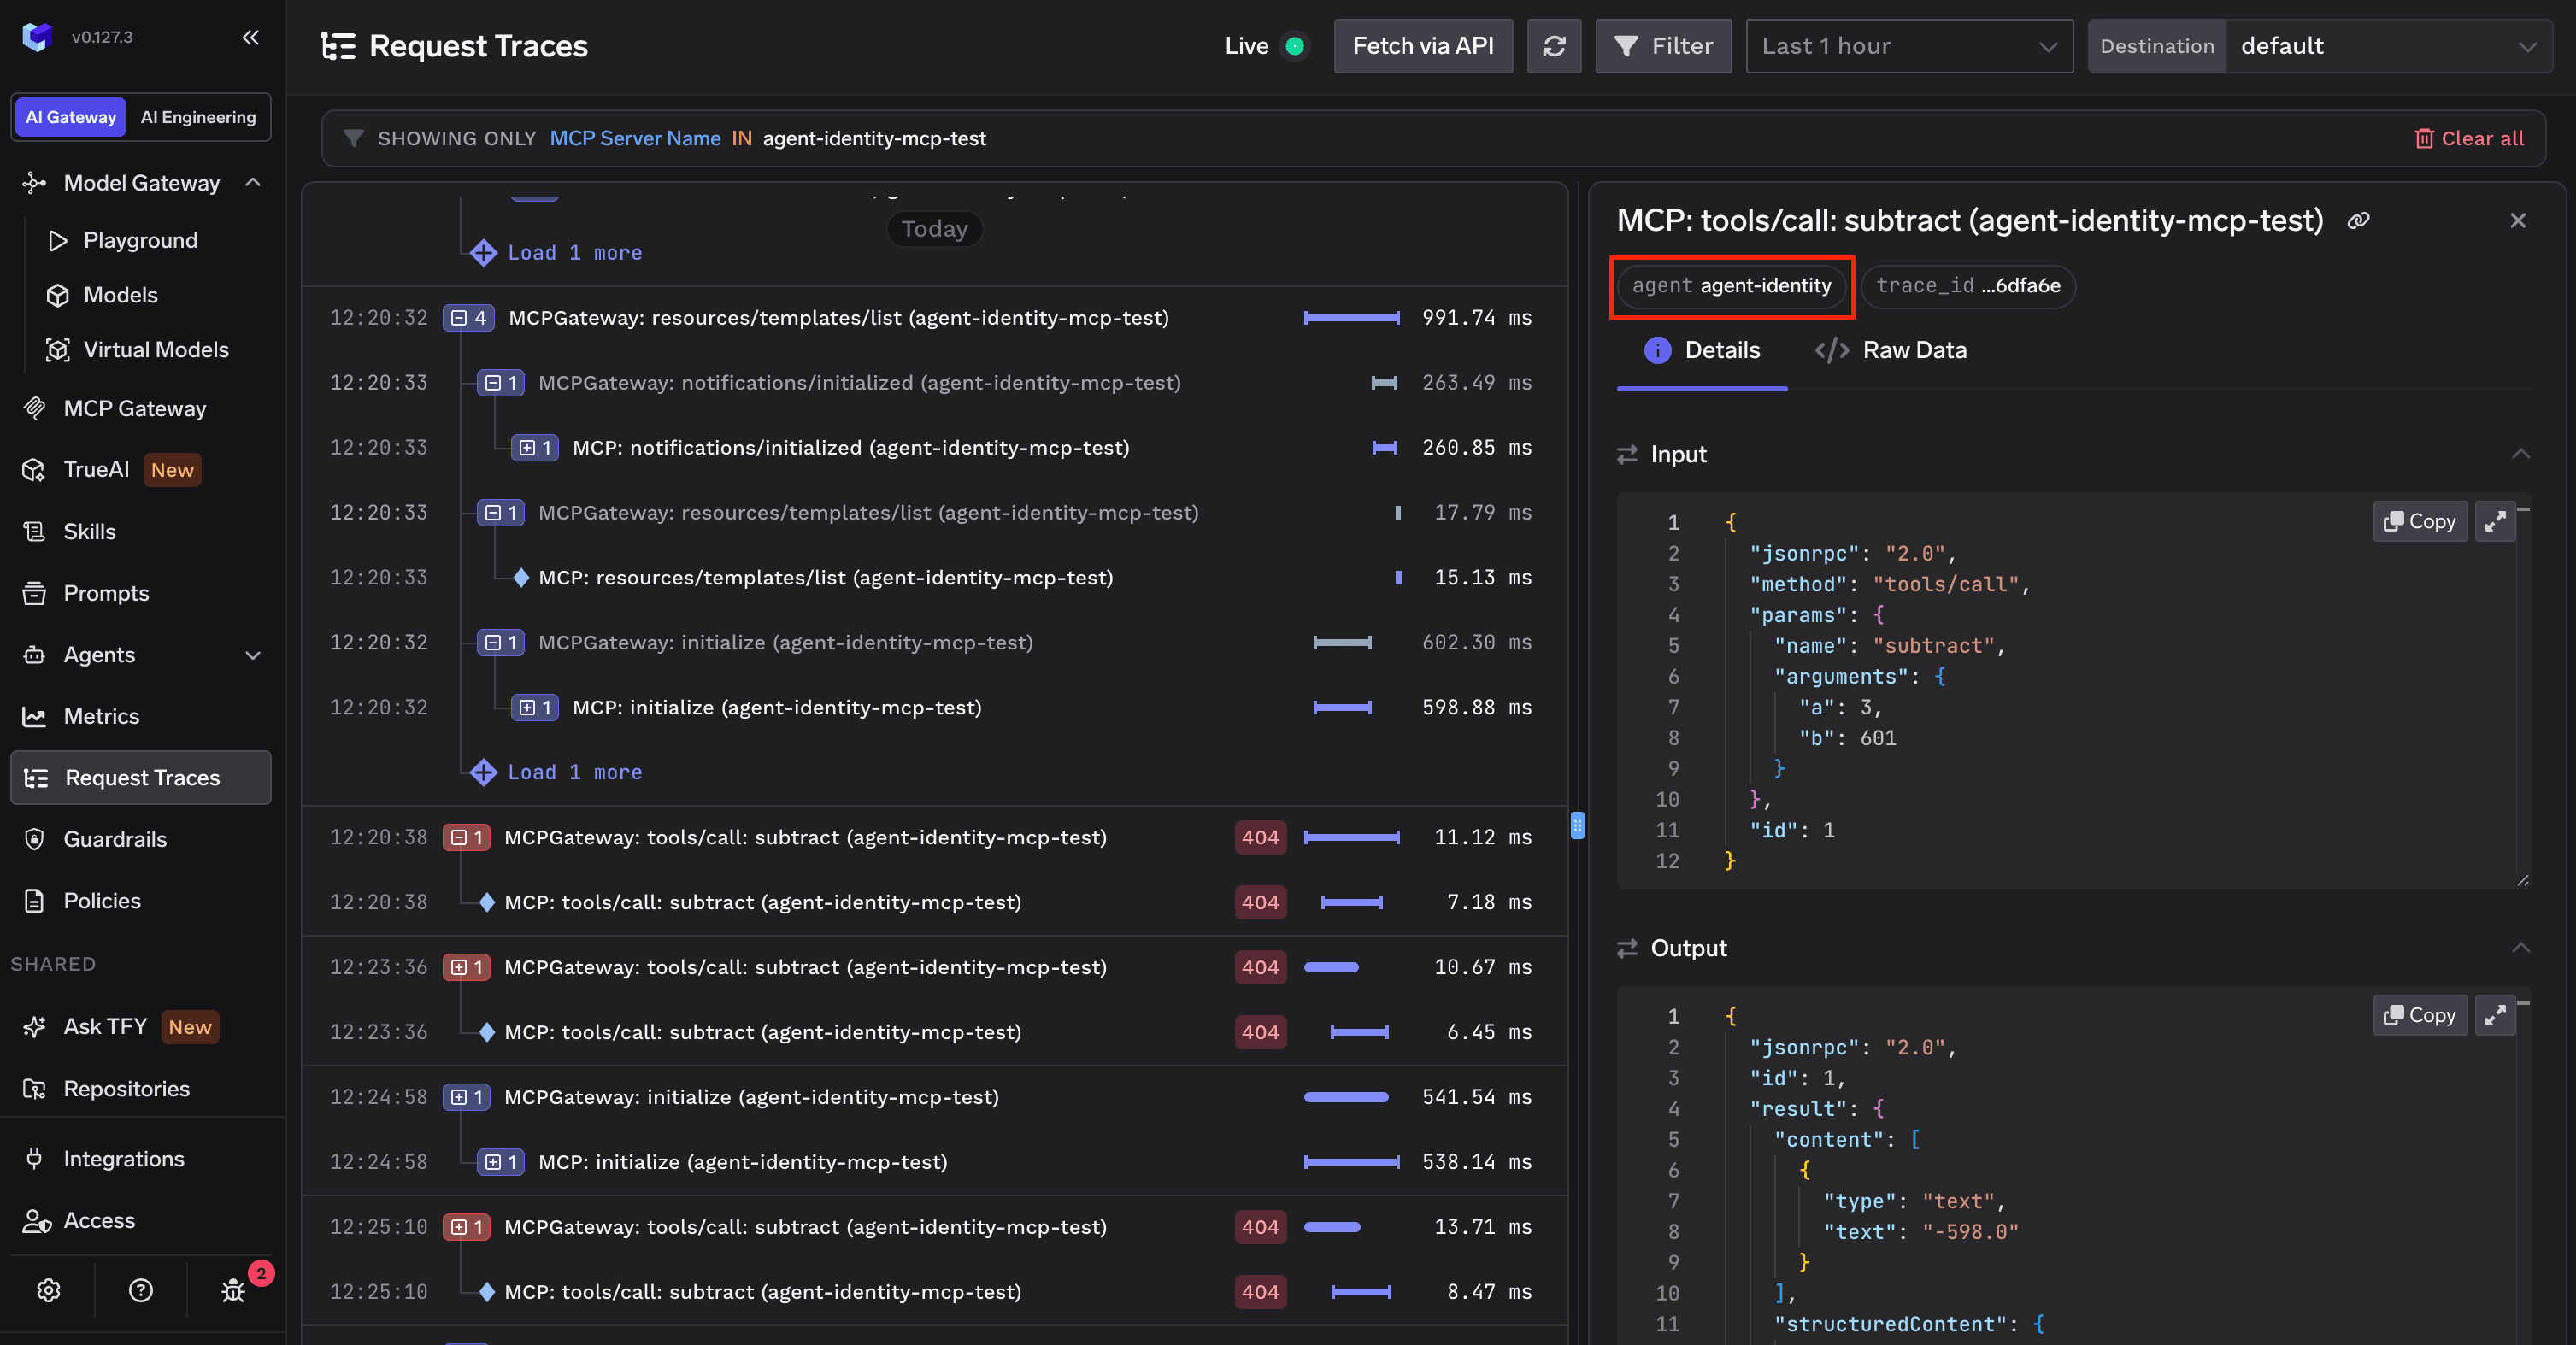
Request Traces for an A2A agent showing the JSONRPC request and response
Guardrail execution in traces
Every guardrail that ran on a hop appears as its own span: what it checked, whether it passed, what it found or redacted, and how long it took. Traces are logged for blocked requests too — a denied hop is audit evidence, not a gap.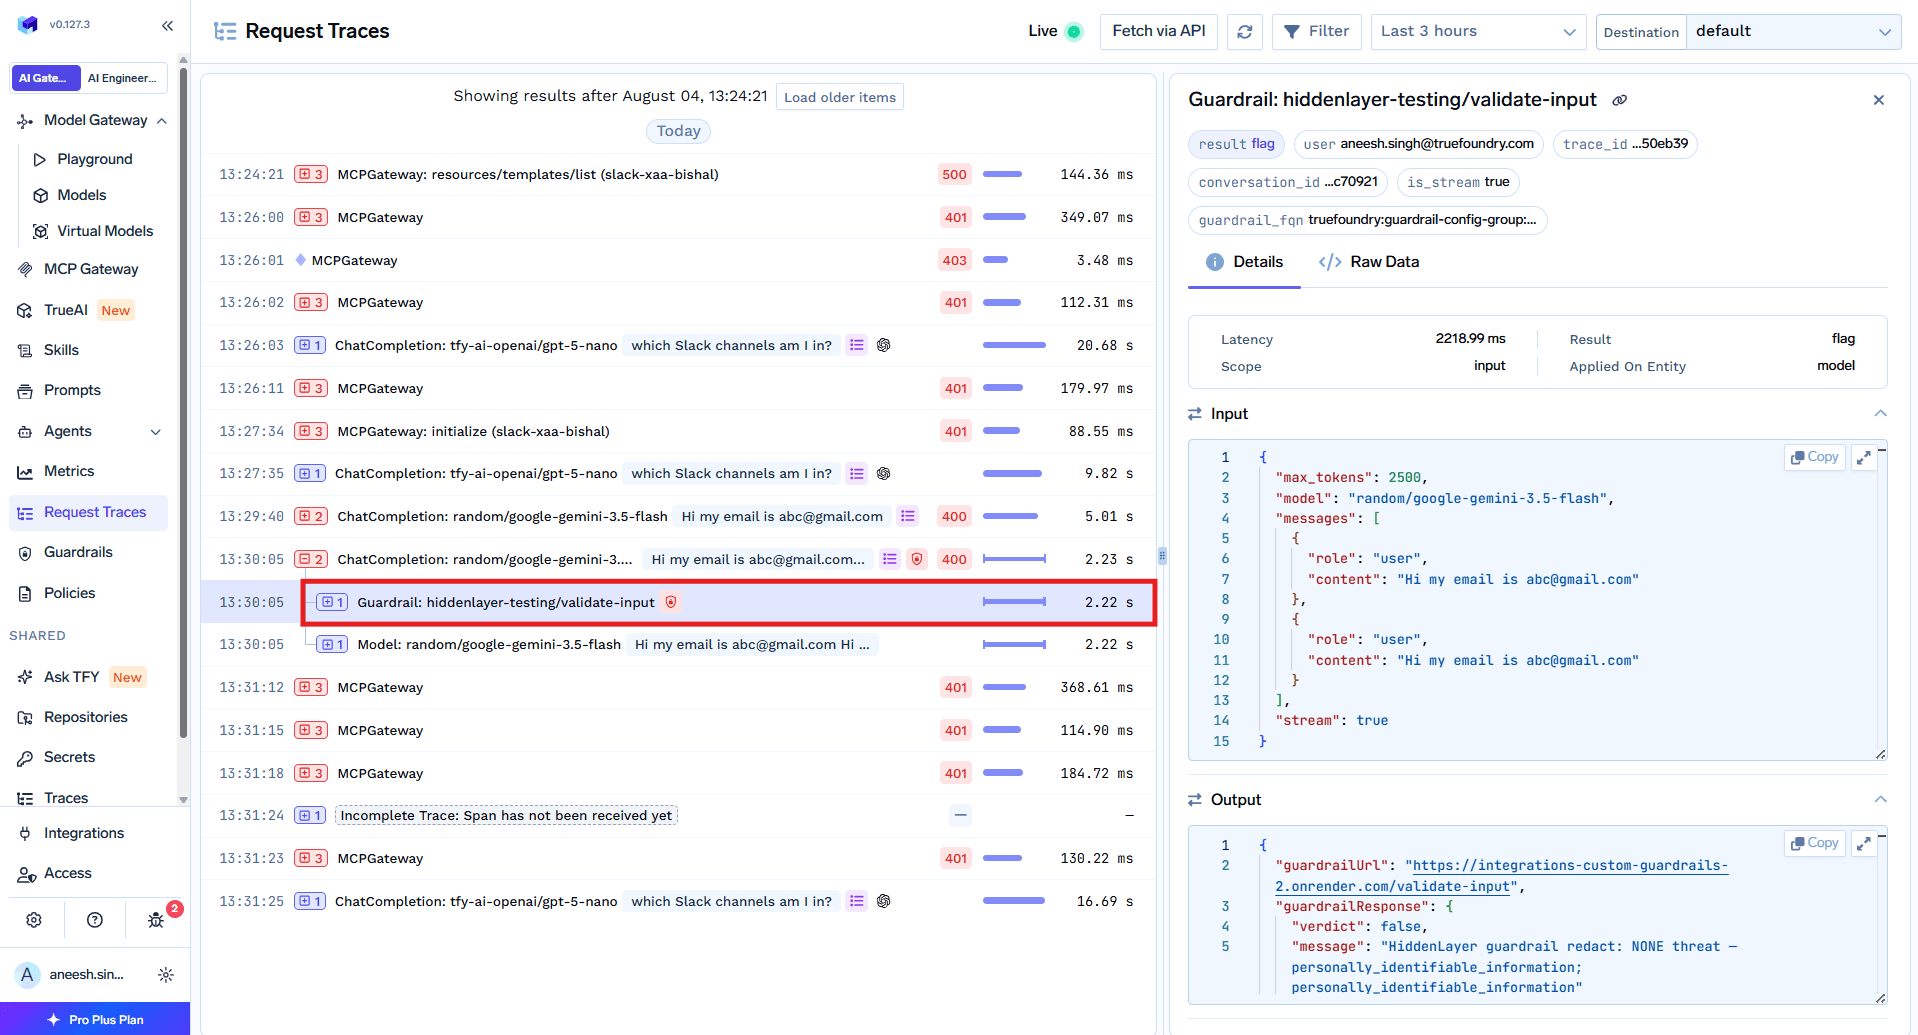
A guardrail span in Request Traces with latency, result, and findings
Activity logs per agent
Each agent’s row in the Agent Registry has an Activity Logs entry in its ⋮ menu — administrative history for that specific agent, alongside its access control and token management.The complete picture
Full agent observability has to answer more than “how many requests?” — it has to connect what the agent was allowed to do (its registry entry and grants) with what it actually did (the trace record). That connection is what turns logs into governance:Two of these deserve emphasis, because they are what auditors and security teams actually ask for:
- Drift detection operationalizes least privilege. Grants tend to accumulate; usage data is the only honest input for trimming them. “This agent has access to 40 tools and has called 6 in 90 days” is an actionable finding.
- The actor chain is what makes multi-agent systems auditable. Without it, a sub-agent’s tool call is attributed to the sub-agent alone; with it, you can trace the action back through every delegation step to the human who started it.
How the pieces fit
The reason this works without instrumenting your agents: enforcement and observation happen at the same place. The gateway that authenticates a hop and runs its guardrails is also the component that records it — so the audit trail is complete by construction for every governed hop, and an agent cannot opt out of being observed any more than it can opt out of being authorized. The loop closes on the left: usage data feeds back into the registry entry, where grants get trimmed and — when something is wrong — the identity gets suspended. That feedback loop is the difference between logging and governance.Next
- Agent Registry — the registry entry that observability data is attributed to.
- Guardrails for Agents — the checks whose results appear as trace spans.
- Implementation Overview — how observability fits the full TrueFoundry governance setup.