

Agent sessions
Sessions in the TrueForge portal lists every session across all your agents. Each entry is one conversation, labelled with its opening message, the agent it ran against, and its turn count, cost, and duration — so you can scan for expensive or unusually long runs without opening anything. Sessions can be narrowed to a single agent or to a time window.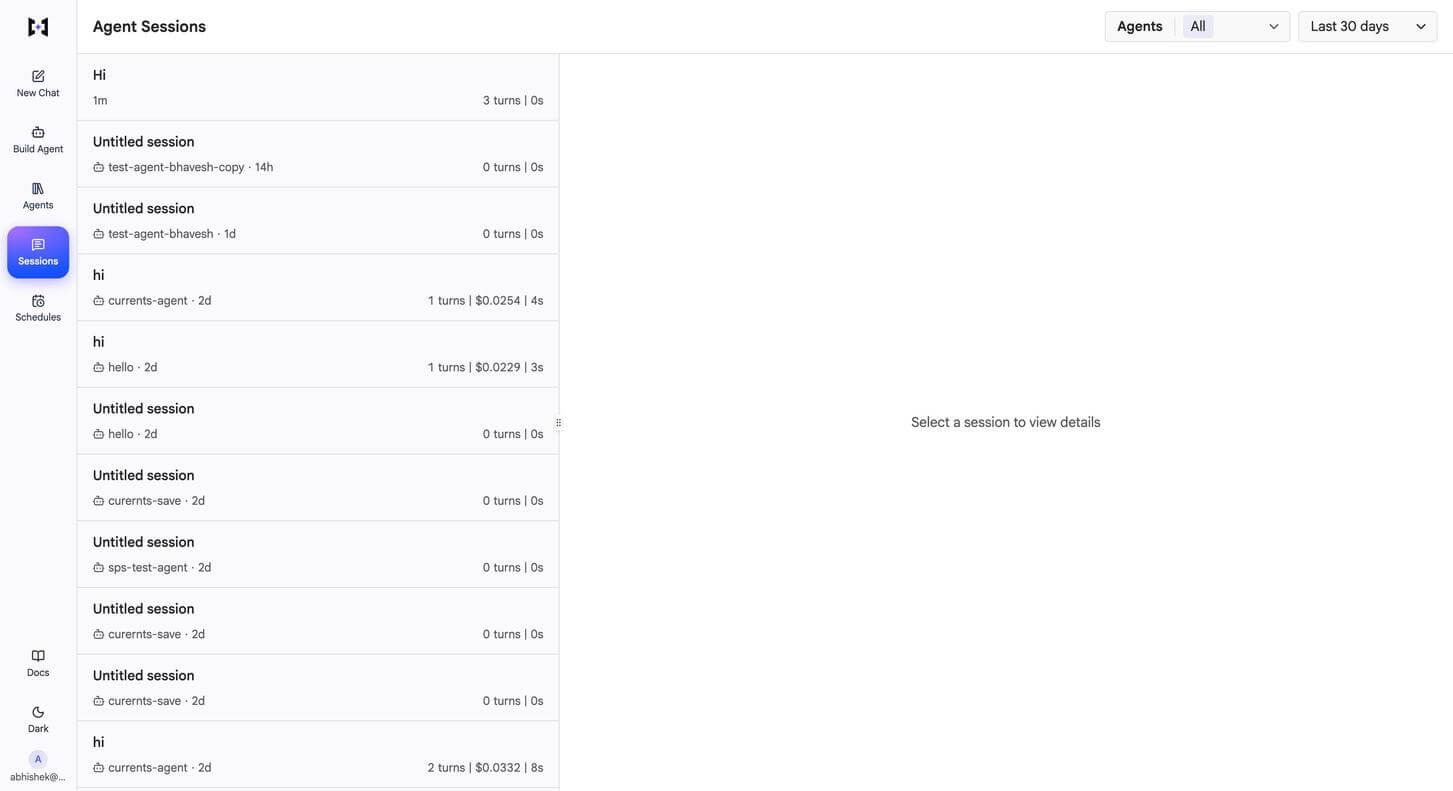
Sessions lists every conversation across all agents with its agent, turn count, cost, and duration
Session detail
Opening a session shows the whole run: aggregate metrics at the top, a timeline of what the harness was doing, and the full transcript below.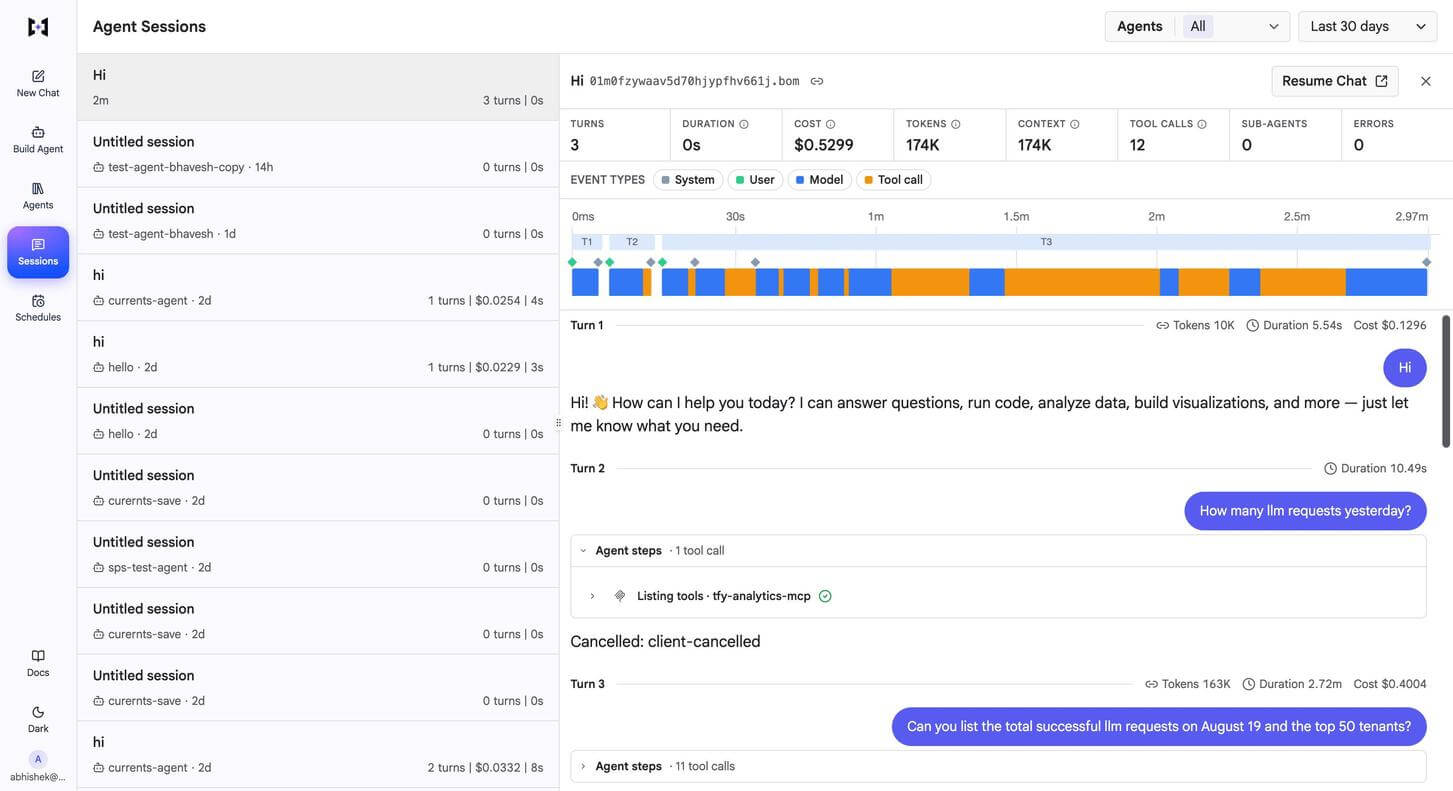
Session detail shows aggregate metrics, the event-type timeline, and the turn-by-turn transcript with expandable agent steps
Beneath them, the event-type timeline breaks the run into system, user, model, and tool-call segments across each turn, which makes it obvious where the time actually went — a turn dominated by orange is tool-bound, one dominated by blue is model-bound.
The transcript carries its own tokens, duration, and cost per turn, and every turn’s agent steps can be expanded to see the individual tool calls the harness made, in order, with their outcome. That is usually enough to find where a run went wrong: a cancelled turn, a failing MCP server, or a tool that returned nothing useful.
A session can be resumed as a live chat from its detail view, and its link shared with anyone who has access to the agent.
One pane of glass across the stack
Because the harness runs in the same gateway plane as model and MCP traffic, agent sessions are not a separate silo — they inherit the full AI Gateway observability surface:Analytics
Model, MCP, and agent traffic in one analytics view, filterable by user, team, and agent.
Request logging
Full request and response logs for every model and tool call, subject to your redaction policy.
Export to OpenTelemetry
Stream traces and metrics to your own observability backend.
Prometheus and Grafana
Scrape gateway metrics and build dashboards and alerts.