

This section is applicable only if you are self-hosting the control plane. If TrueFoundry is hosting the control plane, monitoring is fully managed and no setup is required on your end.
truefoundry Helm chart includes basic monitoring — critical metrics are exposed via Prometheus ServiceMonitors and PodMonitors, and a Grafana dashboard is available to visualize them.
Enabling Control Plane Monitoring
To enable the built-in monitoring stack, settruefoundryMonitoring.enabled to true in your truefoundry-values.yaml:
truefoundry-values.yaml
Using an Existing Prometheus or VictoriaLogs
If you already have Prometheus or VictoriaLogs running in your cluster, point the monitoring stack to them usingexternalServices:
truefoundry-values.yaml
Installing a Dedicated Prometheus or VictoriaLogs
If you do not have an existing Prometheus or VictoriaLogs instance, the Helm chart can install them for you:truefoundry-values.yaml
Configuring Grafana
When monitoring is enabled, a Grafana instance is deployed with pre-built control plane dashboards. Configure JWT authentication so that platform admins can access Grafana seamlessly athttps://<your-domain>/admin/grafana/:
truefoundry-values.yaml
After applying the configuration, upgrade the Helm release:
Complete Example
Here is a fulltruefoundryMonitoring configuration that installs a dedicated Prometheus, VictoriaLogs, and Grafana:
truefoundry-values.yaml
Accessing the Grafana Dashboard
Once monitoring is enabled and the Helm release is upgraded, platform admins can access the Grafana dashboard at:- Only users with the admin role in TrueFoundry can access this endpoint.
- Make sure to include the trailing
/at the end of the URL.
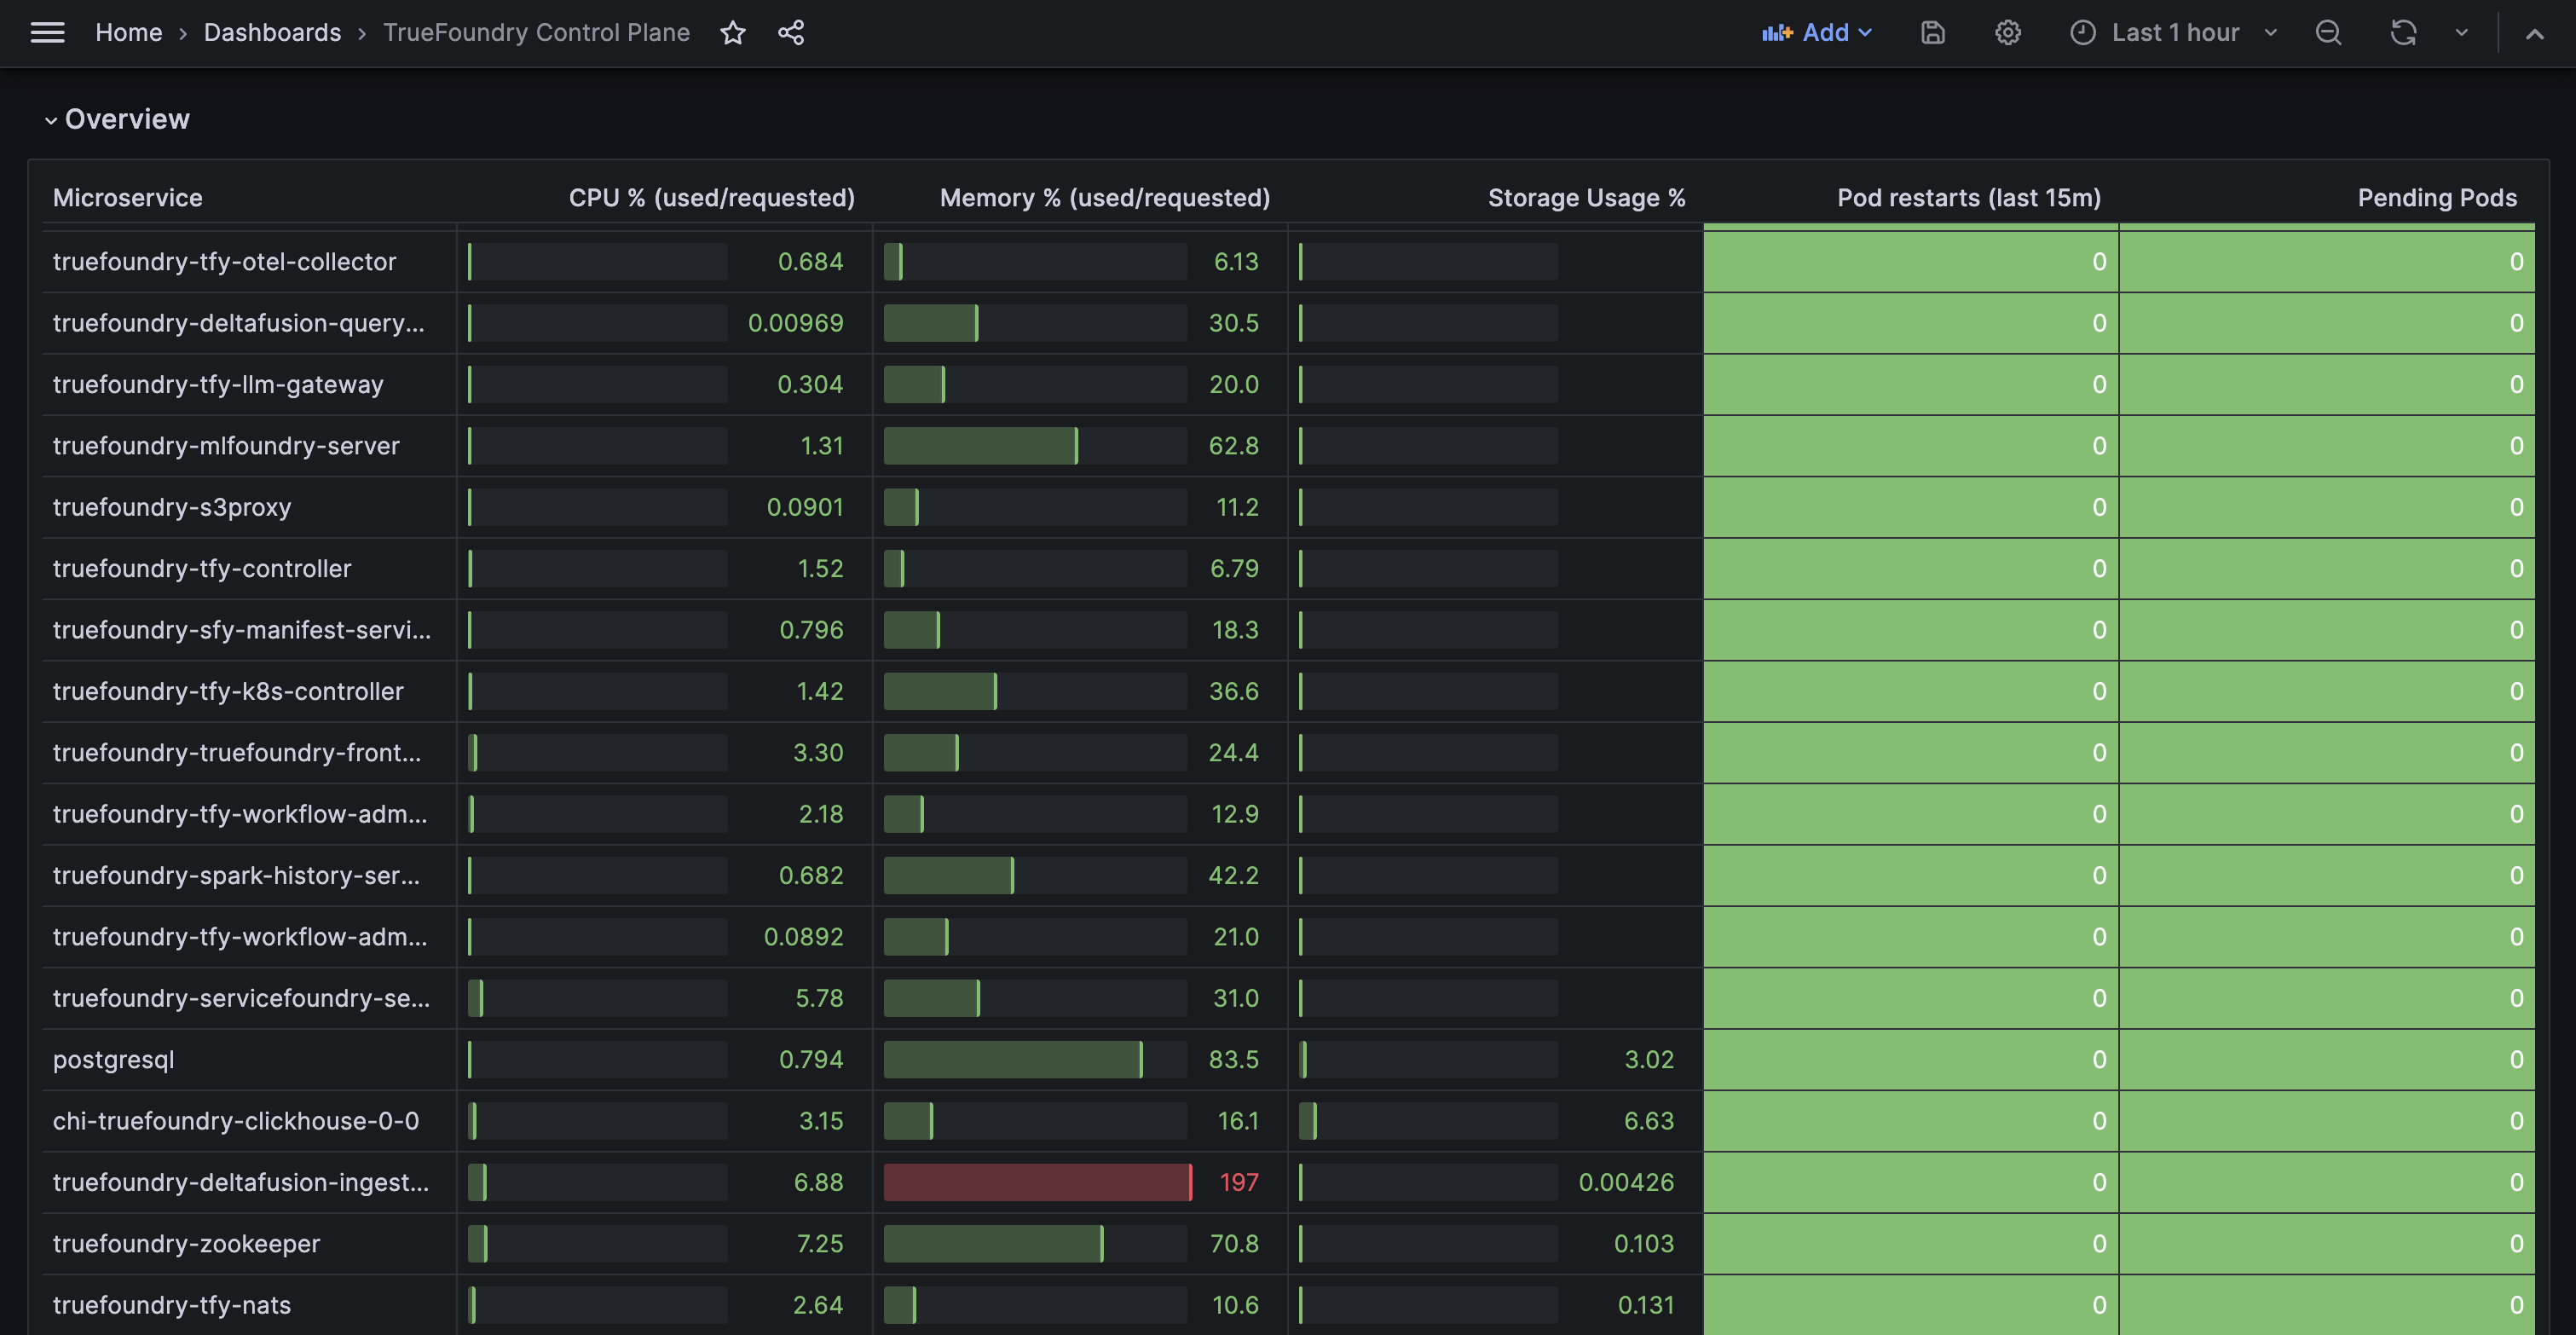
TrueFoundry Control Plane Grafana Dashboard
Using Your Own Grafana
If you prefer to use an existing Grafana instance instead of the one managed by TrueFoundry:1
Install Grafana via the platform UI
Navigate to Platform > Clusters, click on the control plane cluster, and install Grafana from the Add-Ons tab.
2
Or import the dashboard manually
Download the dashboard JSON from here and import it into your Grafana instance.
Alerting
In most cases, when you install the control plane, TrueFoundry sets up alerting to notify the TrueFoundry team of any incidents. You can add your own alert channels alongside this.Enabling Alerts
Enable alerting by settingmonitoring.enabled to true and providing the API URL supplied by the TrueFoundry team:
truefoundry-values.yaml
Disabling TrueFoundry Team Alerts
To stop sending alerts to the TrueFoundry team:truefoundry-values.yaml
Adding Your Own Slack Channel
To send alerts to your own Slack channel, update thechannel and apiURL fields:
truefoundry-values.yaml
Multiple Alert Channels
To send alerts to both the TrueFoundry team and your own channels, use theadditionalReceivers field:
truefoundry-values.yaml
Full Alerting Configuration Reference
truefoundry-values.yaml