> ## Documentation Index
> Fetch the complete documentation index at: https://www.truefoundry.com/llms.txt
> Use this file to discover all available pages before exploring further.
# Log & Monitor Custom Metrics
> Monitor logs and custom metrics for observability.
In this section, we will cover how to log your custom application metrics and then use TrueFoundry to monitor them. Your custom application metrics can be something like the number of times an API was called, the time taken for a function to execute, or something completely custom. TrueFoundry by default uses `Prometheus` to scrap all the metrics exposed at `/metrics`endpoint of your server.
## Logging metrics
Let us understand with an example of a FastAPI inference service. You can find the complete code at [Github Repository](https://github.com/truefoundry/getting-started-examples/tree/main/deploy-model-with-fastapi)
```python app.py lines theme={"dark"}
import os
import joblib
import pandas as pd
from fastapi import FastAPI
# Loading the model from local
model = joblib.load("iris_classifier.joblib")
app = FastAPI(docs_url="/", root_path=os.getenv("TFY_SERVICE_ROOT_PATH", "/"))
@app.post("/predict")
def predict(
sepal_length: float, sepal_width: float, petal_length: float, petal_width: float
):
data = dict(
sepal_length=sepal_length,
sepal_width=sepal_width,
petal_length=petal_length,
petal_width=petal_width,
)
prediction = int(model.predict(pd.DataFrame([data]))[0])
return {"prediction": prediction}
```
This is a simple inference service exposing an `/predict` endpoint. Now, we would like to track how many times this API has been called and how much time it took for each of these predictions, in other words, what is the latency of this API?
Let us start by installing the Python library for Prometheus
```shell Shell lines theme={"dark"}
pip install prometheus-client
```
Update the code to log metrics
```python app.py highlight={6,11-12,14-15,24-27,38} lines theme={"dark"}
import os
import joblib
import pandas as pd
from fastapi import FastAPI
from prometheus_client import Counter, Histogram, make_asgi_app
# Loading the model from local
model = joblib.load("iris_classifier.joblib")
# Define a Histogram metric to track latency of request as percentile.
REQUEST_TIME = Histogram("request_latency_seconds", "Time spent processing request")
# Define a Counter metric to track number of requests.
REQUEST_COUNT = Counter("request_count", "Number of inference request")
app = FastAPI(docs_url="/", root_path=os.getenv("TFY_SERVICE_ROOT_PATH", "/"))
@app.post("/predict")
def predict(
sepal_length: float, sepal_width: float, petal_length: float, petal_width: float
):
# Increase the request count by 1
REQUEST_COUNT.inc()
# Time the predict function, and observe the duration in seconds.
with REQUEST_TIME.time():
data = dict(
sepal_length=sepal_length,
sepal_width=sepal_width,
petal_length=petal_length,
petal_width=petal_width,
)
prediction = int(model.predict(pd.DataFrame([data]))[0])
return {"prediction": prediction}
app.mount("/metrics", make_asgi_app())
```
Run the FastAPI server with the following command `uvicorn app:app --port 8000 --host 0.0.0.0`
Now, you can check the exposed metrics at `http://localhost:8000/metrics`
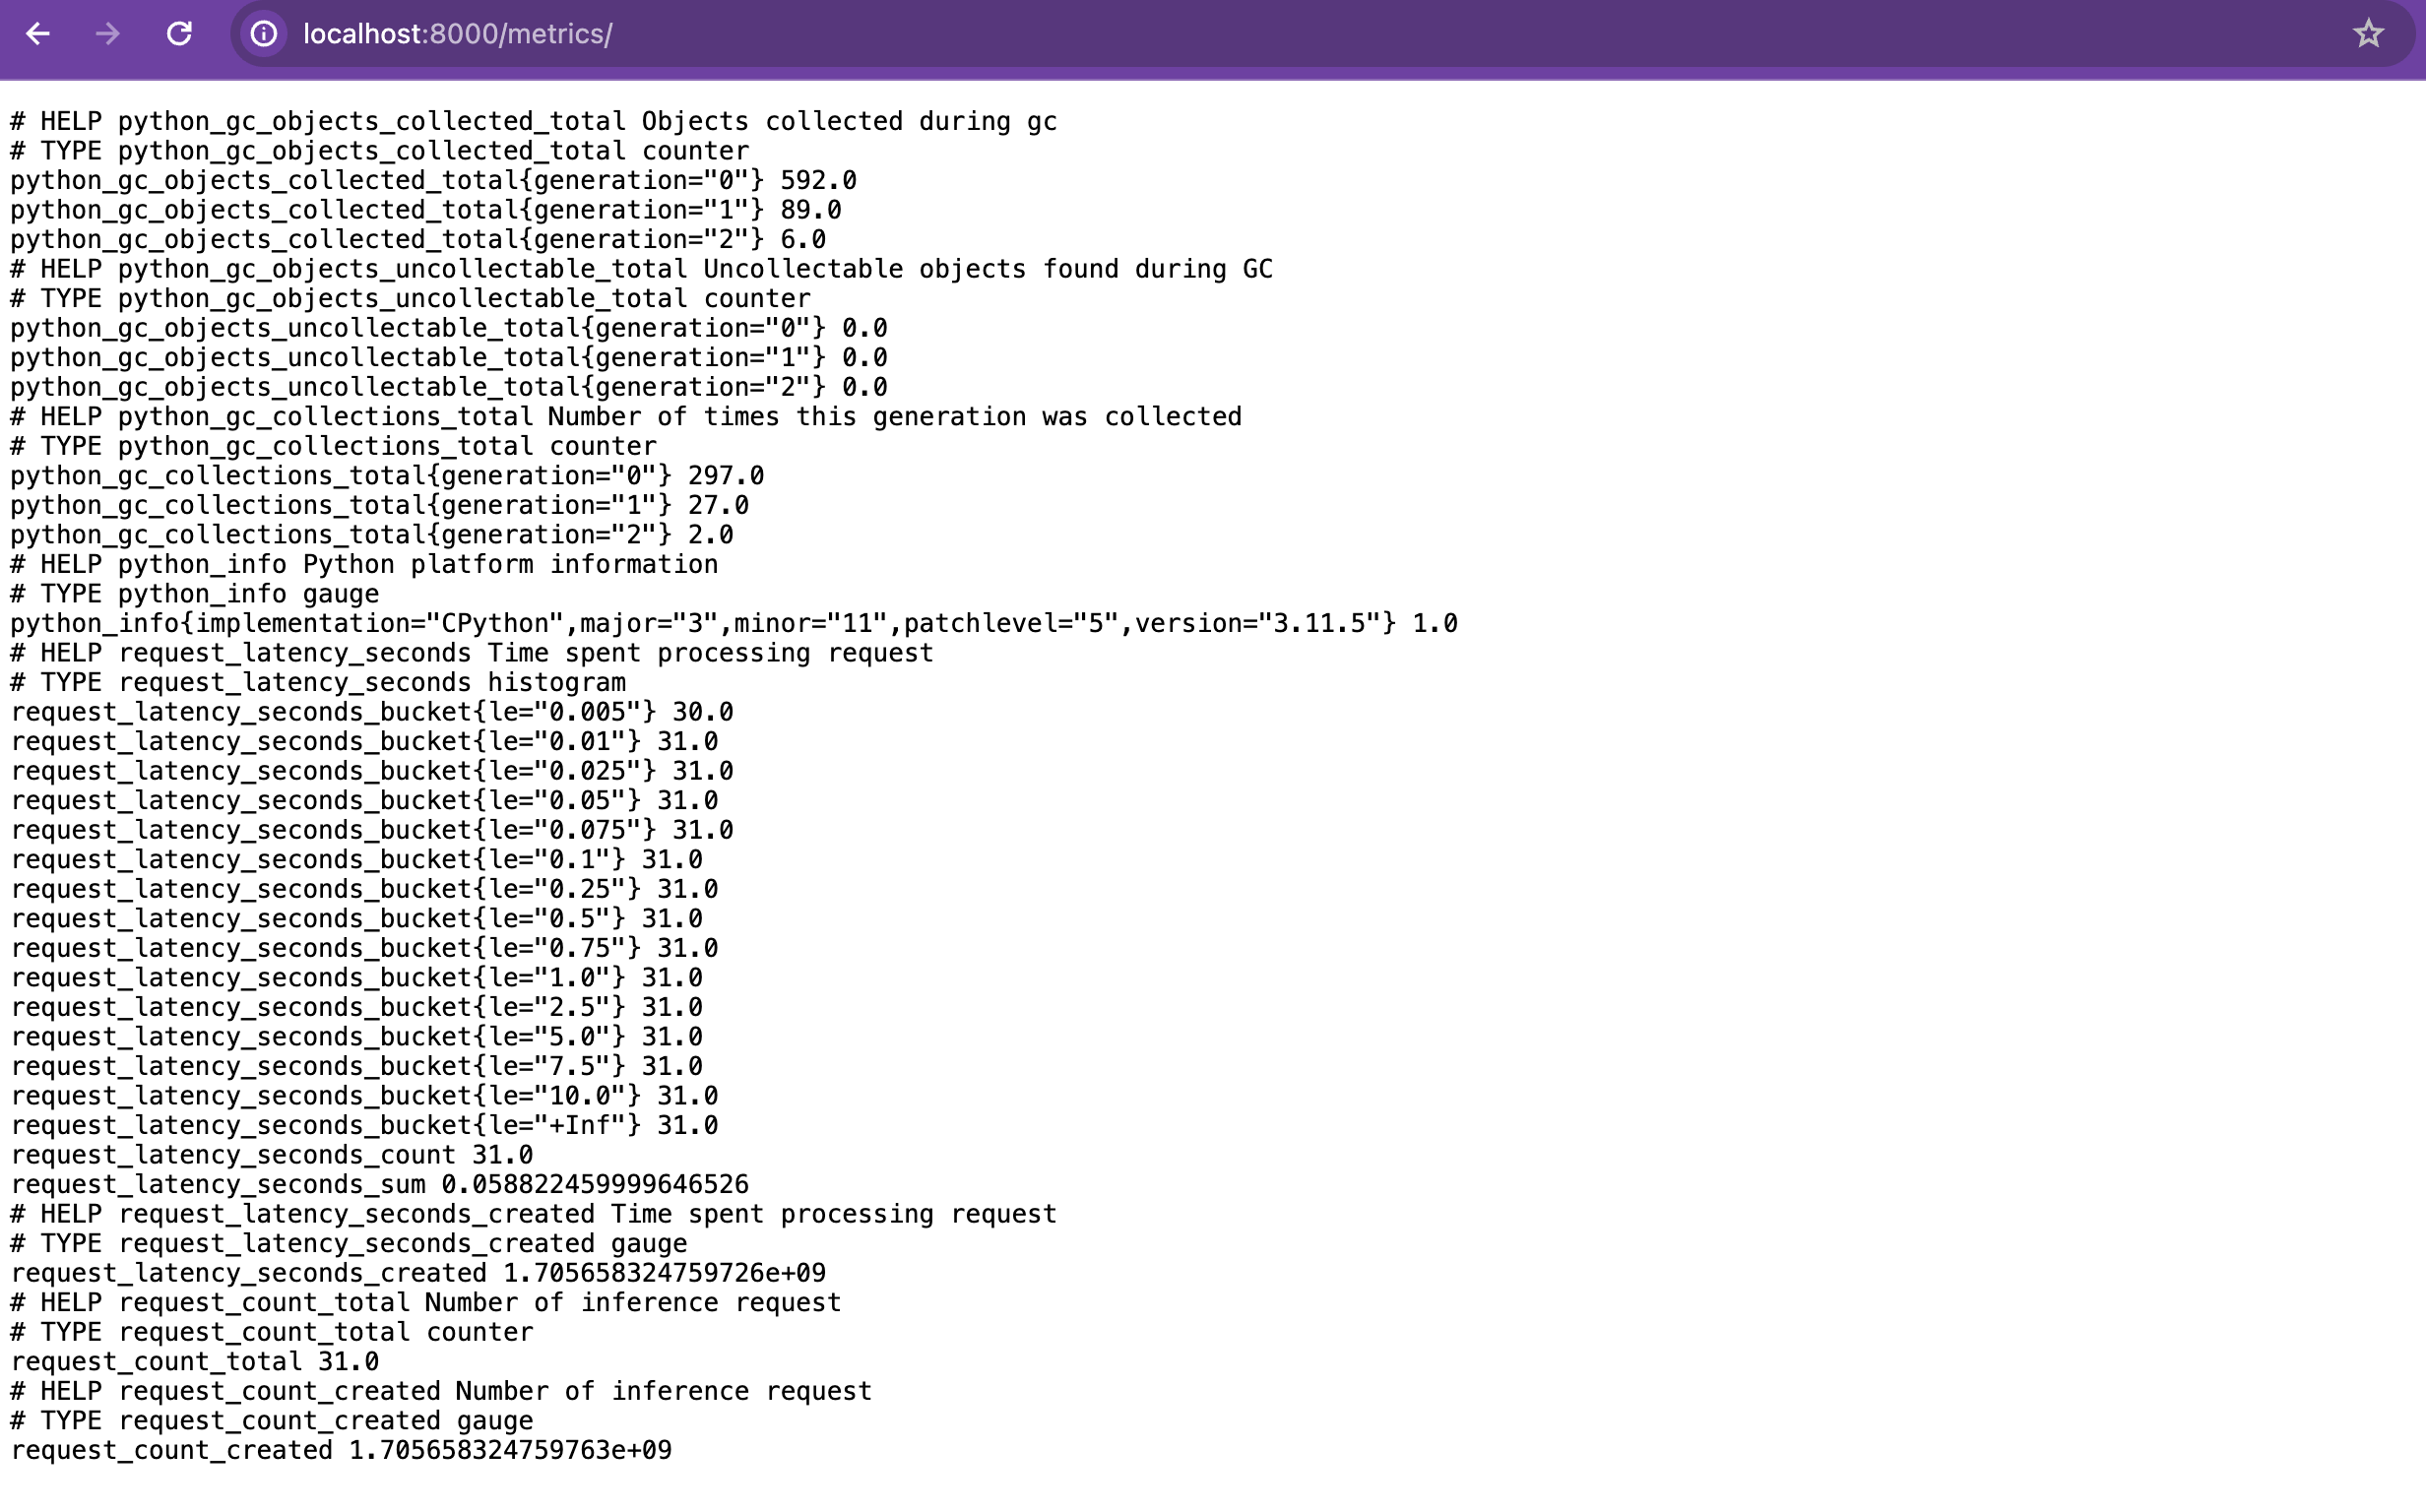 Congratulations! You have logged the metrics successfully. Now, go ahead and deploy this service.
To learn more about different kinds of metrics details, please refer to [prometheus-client documentation](https://prometheus.github.io/client_python).
## Monitor exposed metrics
Add the following `kustomize` patch to your service while deploying. This will add necessary annotations to your service Pods for Prometheus to scrape metrics. Please fill the placeholders with the correct `service-name` and `service-port-number`.
```python deploy.py lines theme={"dark"}
service = Service(
...
kustomize=Kustomize(
patch={
"patchesStrategicMerge": [
"""\
kind: Deployment
apiVersion: apps/v1
metadata:
name:
spec:
template:
metadata:
annotations:
prometheus.io/port: ""
prometheus.io/scrape: "true"
"""
]
}
),
...
)
```
```bash servicefoundry.yaml lines theme={"dark"}
kustomize:
patch:
patchesStrategicMerge:
- |
kind: Deployment
apiVersion: apps/v1
metadata:
name:
spec:
template:
metadata:
annotations:
prometheus.io/port: ""
prometheus.io/scrape: "true"
```
Congratulations! You have logged the metrics successfully. Now, go ahead and deploy this service.
To learn more about different kinds of metrics details, please refer to [prometheus-client documentation](https://prometheus.github.io/client_python).
## Monitor exposed metrics
Add the following `kustomize` patch to your service while deploying. This will add necessary annotations to your service Pods for Prometheus to scrape metrics. Please fill the placeholders with the correct `service-name` and `service-port-number`.
```python deploy.py lines theme={"dark"}
service = Service(
...
kustomize=Kustomize(
patch={
"patchesStrategicMerge": [
"""\
kind: Deployment
apiVersion: apps/v1
metadata:
name:
spec:
template:
metadata:
annotations:
prometheus.io/port: ""
prometheus.io/scrape: "true"
"""
]
}
),
...
)
```
```bash servicefoundry.yaml lines theme={"dark"}
kustomize:
patch:
patchesStrategicMerge:
- |
kind: Deployment
apiVersion: apps/v1
metadata:
name:
spec:
template:
metadata:
annotations:
prometheus.io/port: ""
prometheus.io/scrape: "true"
```
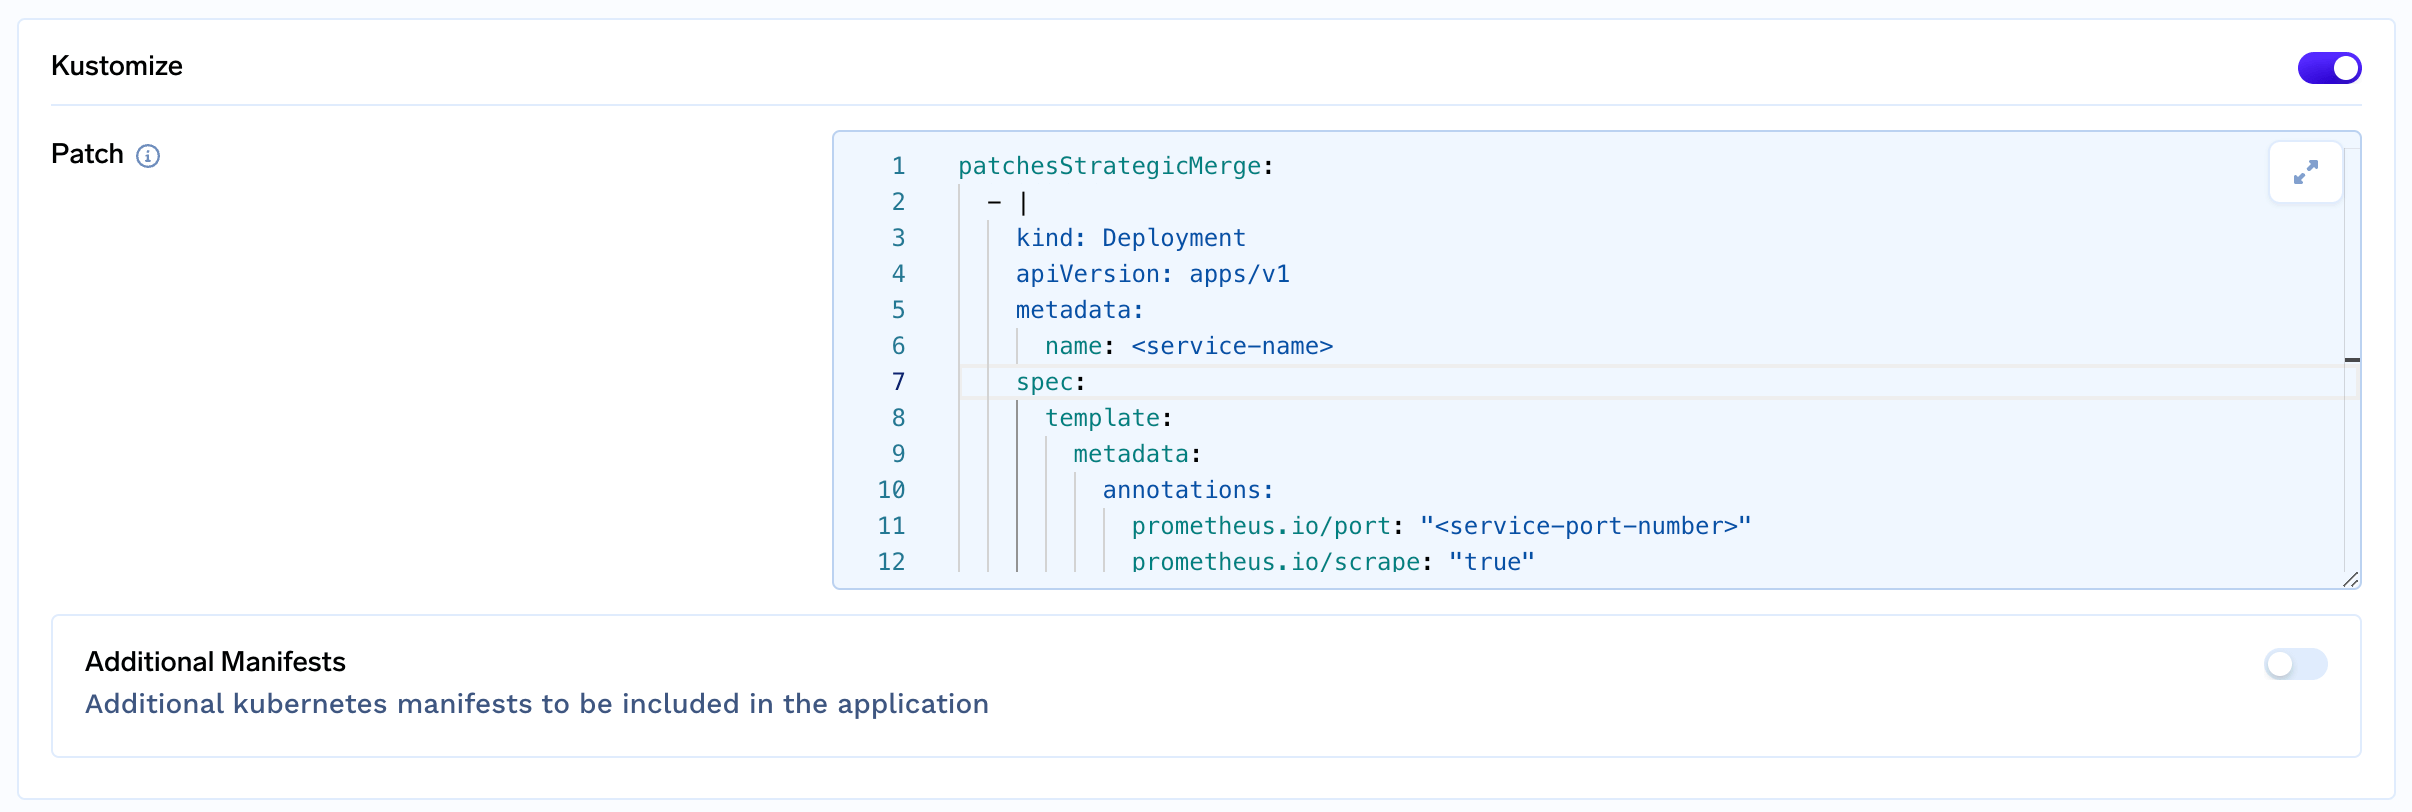 You can now export the application Grafana dashboard if not done already.
Note: Please ensure that `Prometheus` and `Grafana` is installed in your cluster.
* Open your Grafana dashboard for the service.
* Now, to monitor your custom metrics add a new Visualization in your service dashboard.
* For counter metric, use the query `request_count_total{container=~"iris-inference",namespace=~"demo-ws"}` where `container` is service\_name and `namespace` is workspace\_name.
* For histogram metric, use multiple `Query` section with different percentile like `round(histogram_quantile(0.99, sum(rate(request_latency_seconds_bucket{namespace=~"demo-ws", container=~"iris-inference"}[$__rate_interval])) by (le)), 0.001)` represents `p99`, similarly `round(histogram_quantile(0.90, sum(rate(request_latency_seconds_bucket{namespace=~"demo-ws", container=~"iris-inference"}[$__rate_interval])) by (le)), 0.001)` represents `p90` where `container` is service\_name and `namespace` is workspace\_name
* Save the changes and you are ready with your dashboard.
***
You can now export the application Grafana dashboard if not done already.
Note: Please ensure that `Prometheus` and `Grafana` is installed in your cluster.
* Open your Grafana dashboard for the service.
* Now, to monitor your custom metrics add a new Visualization in your service dashboard.
* For counter metric, use the query `request_count_total{container=~"iris-inference",namespace=~"demo-ws"}` where `container` is service\_name and `namespace` is workspace\_name.
* For histogram metric, use multiple `Query` section with different percentile like `round(histogram_quantile(0.99, sum(rate(request_latency_seconds_bucket{namespace=~"demo-ws", container=~"iris-inference"}[$__rate_interval])) by (le)), 0.001)` represents `p99`, similarly `round(histogram_quantile(0.90, sum(rate(request_latency_seconds_bucket{namespace=~"demo-ws", container=~"iris-inference"}[$__rate_interval])) by (le)), 0.001)` represents `p90` where `container` is service\_name and `namespace` is workspace\_name
* Save the changes and you are ready with your dashboard.
***