> ## Documentation Index
> Fetch the complete documentation index at: https://www.truefoundry.com/llms.txt
> Use this file to discover all available pages before exploring further.
# Export OpenTelemetry Data
> Learn how to export OpenTelemetry traces and metrics with TrueFoundry AI Gateway for comprehensive observability.
AI Gateway is **OpenTelemetry (OTEL) compliant**, making it easy to integrate with modern observability tools and platforms. **Tracing** and **metrics** can each be exported from the TrueFoundry dashboard to external OTEL backends. For Prometheus scraping of `/metrics`, labels, and the full metric catalog on self-hosted gateways, see [Prometheus & Grafana integration](/docs/ai-gateway/prometheus-grafana-integration).
***
We have built integrations with many observability partners — see the full list [here](/docs/ai-gateway/ecosystem#observability).
***
## Tracing
The **OTEL Traces Exporter** sends only trace data to your OTEL platform, not metrics. For OpenTelemetry metrics export, see [Metrics](#metrics) below.
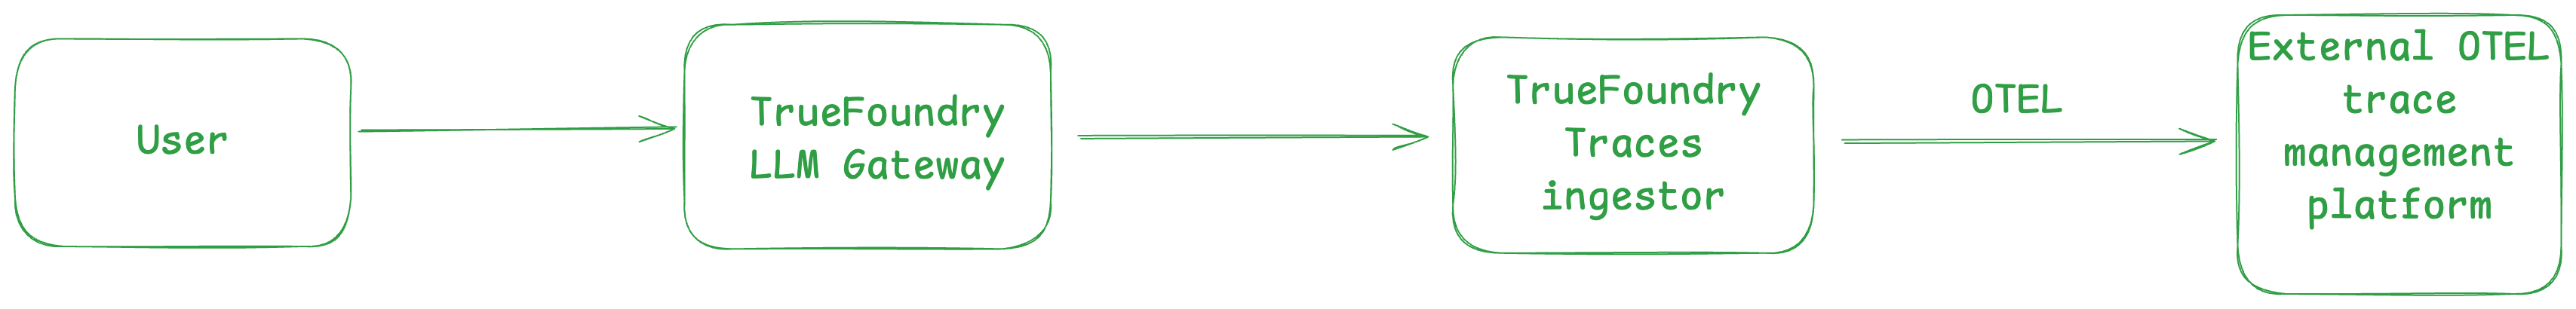
OpenTelemetry tracing allows you to capture detailed traces of requests as they flow through the AI Gateway. This enables debugging, performance analysis, and end-to-end visibility. Traces storage is managed by TrueFoundry.
Optionally, traces can also be configured to be exported to any existing OTEL compatible observability platform. This will not affect the storage of traces managed by TrueFoundry.
 ### Export Traces to OTEL Compatible Observability Platforms
To export spans to your existing OTEL Platform:
### Export Traces to OTEL Compatible Observability Platforms
To export spans to your existing OTEL Platform:
 1. Go to **AI Gateway** → **Controls** → **Settings** in the TrueFoundry dashboard
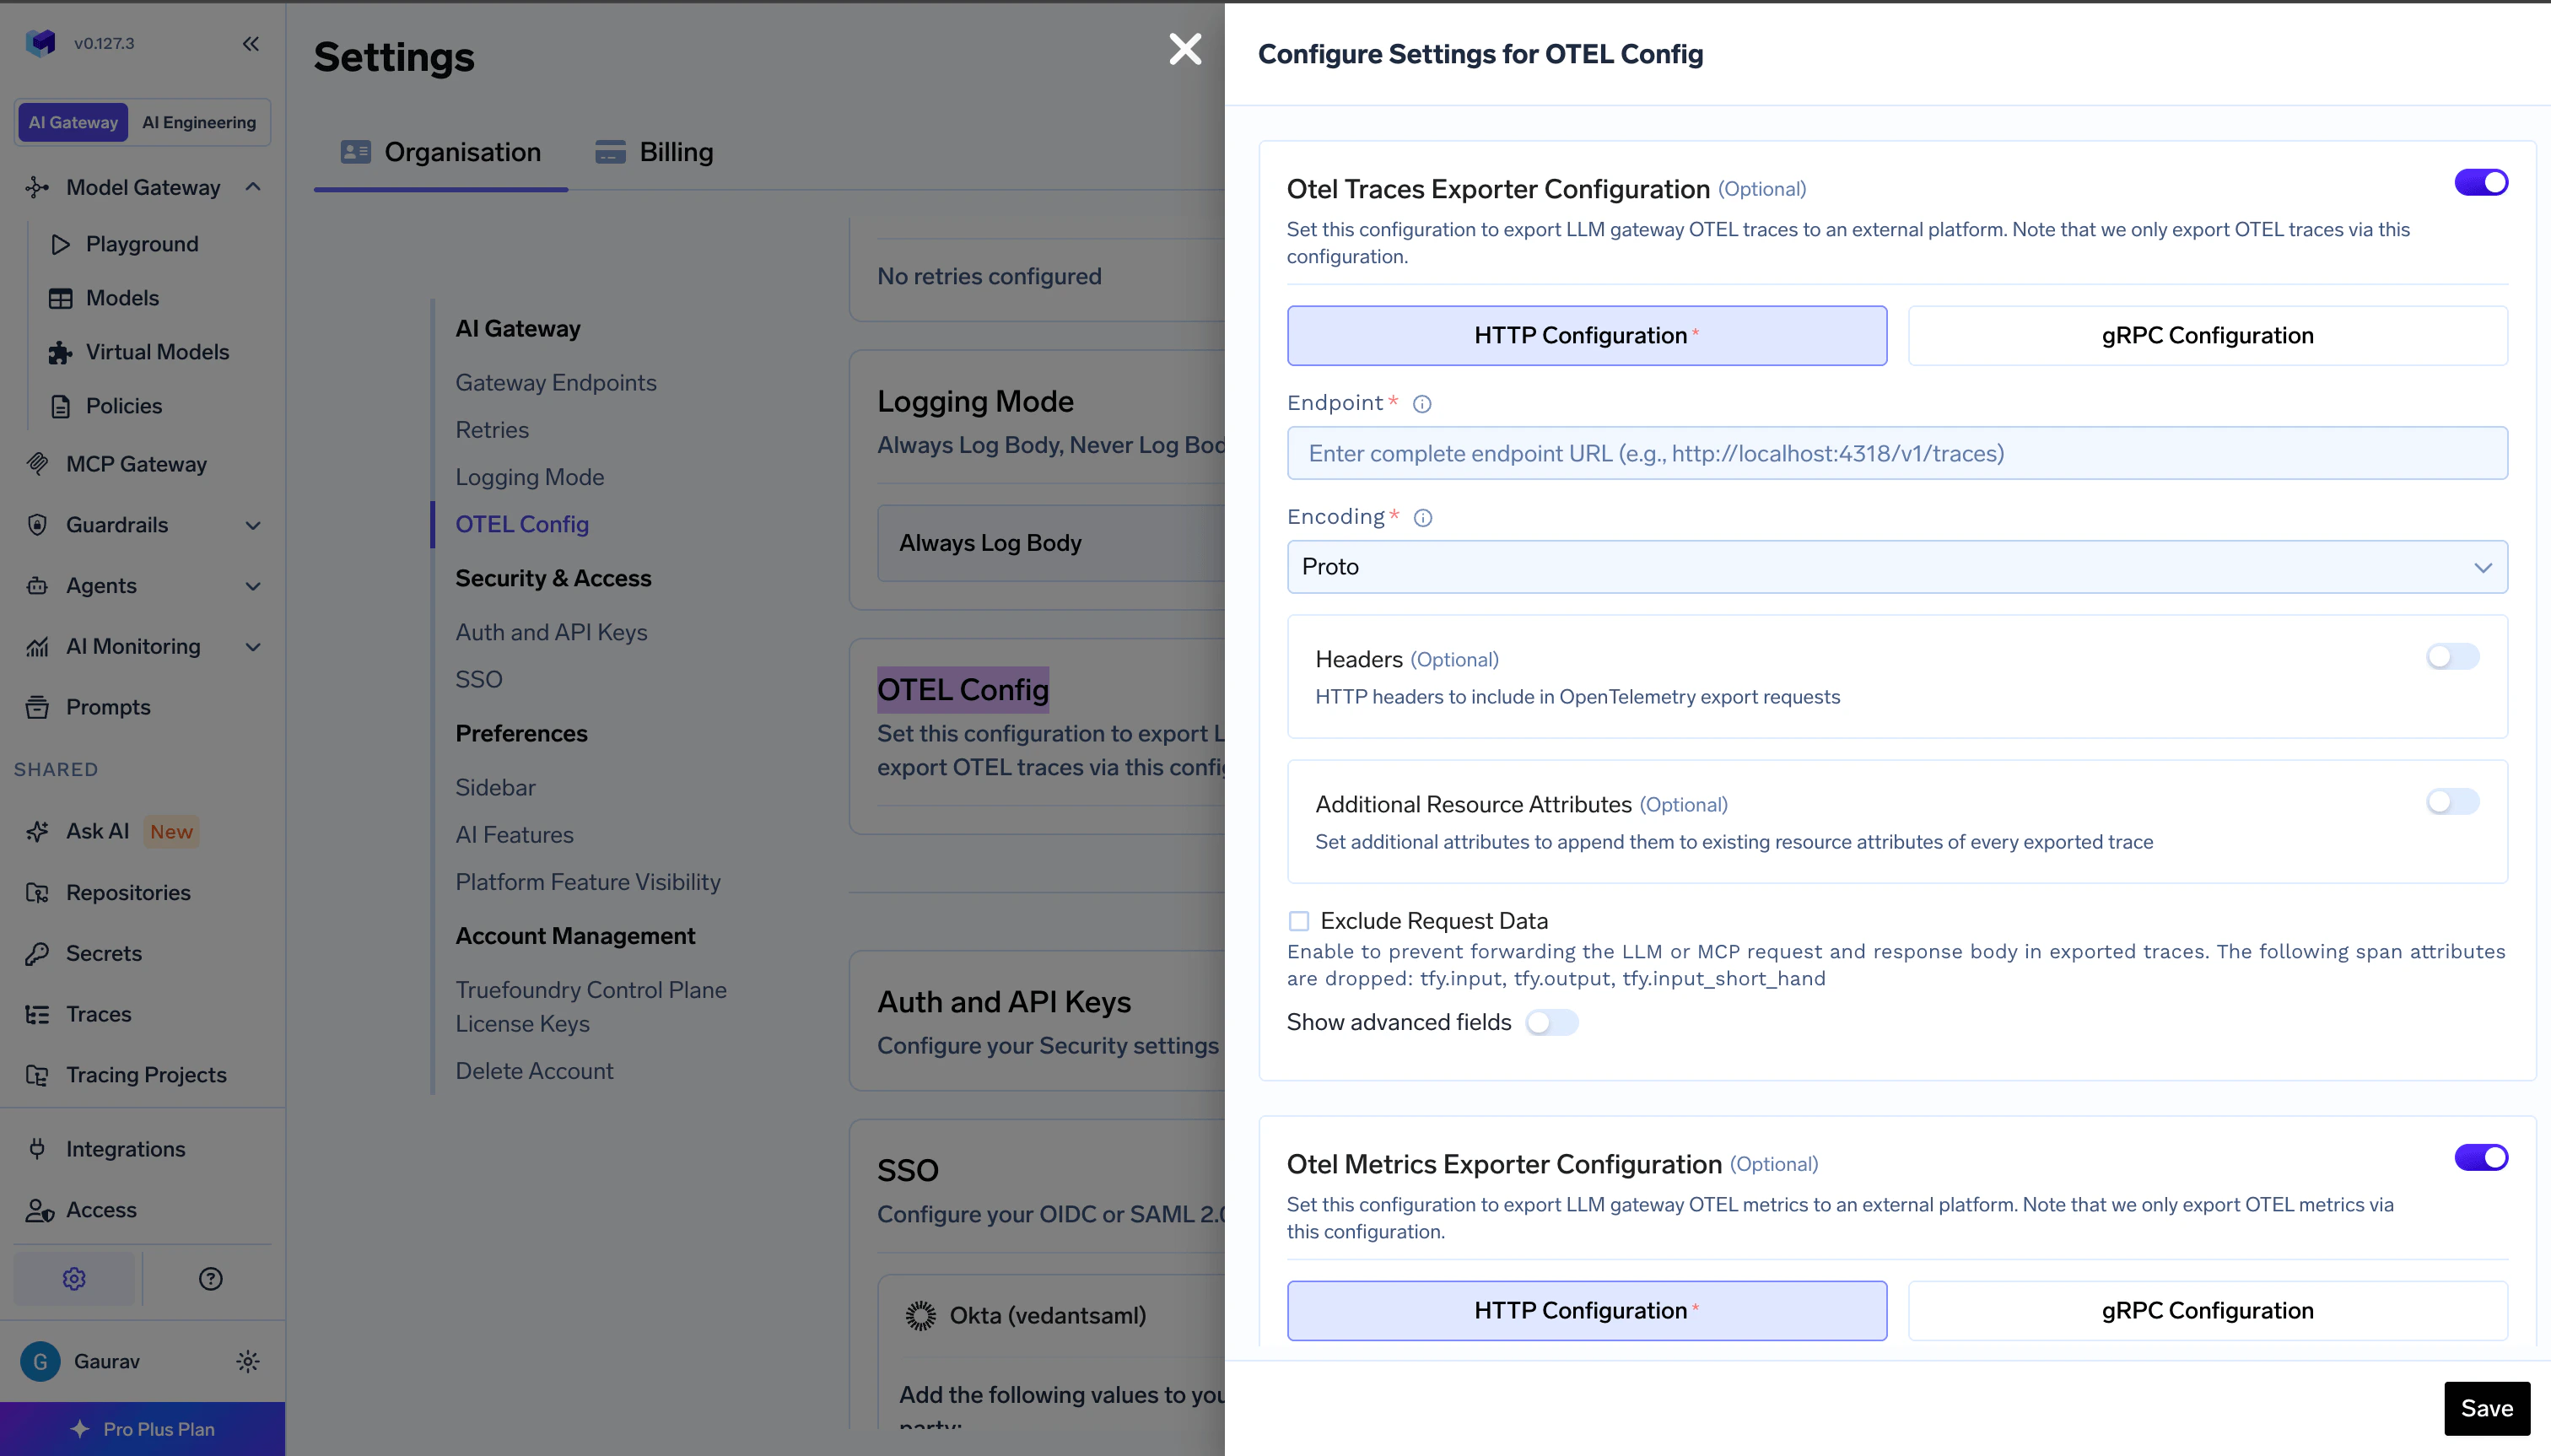
2. Scroll down to the **OTEL Config** section and click the edit button
3. Enable the **OTEL Traces Exporter Configuration** toggle
4. Select either **HTTP Configuration** or **gRPC Configuration** based on your OTEL platform's endpoint
5. Enter the complete traces endpoint for eg., the traces endpoint for Grafana Cloud is `https://otlp-gateway-prod-ap-south-1.grafana.net/otlp/v1/traces`
6. Select the encoding (only for HTTP Configuration) as either `proto` or `json`
7. Optionally, enter the headers required to export spans to the OTEL provider for eg., authorization, region, etc..
For gRPC endpoints, always include the scheme. Use `http://` for plaintext (e.g., `http://otel-collector:4317`). If omitted, TLS is used by default.
***
## Metrics
The **OTEL Metrics Exporter** sends only metrics to your OTEL platform, not traces. For OpenTelemetry traces export, see [Tracing](#tracing) above.
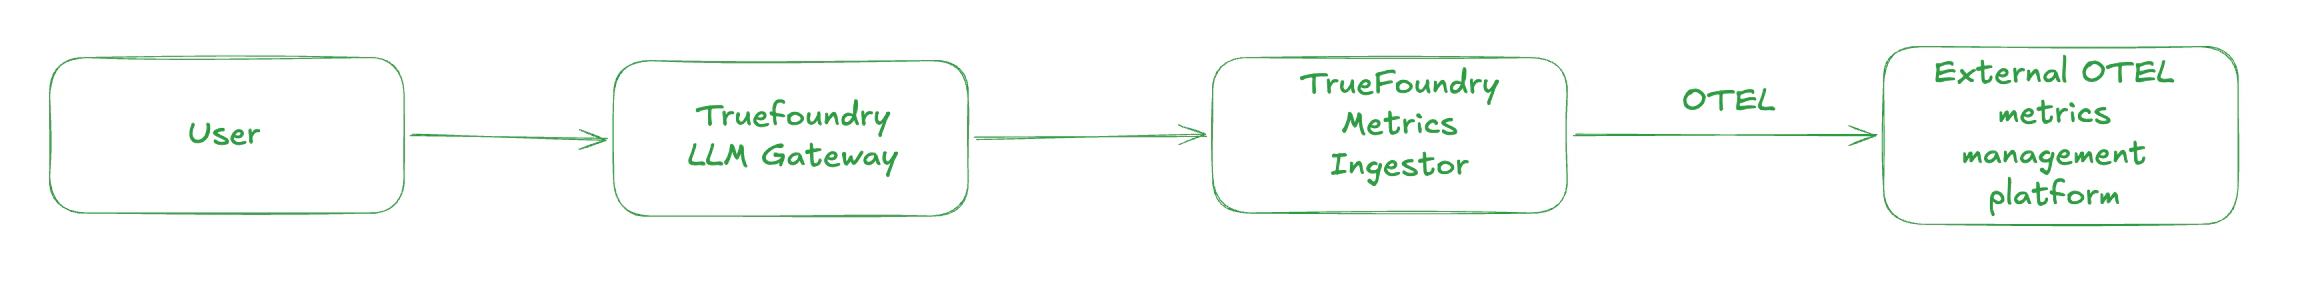
OpenTelemetry metrics export lets you send gateway metrics to an OTLP-compatible observability platform. Configure this in the same **OTEL Config** editor as traces; it does not replace metrics stored and shown inside TrueFoundry.
1. Go to **AI Gateway** → **Controls** → **Settings** in the TrueFoundry dashboard
2. Scroll down to the **OTEL Config** section and click the edit button
3. Enable the **OTEL Traces Exporter Configuration** toggle
4. Select either **HTTP Configuration** or **gRPC Configuration** based on your OTEL platform's endpoint
5. Enter the complete traces endpoint for eg., the traces endpoint for Grafana Cloud is `https://otlp-gateway-prod-ap-south-1.grafana.net/otlp/v1/traces`
6. Select the encoding (only for HTTP Configuration) as either `proto` or `json`
7. Optionally, enter the headers required to export spans to the OTEL provider for eg., authorization, region, etc..
For gRPC endpoints, always include the scheme. Use `http://` for plaintext (e.g., `http://otel-collector:4317`). If omitted, TLS is used by default.
***
## Metrics
The **OTEL Metrics Exporter** sends only metrics to your OTEL platform, not traces. For OpenTelemetry traces export, see [Tracing](#tracing) above.
OpenTelemetry metrics export lets you send gateway metrics to an OTLP-compatible observability platform. Configure this in the same **OTEL Config** editor as traces; it does not replace metrics stored and shown inside TrueFoundry.
 ### Export Metrics to OTEL Compatible Observability Platforms
To export metrics to your existing OTEL platform:
### Export Metrics to OTEL Compatible Observability Platforms
To export metrics to your existing OTEL platform:
 1. Go to **AI Gateway** → **Controls** → **Settings** in the TrueFoundry dashboard
2. Scroll down to the **OTEL Config** section and click the edit button
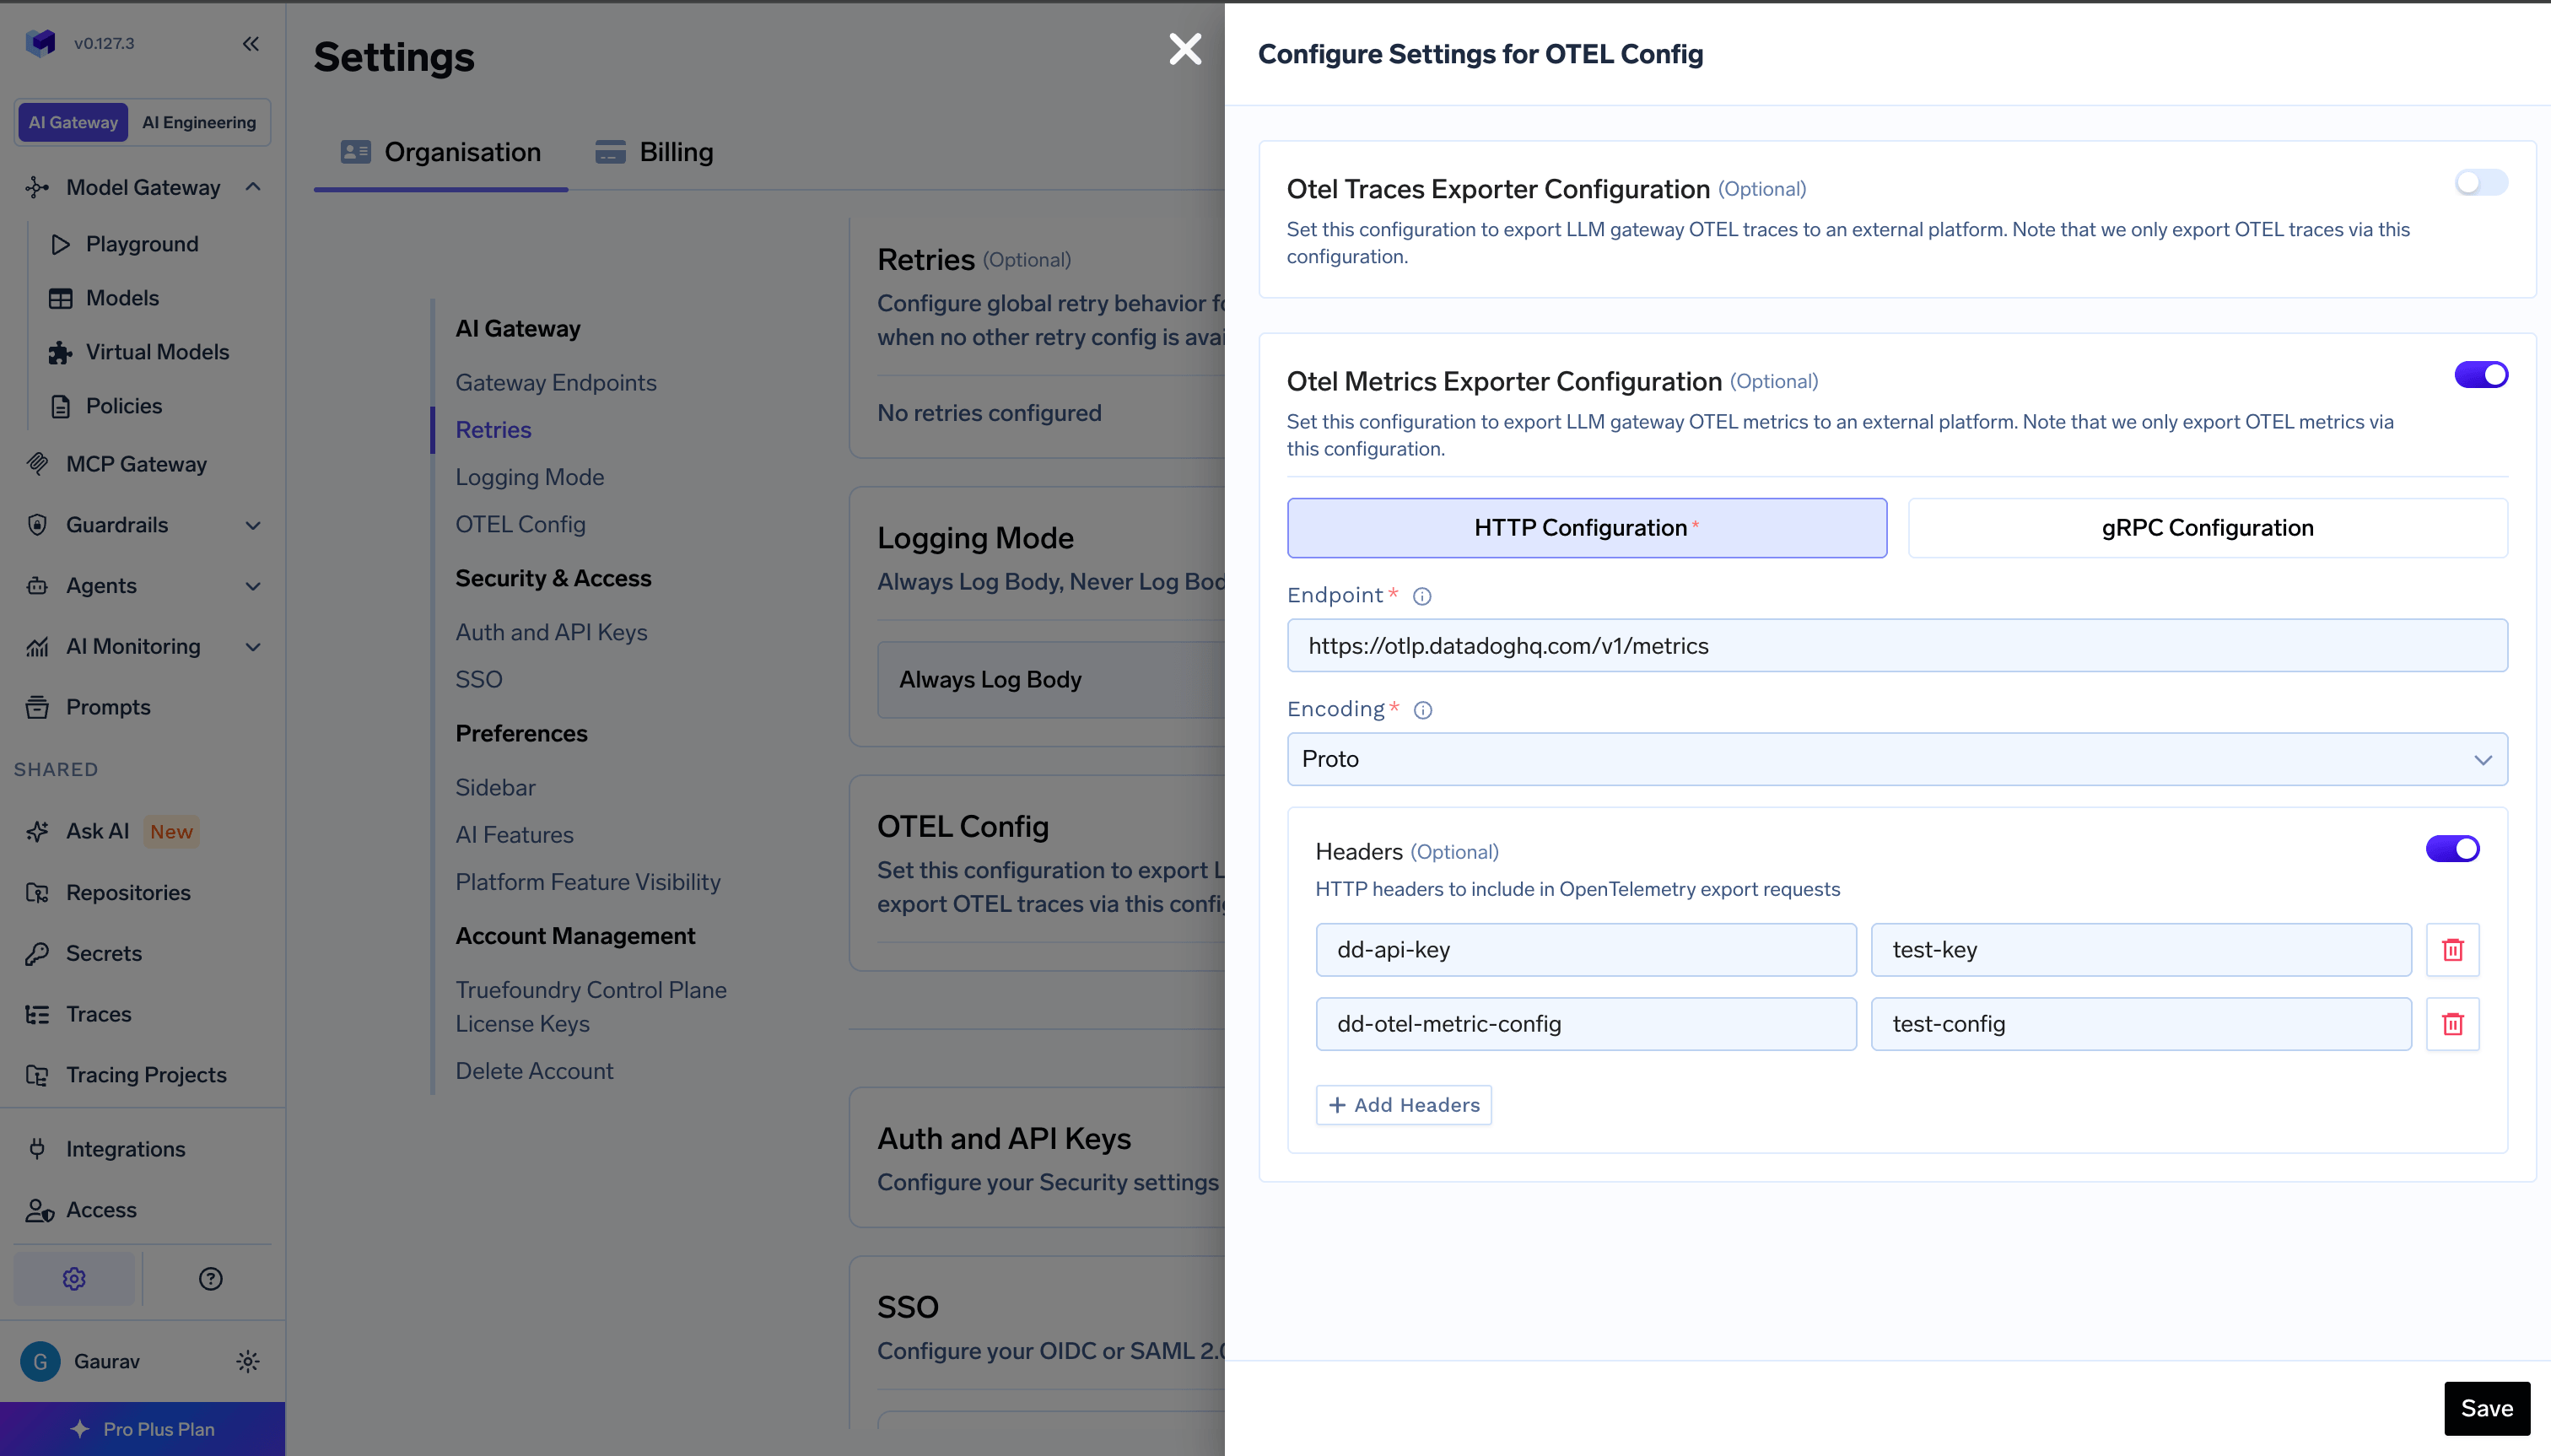
3. Enable the **OTEL Metrics Exporter Configuration** toggle
4. Select either **HTTP Configuration** or **gRPC Configuration** based on your OTEL platform’s metrics endpoint
5. Enter the complete **metrics** endpoint—for example, Datadog uses `https://otlp.datadoghq.com/v1/metrics`
6. Select the encoding (only for HTTP Configuration) as either `proto` or `json`
7. Optionally, enter the headers required to export metrics to the OTEL provider—for example, API keys or vendor-specific headers
8. Click **Save**
For gRPC endpoints, always include the scheme. Use `http://` for plaintext (e.g., `http://otel-collector:4317`). If omitted, TLS is used by default.
#### Example 1: Exporting Metrics to Datadog
Datadog supports OTLP metrics ingest natively. Use the following configuration:
**Step 1 — Set the environment variable on your `tfy-llm-gateway` deployment**
Datadog's OTLP ingest endpoint only accepts **delta-encoded metrics**. Set this environment variable in your `tfy-llm-gateway` deployment before configuring the exporter:
```
OTEL_EXPORTER_OTLP_METRICS_TEMPORALITY_PREFERENCE=Delta
```
**Step 2 — Configure the OTEL Metrics Exporter in TrueFoundry**
In the **OTEL Config** editor, enable **OTEL Metrics Exporter Configuration** and set:
| Field | Value |
| ---------------- | --------------------------------------- |
| Protocol | HTTP Configuration |
| Metrics Endpoint | `https://otlp.datadoghq.com/v1/metrics` |
| Encoding | `proto` |
Add the following headers:
| Header | Value |
| ----------------------- | ----------------------------------------- |
| `dd-api-key` | `` |
| `dd-otel-metric-config` | `{"histograms":{"mode":"distributions"}}` |
The `dd-otel-metric-config` header enables the **histogram translator**, which converts OTLP histogram metrics into Datadog distribution metrics. This is required to query percentile aggregations such as `p50:ai_gateway_request_processing_ms{*}`, `p95:ai_gateway_request_processing_ms{*}`, and similar metrics in the Datadog Metrics Explorer.
For sites other than US1, use the region-specific endpoint—for example, `https://otlp.datadoghq.eu/v1/metrics` for the EU site. See the [Datadog OTLP metrics ingest documentation](https://docs.datadoghq.com/opentelemetry/setup/otlp_ingest/metrics/?tab=javascript) for the full list of endpoints and additional `dd-otel-metric-config` options.
#### Example 2: Exporting Metrics to AWS Cloudwatch
AWS Cloudwatch supports OTLP metrics ingest. Use the following configuration:
**Step 1 - Set the environment variable on your `tfy-llm-gateway` deployment**
Cloudwatch's OTLP ingest endpoint only accepts **delta-encoded metrics**. Set this environment variable in your `tfy-llm-gateway` deployment before configuring the exporter:
```
OTEL_EXPORTER_OTLP_METRICS_TEMPORALITY_PREFERENCE=Delta
```
OTEL `Delta` metric temporality does not export **Gauges** and **UpDownCounters**. For example, `ai_gateway_budget_usage` is a Gauge and might not be sent with `Delta` temporality.
***
For scraping `/metrics` with Prometheus, OTLP endpoint patterns, and a full list of metric names and labels, see [Prometheus & Grafana integration](/docs/ai-gateway/prometheus-grafana-integration).
1. Go to **AI Gateway** → **Controls** → **Settings** in the TrueFoundry dashboard
2. Scroll down to the **OTEL Config** section and click the edit button
3. Enable the **OTEL Metrics Exporter Configuration** toggle
4. Select either **HTTP Configuration** or **gRPC Configuration** based on your OTEL platform’s metrics endpoint
5. Enter the complete **metrics** endpoint—for example, Datadog uses `https://otlp.datadoghq.com/v1/metrics`
6. Select the encoding (only for HTTP Configuration) as either `proto` or `json`
7. Optionally, enter the headers required to export metrics to the OTEL provider—for example, API keys or vendor-specific headers
8. Click **Save**
For gRPC endpoints, always include the scheme. Use `http://` for plaintext (e.g., `http://otel-collector:4317`). If omitted, TLS is used by default.
#### Example 1: Exporting Metrics to Datadog
Datadog supports OTLP metrics ingest natively. Use the following configuration:
**Step 1 — Set the environment variable on your `tfy-llm-gateway` deployment**
Datadog's OTLP ingest endpoint only accepts **delta-encoded metrics**. Set this environment variable in your `tfy-llm-gateway` deployment before configuring the exporter:
```
OTEL_EXPORTER_OTLP_METRICS_TEMPORALITY_PREFERENCE=Delta
```
**Step 2 — Configure the OTEL Metrics Exporter in TrueFoundry**
In the **OTEL Config** editor, enable **OTEL Metrics Exporter Configuration** and set:
| Field | Value |
| ---------------- | --------------------------------------- |
| Protocol | HTTP Configuration |
| Metrics Endpoint | `https://otlp.datadoghq.com/v1/metrics` |
| Encoding | `proto` |
Add the following headers:
| Header | Value |
| ----------------------- | ----------------------------------------- |
| `dd-api-key` | `` |
| `dd-otel-metric-config` | `{"histograms":{"mode":"distributions"}}` |
The `dd-otel-metric-config` header enables the **histogram translator**, which converts OTLP histogram metrics into Datadog distribution metrics. This is required to query percentile aggregations such as `p50:ai_gateway_request_processing_ms{*}`, `p95:ai_gateway_request_processing_ms{*}`, and similar metrics in the Datadog Metrics Explorer.
For sites other than US1, use the region-specific endpoint—for example, `https://otlp.datadoghq.eu/v1/metrics` for the EU site. See the [Datadog OTLP metrics ingest documentation](https://docs.datadoghq.com/opentelemetry/setup/otlp_ingest/metrics/?tab=javascript) for the full list of endpoints and additional `dd-otel-metric-config` options.
#### Example 2: Exporting Metrics to AWS Cloudwatch
AWS Cloudwatch supports OTLP metrics ingest. Use the following configuration:
**Step 1 - Set the environment variable on your `tfy-llm-gateway` deployment**
Cloudwatch's OTLP ingest endpoint only accepts **delta-encoded metrics**. Set this environment variable in your `tfy-llm-gateway` deployment before configuring the exporter:
```
OTEL_EXPORTER_OTLP_METRICS_TEMPORALITY_PREFERENCE=Delta
```
OTEL `Delta` metric temporality does not export **Gauges** and **UpDownCounters**. For example, `ai_gateway_budget_usage` is a Gauge and might not be sent with `Delta` temporality.
***
For scraping `/metrics` with Prometheus, OTLP endpoint patterns, and a full list of metric names and labels, see [Prometheus & Grafana integration](/docs/ai-gateway/prometheus-grafana-integration).