> ## Documentation Index
> Fetch the complete documentation index at: https://www.truefoundry.com/llms.txt
> Use this file to discover all available pages before exploring further.
# Metrics Dashboard
> Monitor LLM and MCP performance, costs, guardrails, routing, and caching from a unified metrics dashboard
The Metrics Dashboard gives you a complete picture of your AI Gateway's health and efficiency. Pinpoint performance bottlenecks, track spending in real-time, and see exactly how your application is being used — all from a single, interactive interface.
The dashboard is organized into tabs, each providing a specific perspective on your data. Every tab supports **time-range selection**, **filters** (by model, user, virtual account, team, and more), and a **Refresh** button for live monitoring.
## Overview
The Overview tab is the landing page of the Metrics Dashboard. It provides a single-screen summary of gateway activity across both LLM and MCP traffic.
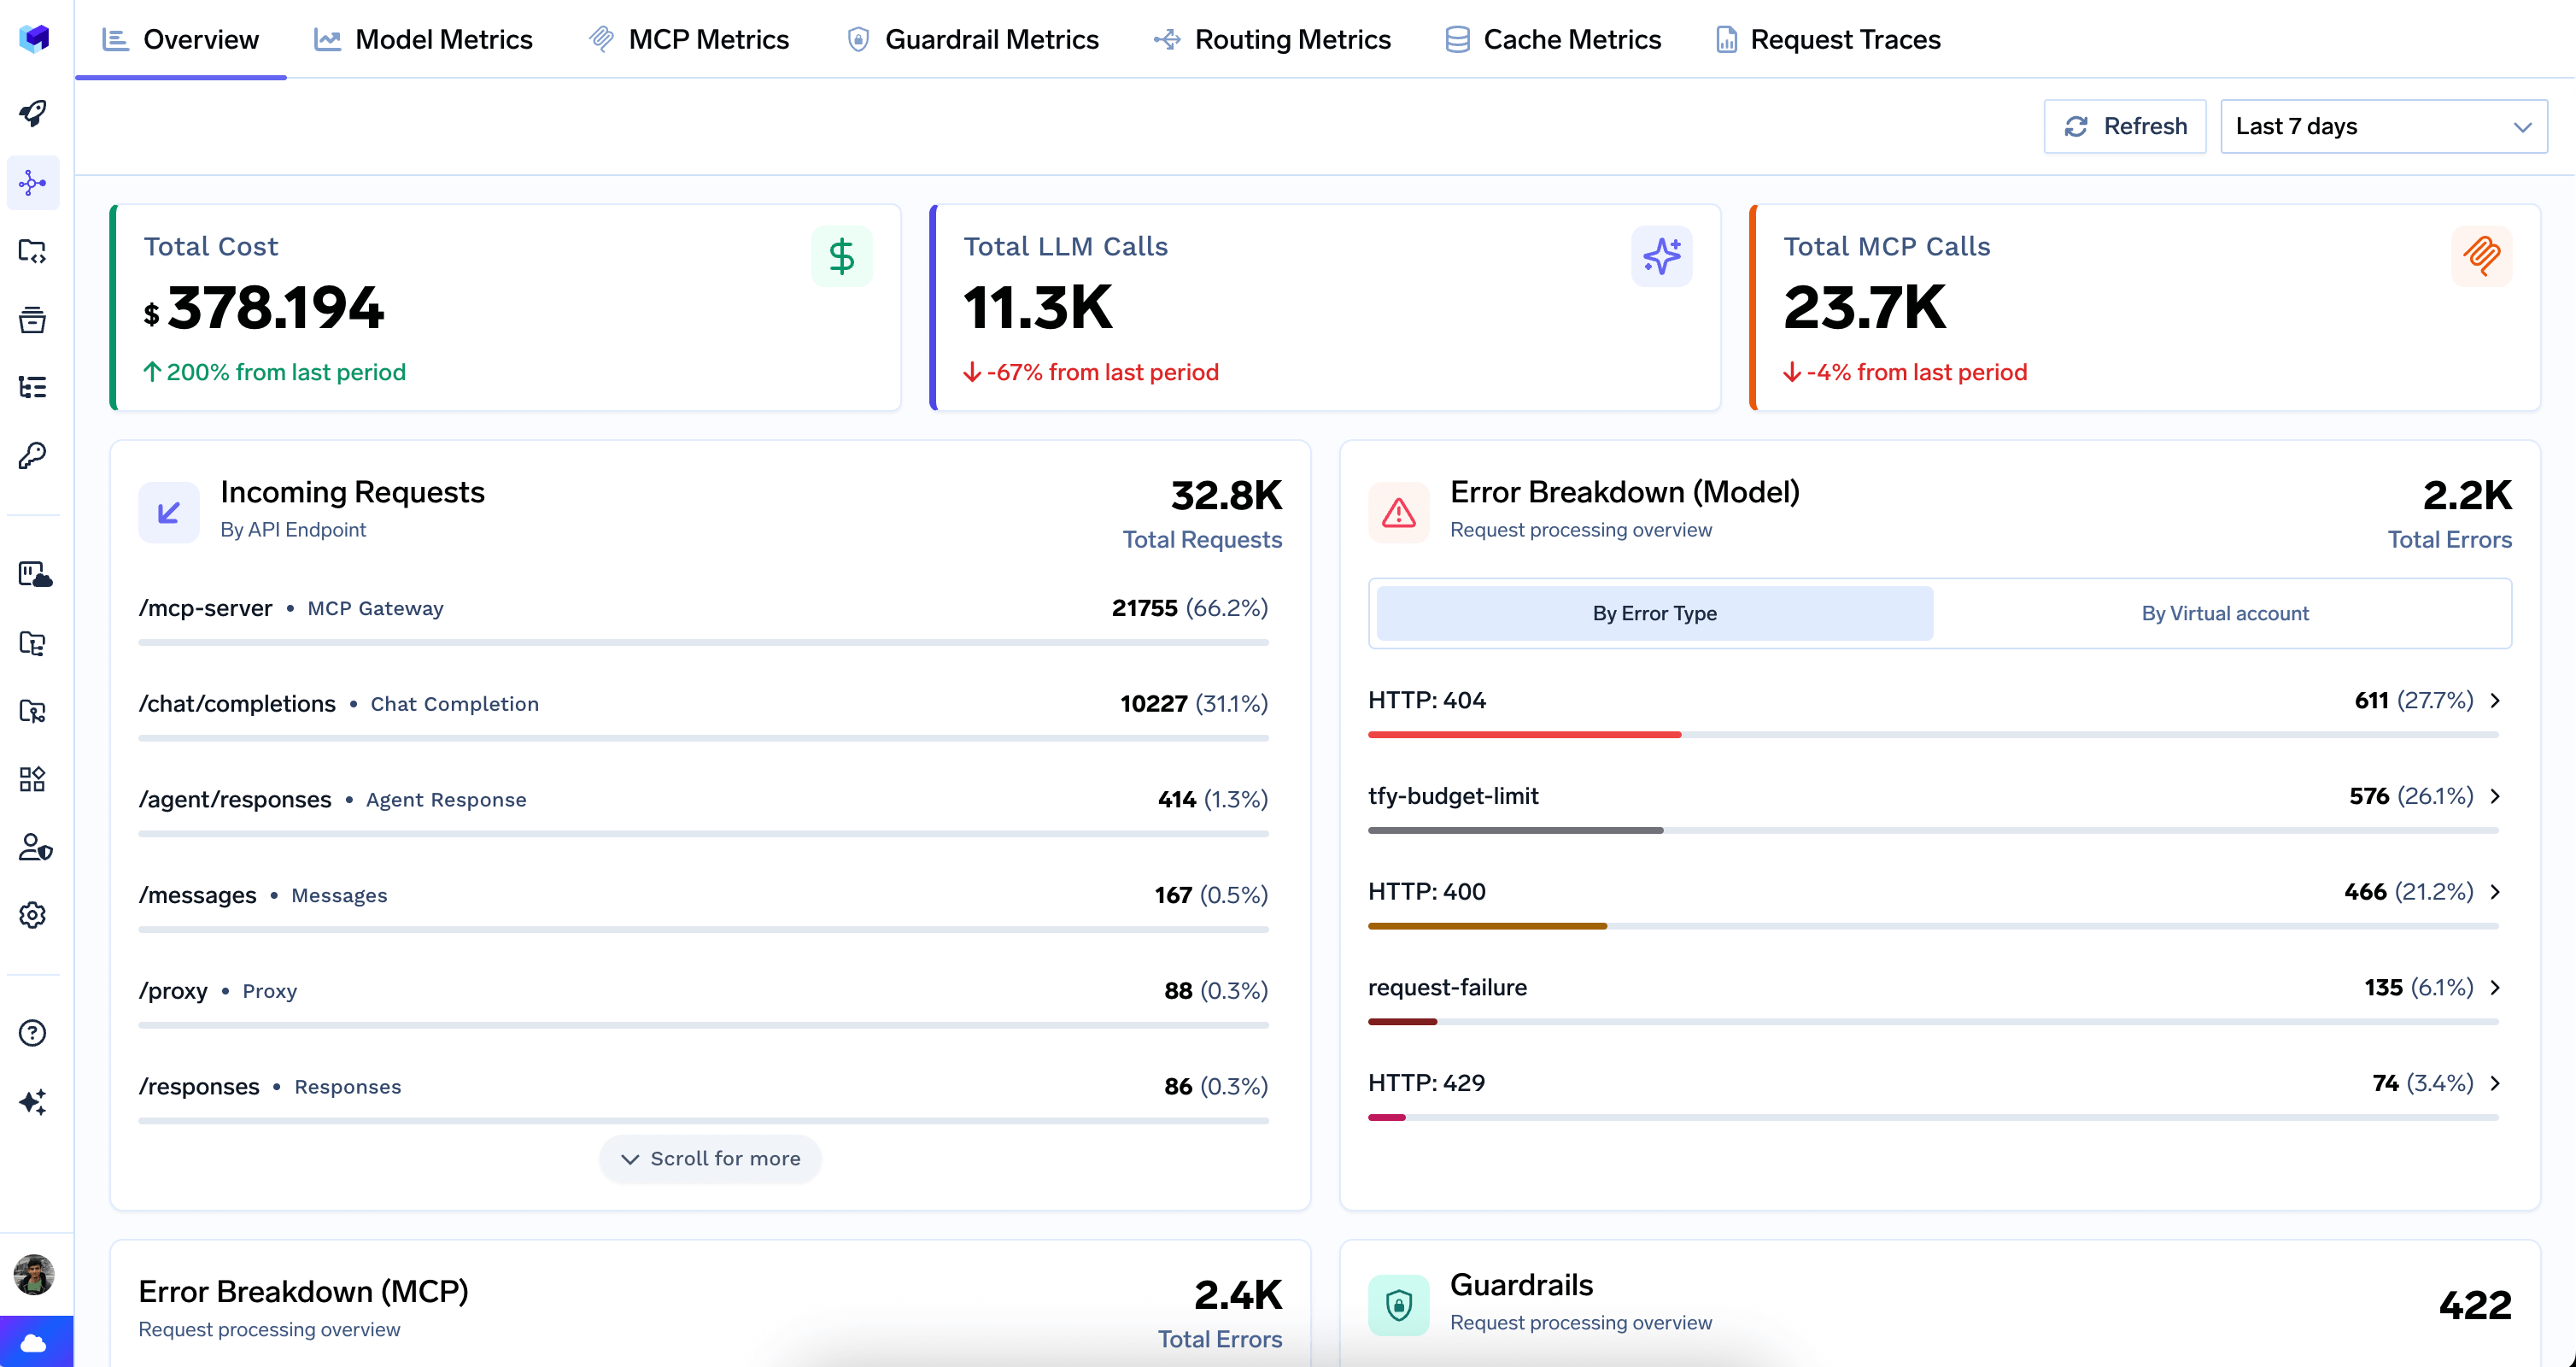 * **Total Cost** — aggregate spend across all models, with period-over-period comparison.
* **Total LLM Calls** — count of all LLM API requests, with period-over-period change.
* **Total MCP Calls** — count of all MCP requests, with period-over-period change.
Breaks down total request volume by API endpoint type. Each row shows the endpoint pattern, a friendly label, and its share of total traffic.
| Endpoint | Description |
| ------------------- | ------------------ |
| `/mcp-server` | MCP Gateway |
| `/chat/completions` | Chat Completion |
| `/agent/responses` | Agent Response |
| `/messages` | Anthropic Messages |
| `/proxy` | Proxy |
| `/responses` | OpenAI Responses |
| `/embeddings` | Embedding |
| `/completions` | Completion |
| `/v2/rerank` | Rerank |
**Error Breakdown (Model)** — Displays LLM provider errors grouped by HTTP status code or virtual account.
**Error Breakdown (MCP)** — Same structure for MCP traffic, helping identify reliability issues with specific MCP servers.
Shows the total number of guardrail evaluations and a ranked list of which guardrail groups are triggering most often, with a breakdown of outcomes (blocked, flagged, mutated).
Ranked leaderboards for quick identification of the biggest consumers and most active components:
| Leaderboard | What it shows |
| --------------------------------- | ------------------------------------------------------------- |
| **Top Models** | Most-used models by request count |
| **Top Model Providers** | Most-used providers (e.g. Google Vertex, OpenAI, AWS Bedrock) |
| **Top Users by Model** | Users making the most LLM requests |
| **Top Virtual Accounts by Model** | Virtual accounts with the most LLM traffic |
| **Top Users by MCP** | Users making the most MCP requests |
| **Top Virtual Accounts by MCP** | Virtual accounts with the most MCP traffic |
| **Top MCP Servers** | MCP servers receiving the most requests |
| **Top Tools** | Individual MCP tools called most frequently |
***
## Model Metrics
Deep visibility into LLM model performance, cost, and usage. Compare models, debug user issues, and track team spending.
* **Total Cost** — aggregate spend across all models, with period-over-period comparison.
* **Total LLM Calls** — count of all LLM API requests, with period-over-period change.
* **Total MCP Calls** — count of all MCP requests, with period-over-period change.
Breaks down total request volume by API endpoint type. Each row shows the endpoint pattern, a friendly label, and its share of total traffic.
| Endpoint | Description |
| ------------------- | ------------------ |
| `/mcp-server` | MCP Gateway |
| `/chat/completions` | Chat Completion |
| `/agent/responses` | Agent Response |
| `/messages` | Anthropic Messages |
| `/proxy` | Proxy |
| `/responses` | OpenAI Responses |
| `/embeddings` | Embedding |
| `/completions` | Completion |
| `/v2/rerank` | Rerank |
**Error Breakdown (Model)** — Displays LLM provider errors grouped by HTTP status code or virtual account.
**Error Breakdown (MCP)** — Same structure for MCP traffic, helping identify reliability issues with specific MCP servers.
Shows the total number of guardrail evaluations and a ranked list of which guardrail groups are triggering most often, with a breakdown of outcomes (blocked, flagged, mutated).
Ranked leaderboards for quick identification of the biggest consumers and most active components:
| Leaderboard | What it shows |
| --------------------------------- | ------------------------------------------------------------- |
| **Top Models** | Most-used models by request count |
| **Top Model Providers** | Most-used providers (e.g. Google Vertex, OpenAI, AWS Bedrock) |
| **Top Users by Model** | Users making the most LLM requests |
| **Top Virtual Accounts by Model** | Virtual accounts with the most LLM traffic |
| **Top Users by MCP** | Users making the most MCP requests |
| **Top Virtual Accounts by MCP** | Virtual accounts with the most MCP traffic |
| **Top MCP Servers** | MCP servers receiving the most requests |
| **Top Tools** | Individual MCP tools called most frequently |
***
## Model Metrics
Deep visibility into LLM model performance, cost, and usage. Compare models, debug user issues, and track team spending.
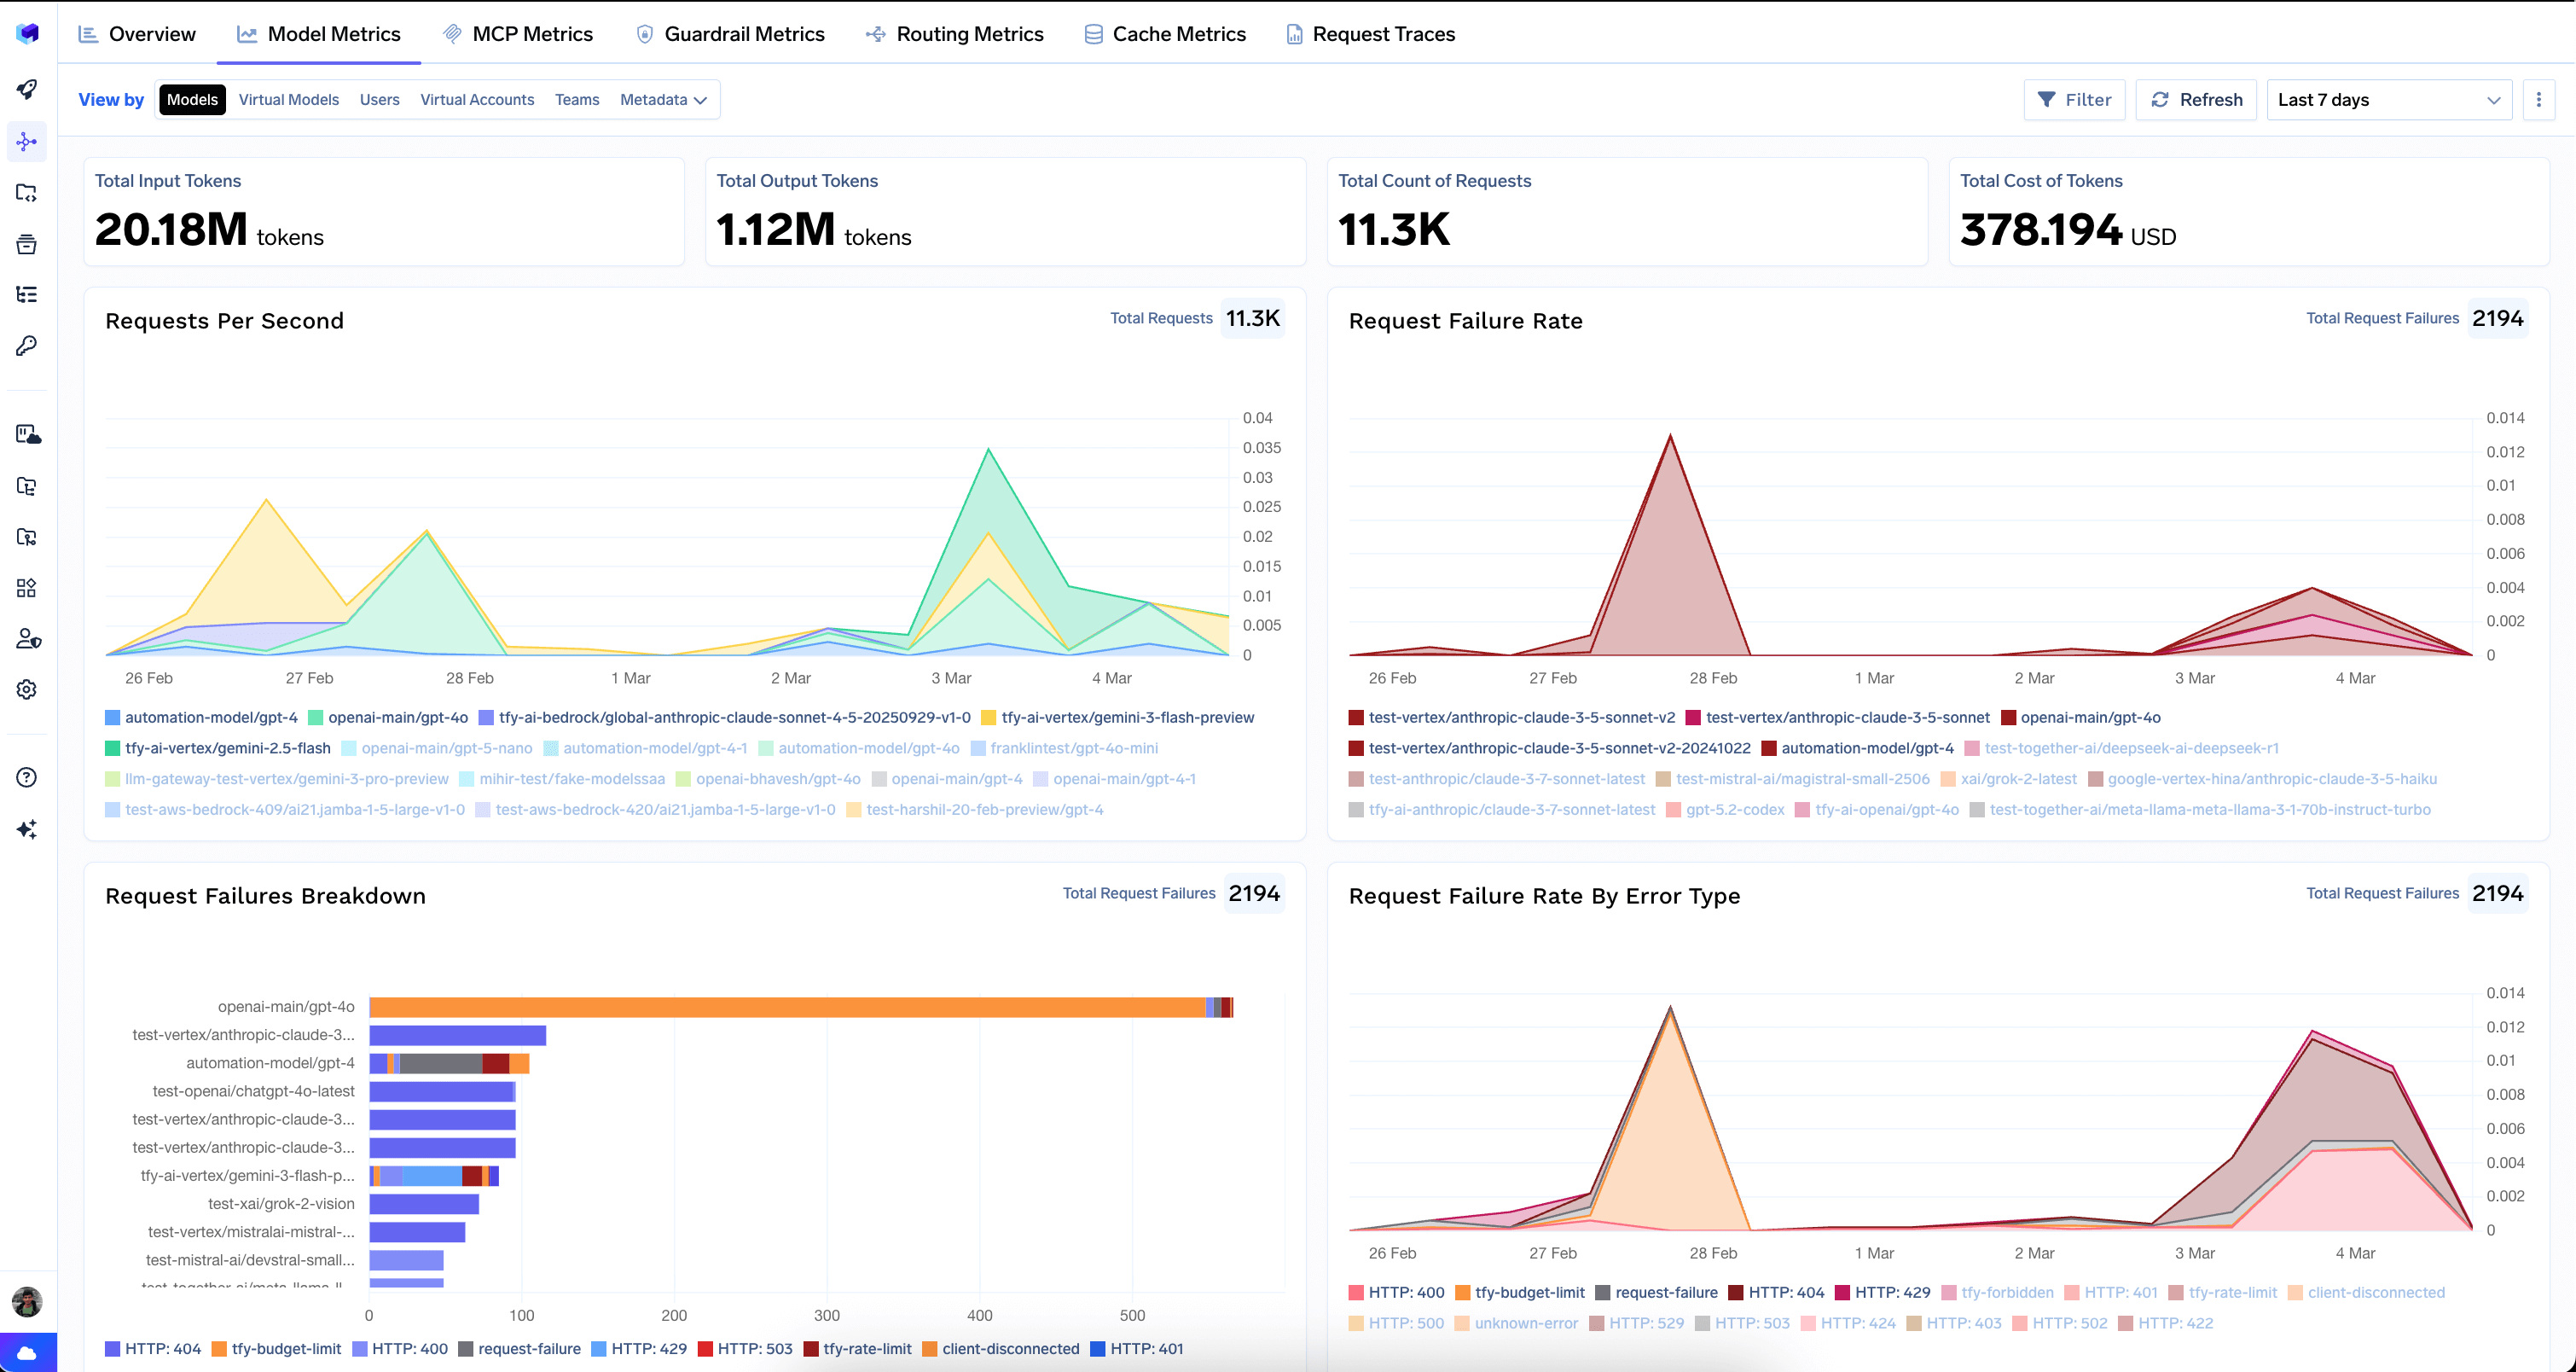 Pivot all charts using the **View by** selector:
| View by | Groups metrics by | When to use |
| -------------------- | -------------------------------------------- | ------------------------------------------------------------- |
| **Models** | Model name (default) | Compare performance across different LLM models |
| **Virtual Models** | Virtual model / model alias | Evaluate model routing configurations |
| **Users** | Username of the caller | Debug user-specific issues or track per-user consumption |
| **Virtual Accounts** | Virtual account | Monitor usage by application or API key |
| **Teams** | Team name | Track costs per team for chargebacks or budget management |
| **Metadata** | Custom metadata keys sent in request headers | Create custom views (e.g. by tenant, environment, or feature) |
* **Total Input Tokens** — total tokens sent to models.
* **Total Output Tokens** — total tokens generated by models.
* **Total Count of Requests** — number of LLM API calls.
* **Total Cost of Tokens** — aggregate cost in USD.
* **Requests Per Second** — throughput over time, broken down by the selected dimension.
* **Request Failure Rate** — percentage of requests that failed over time.
* **Request Failures Breakdown** — stacked bar chart showing failure distribution by error type.
* **Request Failure Rate By Error Type** — failure rate broken down by HTTP status code (4xx, 5xx).
All latency charts support **P50**, **P75**, **P90**, and **P99** percentile selectors.
* **Request Latency** — end-to-end time from when the gateway receives a request until the complete response is returned.
* **Time To First Token (TTFT)** — time until the first token is received. Critical for streaming use cases.
* **Inter Token Latency (ITL)** — average time between consecutive tokens in a streaming response.
* **Time Per Output Token (TPOT)** — average time to generate each output token.
* **Cost of Inference** — cost over time, broken down by the selected dimension.
* **Input Tokens** — input token volume over time.
* **Output Tokens** — output token volume over time.
***
## MCP Metrics
Tracks all Model Context Protocol (MCP) traffic flowing through the AI Gateway — server performance, tool-level metrics, and failure analysis.
The default view provides a server-centric overview of your MCP infrastructure.
Pivot all charts using the **View by** selector:
| View by | Groups metrics by | When to use |
| -------------------- | -------------------------------------------- | ------------------------------------------------------------- |
| **Models** | Model name (default) | Compare performance across different LLM models |
| **Virtual Models** | Virtual model / model alias | Evaluate model routing configurations |
| **Users** | Username of the caller | Debug user-specific issues or track per-user consumption |
| **Virtual Accounts** | Virtual account | Monitor usage by application or API key |
| **Teams** | Team name | Track costs per team for chargebacks or budget management |
| **Metadata** | Custom metadata keys sent in request headers | Create custom views (e.g. by tenant, environment, or feature) |
* **Total Input Tokens** — total tokens sent to models.
* **Total Output Tokens** — total tokens generated by models.
* **Total Count of Requests** — number of LLM API calls.
* **Total Cost of Tokens** — aggregate cost in USD.
* **Requests Per Second** — throughput over time, broken down by the selected dimension.
* **Request Failure Rate** — percentage of requests that failed over time.
* **Request Failures Breakdown** — stacked bar chart showing failure distribution by error type.
* **Request Failure Rate By Error Type** — failure rate broken down by HTTP status code (4xx, 5xx).
All latency charts support **P50**, **P75**, **P90**, and **P99** percentile selectors.
* **Request Latency** — end-to-end time from when the gateway receives a request until the complete response is returned.
* **Time To First Token (TTFT)** — time until the first token is received. Critical for streaming use cases.
* **Inter Token Latency (ITL)** — average time between consecutive tokens in a streaming response.
* **Time Per Output Token (TPOT)** — average time to generate each output token.
* **Cost of Inference** — cost over time, broken down by the selected dimension.
* **Input Tokens** — input token volume over time.
* **Output Tokens** — output token volume over time.
***
## MCP Metrics
Tracks all Model Context Protocol (MCP) traffic flowing through the AI Gateway — server performance, tool-level metrics, and failure analysis.
The default view provides a server-centric overview of your MCP infrastructure.
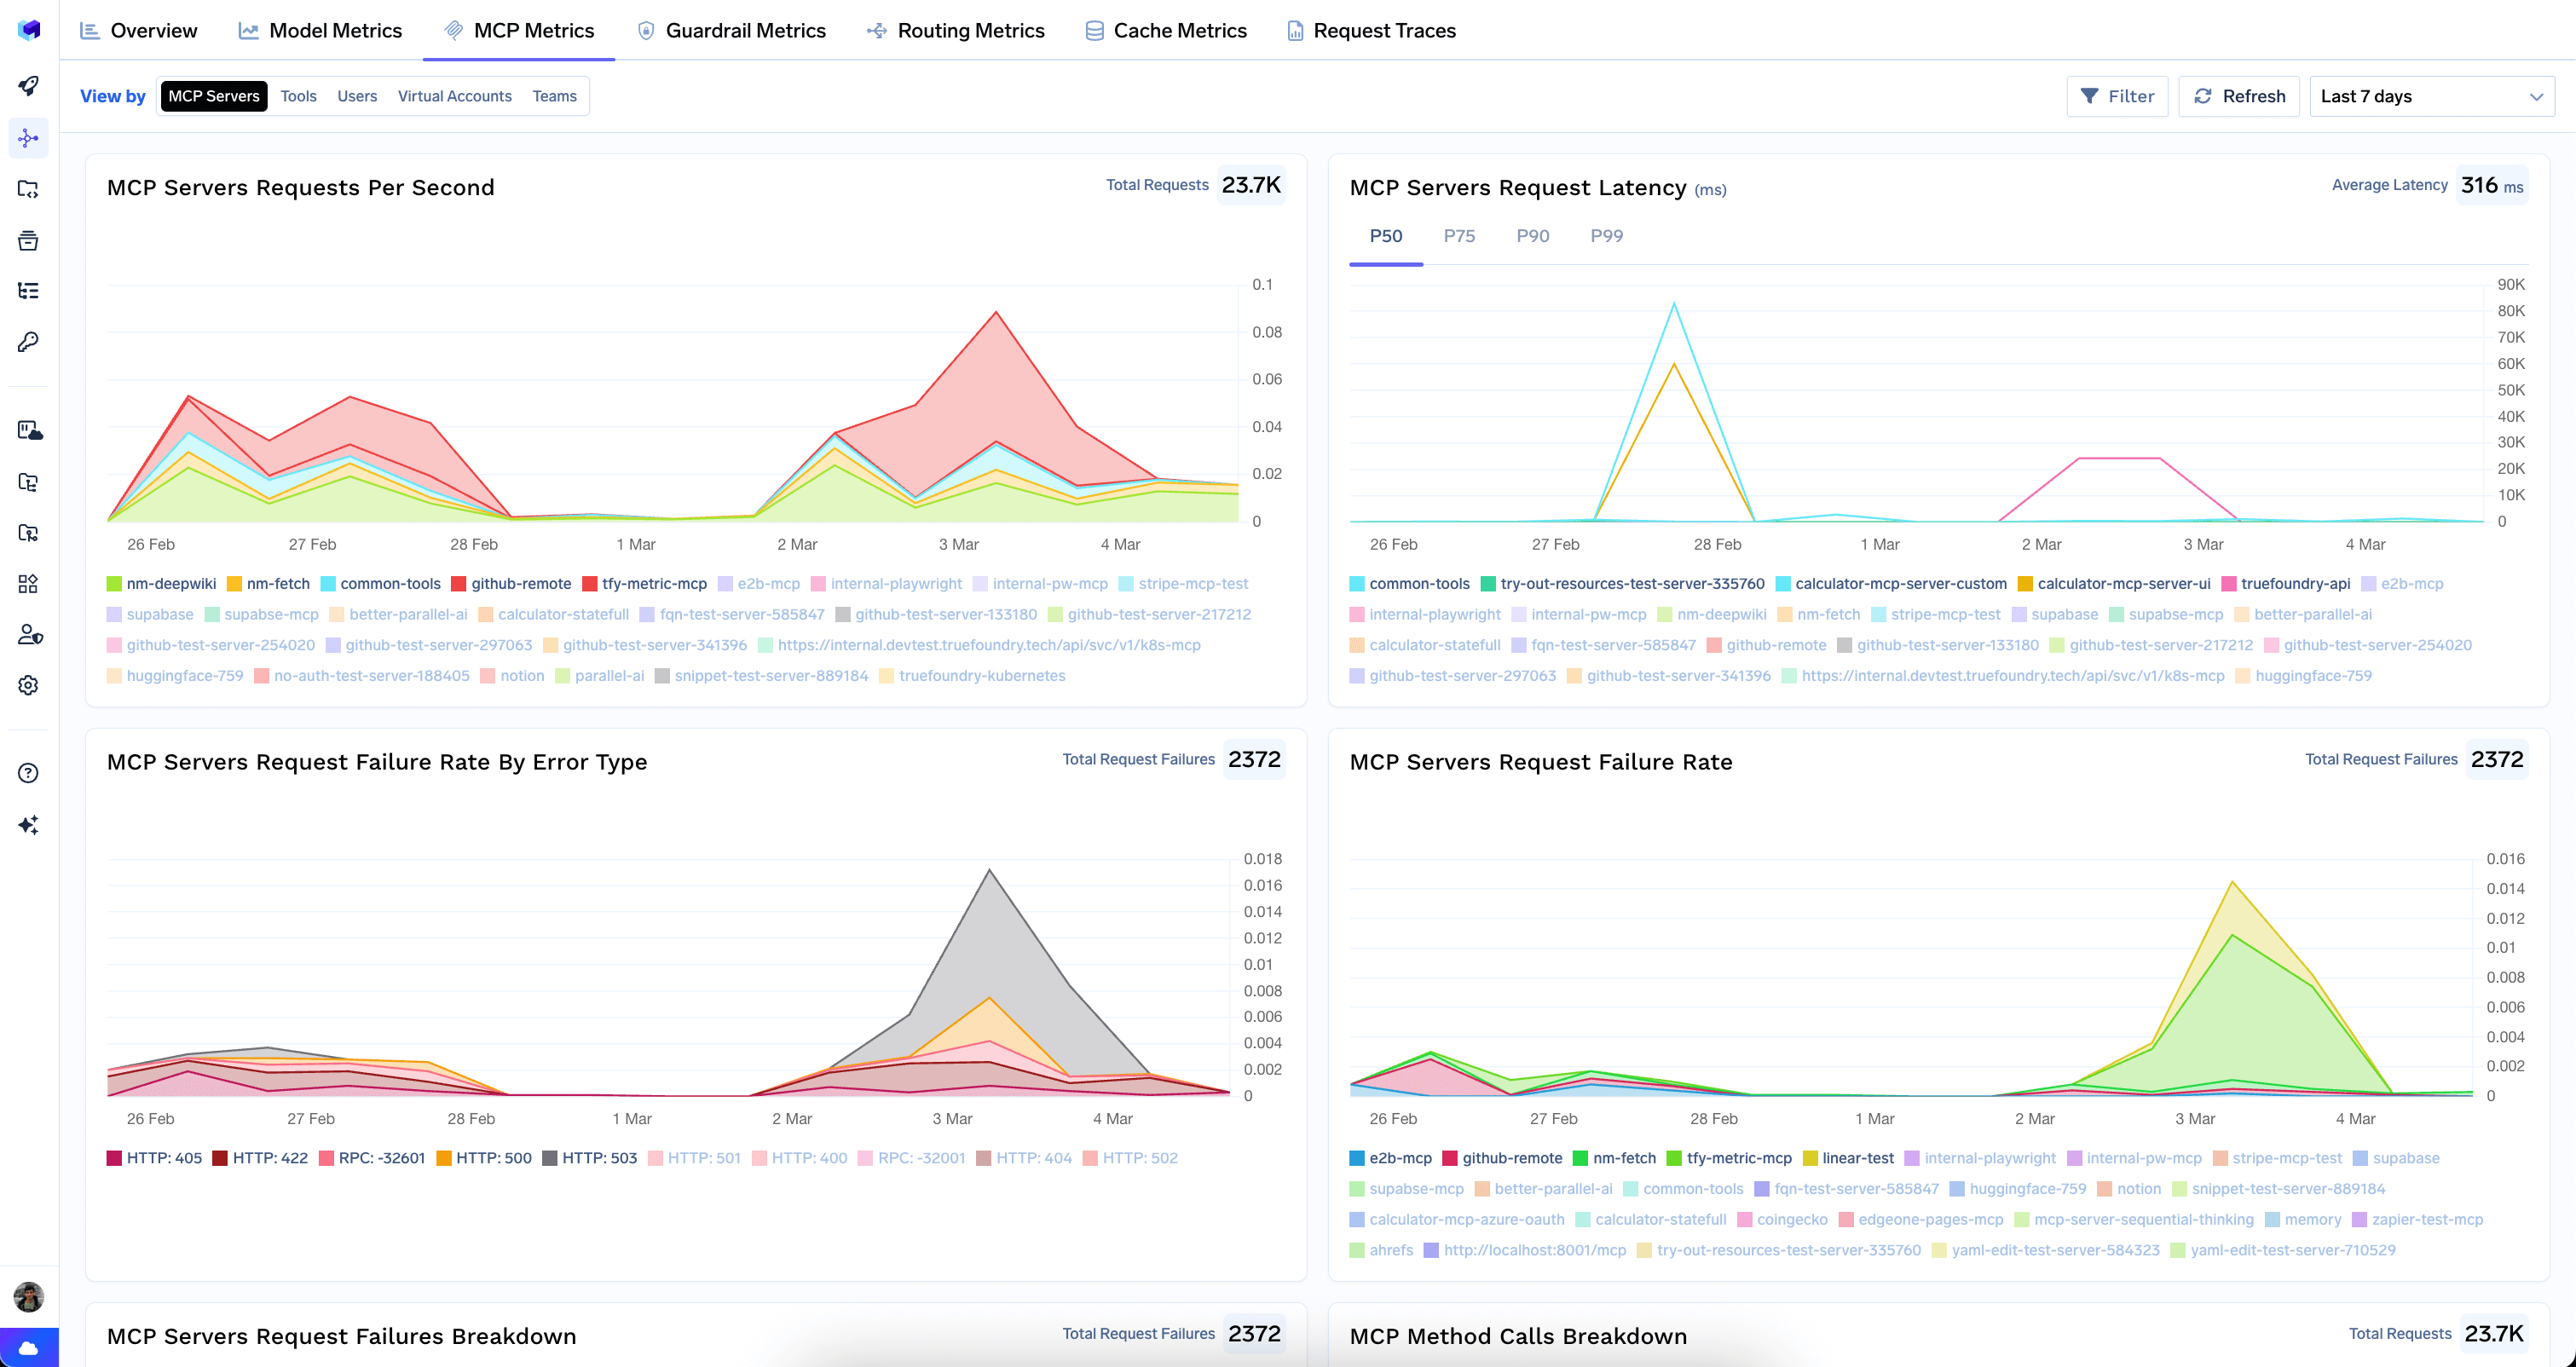 Available charts:
* **Requests Per Second** — throughput per MCP server over time.
* **Request Latency** — latency with P50/P75/P90/P99 percentile selectors.
* **Request Failure Rate By Error Type** — failures broken down by HTTP status code and RPC errors.
* **Request Failure Rate** — overall failure rate per server over time.
* **Request Failures Breakdown** — failures by server and error type.
* **MCP Method Calls Breakdown** — which MCP methods (`tools/list`, `tools/call`, `resources/list`, etc.) are called most frequently.
* **Error Breakdown** — errors grouped by error type and virtual account.
Drills down to the individual tool level across all MCP servers.
Available charts:
* **Requests Per Second** — throughput per MCP server over time.
* **Request Latency** — latency with P50/P75/P90/P99 percentile selectors.
* **Request Failure Rate By Error Type** — failures broken down by HTTP status code and RPC errors.
* **Request Failure Rate** — overall failure rate per server over time.
* **Request Failures Breakdown** — failures by server and error type.
* **MCP Method Calls Breakdown** — which MCP methods (`tools/list`, `tools/call`, `resources/list`, etc.) are called most frequently.
* **Error Breakdown** — errors grouped by error type and virtual account.
Drills down to the individual tool level across all MCP servers.
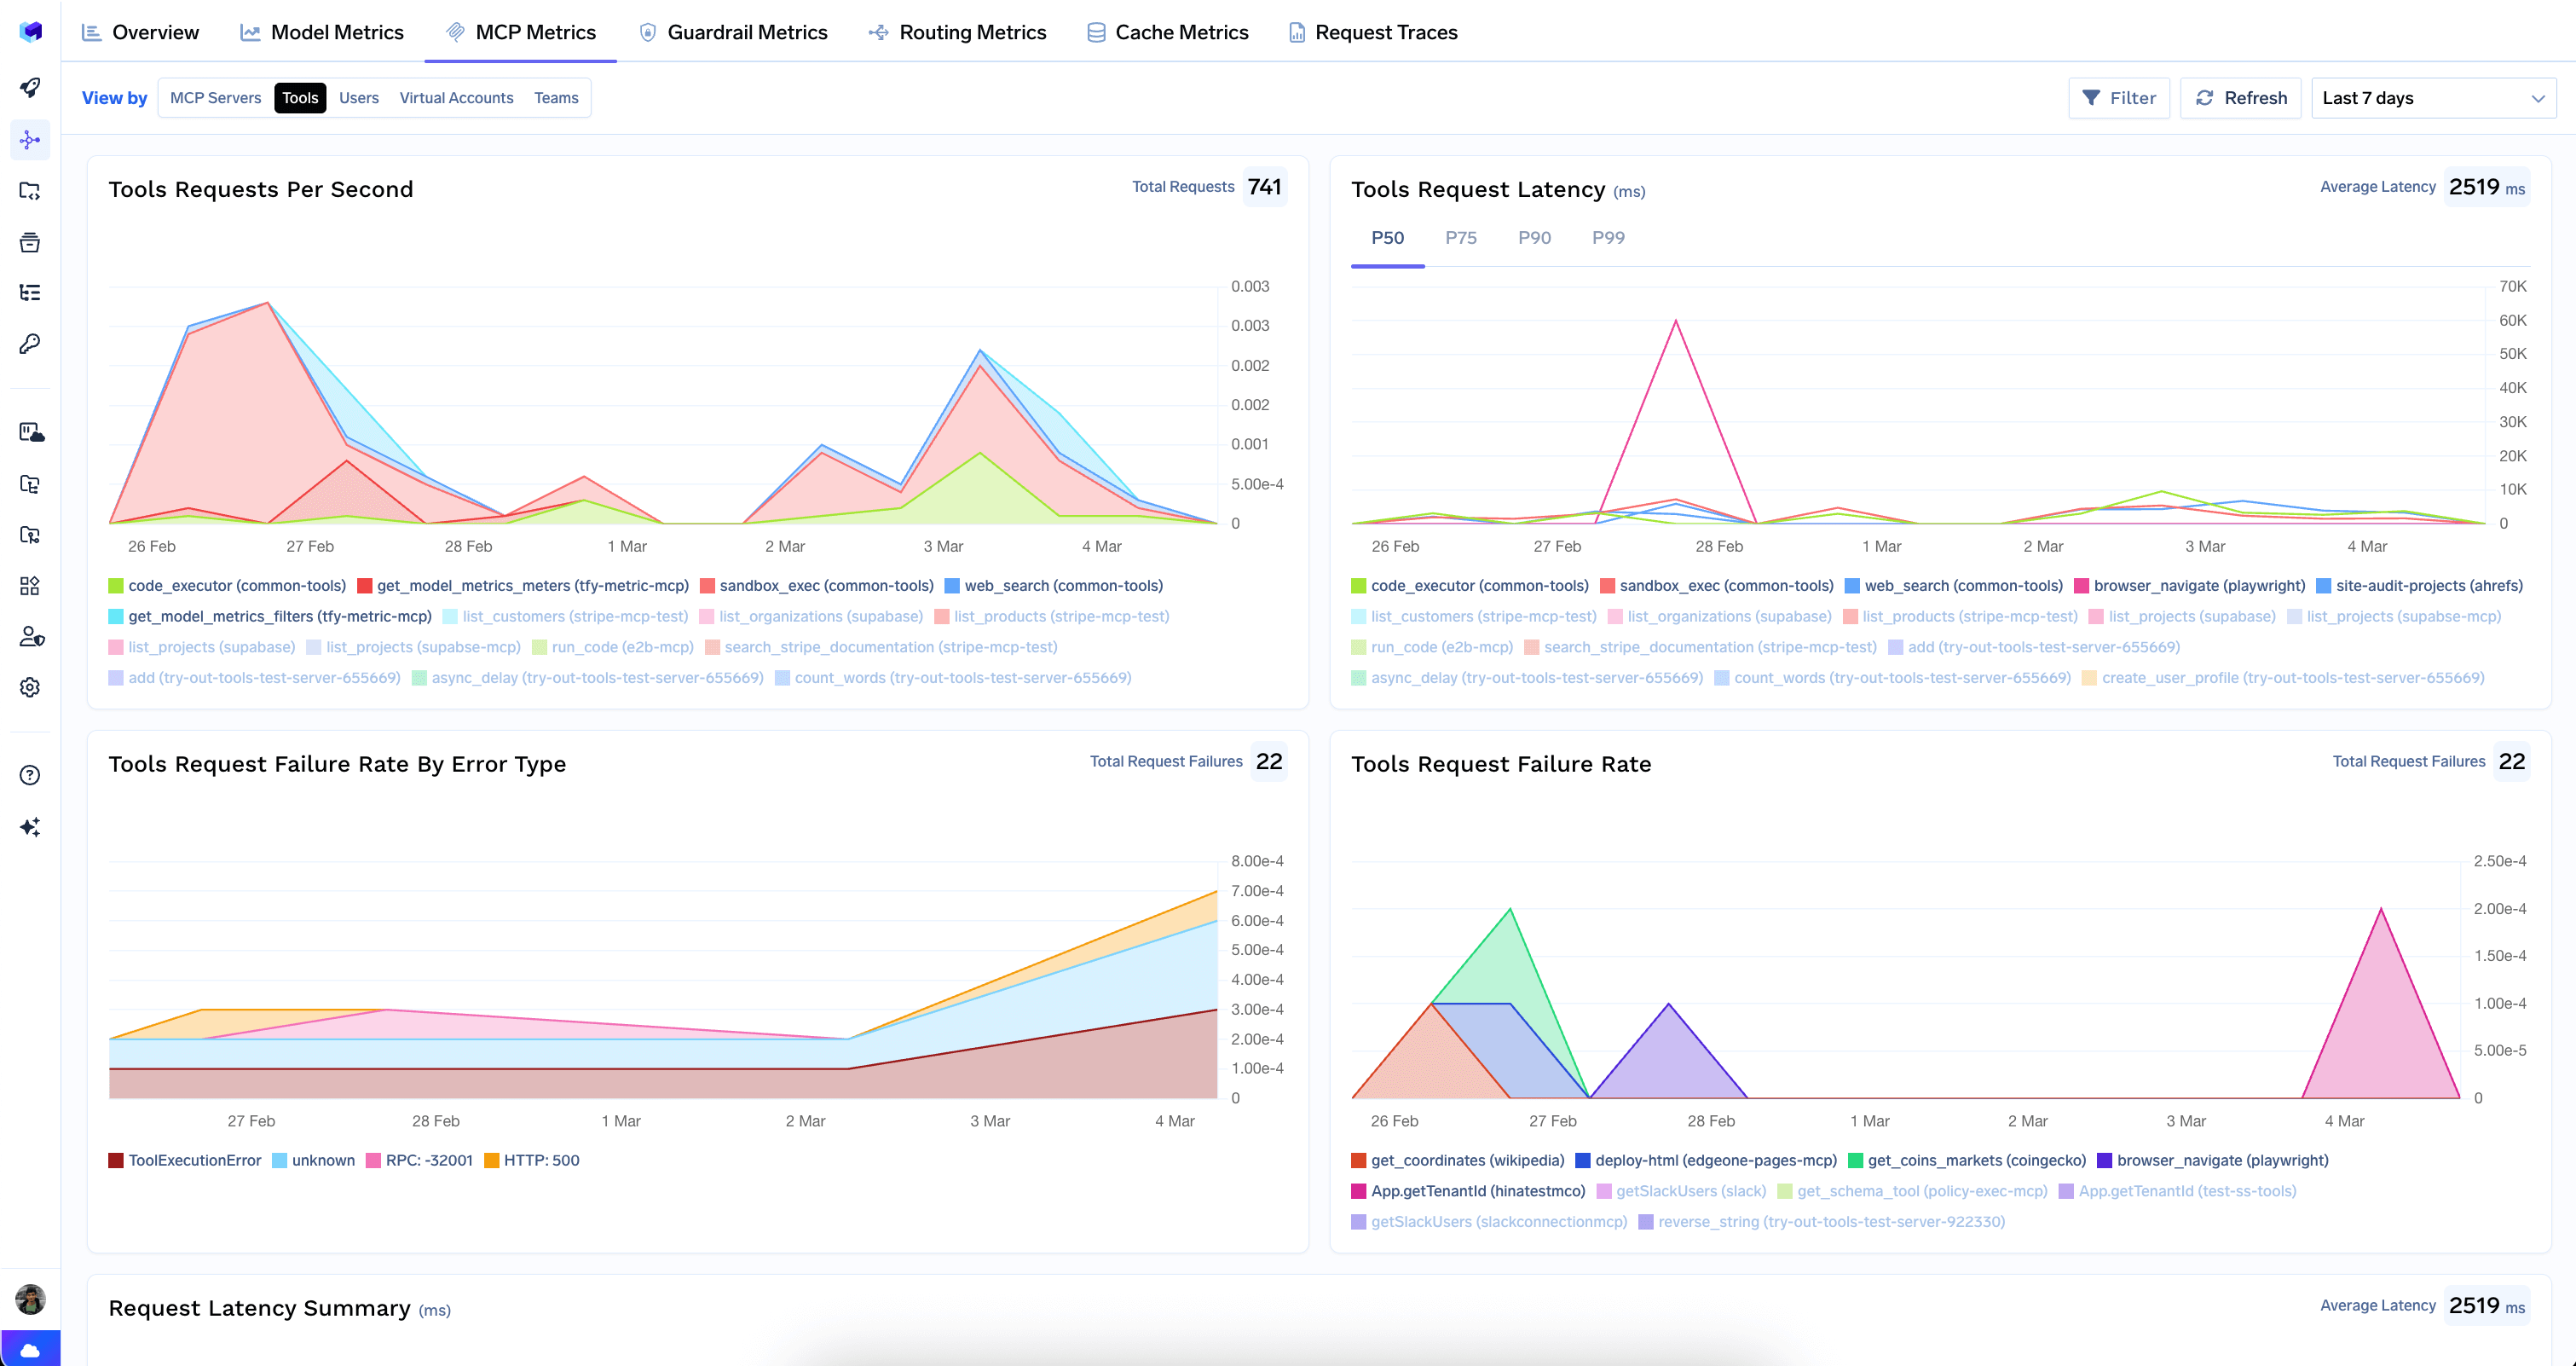 Available charts:
* **Requests Per Second** — throughput per tool over time.
* **Request Latency** — latency with P50/P75/P90/P99 selectors.
* **Request Failure Rate By Error Type** — failures by error type for each tool.
* **Request Failure Rate** — overall failure rate per tool.
* **Request Latency Summary** — horizontal bar chart comparing latency distributions across tools.
* **Requests Count** — tools ranked by total request count.
* **Requests Failures Breakdown** — failures broken down by tool and error type.
| View by | Groups metrics by | When to use |
| -------------------- | ------------------------- | ---------------------------------------------- |
| **MCP Servers** | MCP server name (default) | Identify underperforming or overloaded servers |
| **Tools** | Individual tool name | Find slow or error-prone tools |
| **Users** | Username of the caller | Track per-user MCP consumption |
| **Virtual Accounts** | Virtual account | Monitor MCP usage by application or API key |
| **Teams** | Team name | Understand MCP usage patterns across teams |
***
## Guardrail Metrics
Shows how your content safety and compliance guardrails are performing — evaluations, blocked and mutated requests, and latency impact.
Available charts:
* **Requests Per Second** — throughput per tool over time.
* **Request Latency** — latency with P50/P75/P90/P99 selectors.
* **Request Failure Rate By Error Type** — failures by error type for each tool.
* **Request Failure Rate** — overall failure rate per tool.
* **Request Latency Summary** — horizontal bar chart comparing latency distributions across tools.
* **Requests Count** — tools ranked by total request count.
* **Requests Failures Breakdown** — failures broken down by tool and error type.
| View by | Groups metrics by | When to use |
| -------------------- | ------------------------- | ---------------------------------------------- |
| **MCP Servers** | MCP server name (default) | Identify underperforming or overloaded servers |
| **Tools** | Individual tool name | Find slow or error-prone tools |
| **Users** | Username of the caller | Track per-user MCP consumption |
| **Virtual Accounts** | Virtual account | Monitor MCP usage by application or API key |
| **Teams** | Team name | Understand MCP usage patterns across teams |
***
## Guardrail Metrics
Shows how your content safety and compliance guardrails are performing — evaluations, blocked and mutated requests, and latency impact.
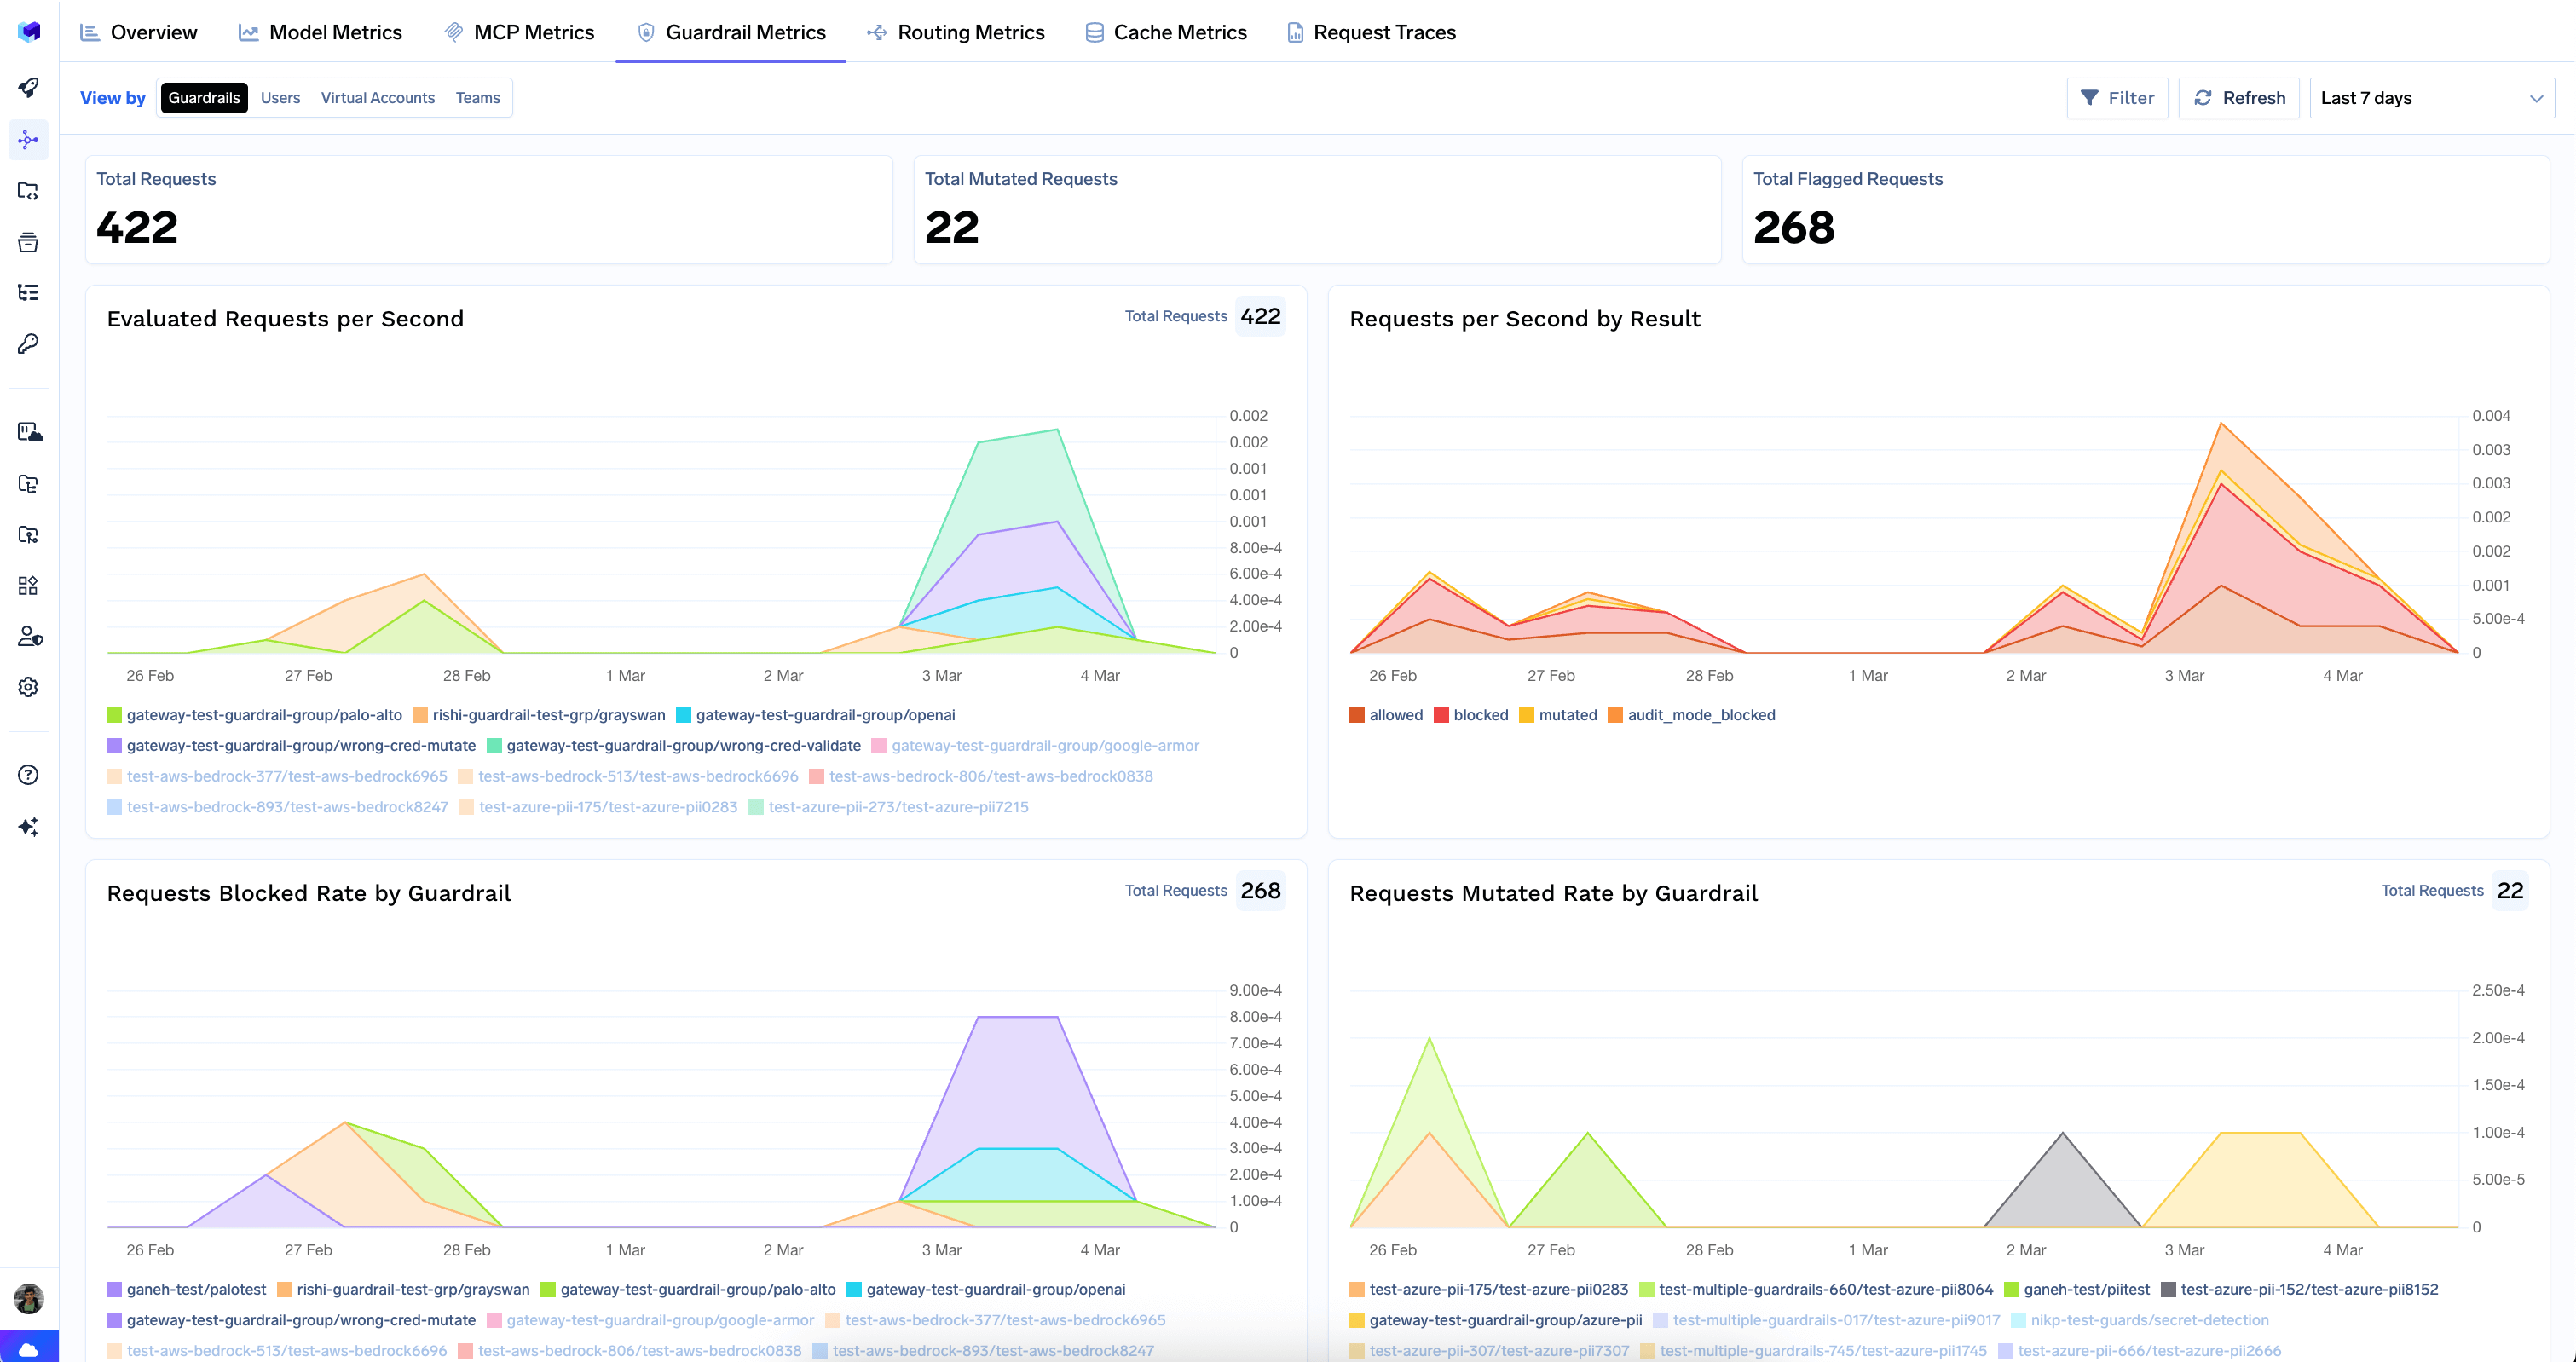 * **Total Requests** — number of requests evaluated by guardrails.
* **Total Mutated Requests** — requests where a guardrail modified the content.
* **Total Flagged Requests** — requests that were blocked by a guardrail.
* **Evaluated Requests per Second** — rate of guardrail evaluations over time.
* **Requests per Second by Result** — evaluations split by outcome: `allowed`, `blocked`, `mutated`, `audit_mode_blocked`.
* **Requests Blocked Rate by Guardrail** — which guardrails are blocking the most traffic.
* **Requests Mutated Rate by Guardrail** — which guardrails are mutating content most often.
* **Guardrail Results for Model Input** — per-guardrail outcomes for prompts/user messages.
* **Guardrail Results for Model Output** — per-guardrail outcomes for completions/responses.
* **Guardrail Latency Rate** — latency overhead with P50/P75/P90/P99 percentiles.
* **Request Latency Distribution** — latency comparison across guardrail groups.
| View by | Groups metrics by | When to use |
| -------------------- | ------------------------------ | ----------------------------------------------- |
| **Guardrails** | Guardrail group name (default) | Compare effectiveness across guardrail policies |
| **Users** | Username of the caller | See which users are triggering guardrails most |
| **Virtual Accounts** | Virtual account | Track guardrail activity by application |
| **Teams** | Team name | Understand guardrail impact per team |
***
## Routing Metrics
Visibility into routing rules, rate limits, and budget limits — how they distribute traffic and enforce policies.
* **Total Requests** — number of requests evaluated by guardrails.
* **Total Mutated Requests** — requests where a guardrail modified the content.
* **Total Flagged Requests** — requests that were blocked by a guardrail.
* **Evaluated Requests per Second** — rate of guardrail evaluations over time.
* **Requests per Second by Result** — evaluations split by outcome: `allowed`, `blocked`, `mutated`, `audit_mode_blocked`.
* **Requests Blocked Rate by Guardrail** — which guardrails are blocking the most traffic.
* **Requests Mutated Rate by Guardrail** — which guardrails are mutating content most often.
* **Guardrail Results for Model Input** — per-guardrail outcomes for prompts/user messages.
* **Guardrail Results for Model Output** — per-guardrail outcomes for completions/responses.
* **Guardrail Latency Rate** — latency overhead with P50/P75/P90/P99 percentiles.
* **Request Latency Distribution** — latency comparison across guardrail groups.
| View by | Groups metrics by | When to use |
| -------------------- | ------------------------------ | ----------------------------------------------- |
| **Guardrails** | Guardrail group name (default) | Compare effectiveness across guardrail policies |
| **Users** | Username of the caller | See which users are triggering guardrails most |
| **Virtual Accounts** | Virtual account | Track guardrail activity by application |
| **Teams** | Team name | Understand guardrail impact per team |
***
## Routing Metrics
Visibility into routing rules, rate limits, and budget limits — how they distribute traffic and enforce policies.
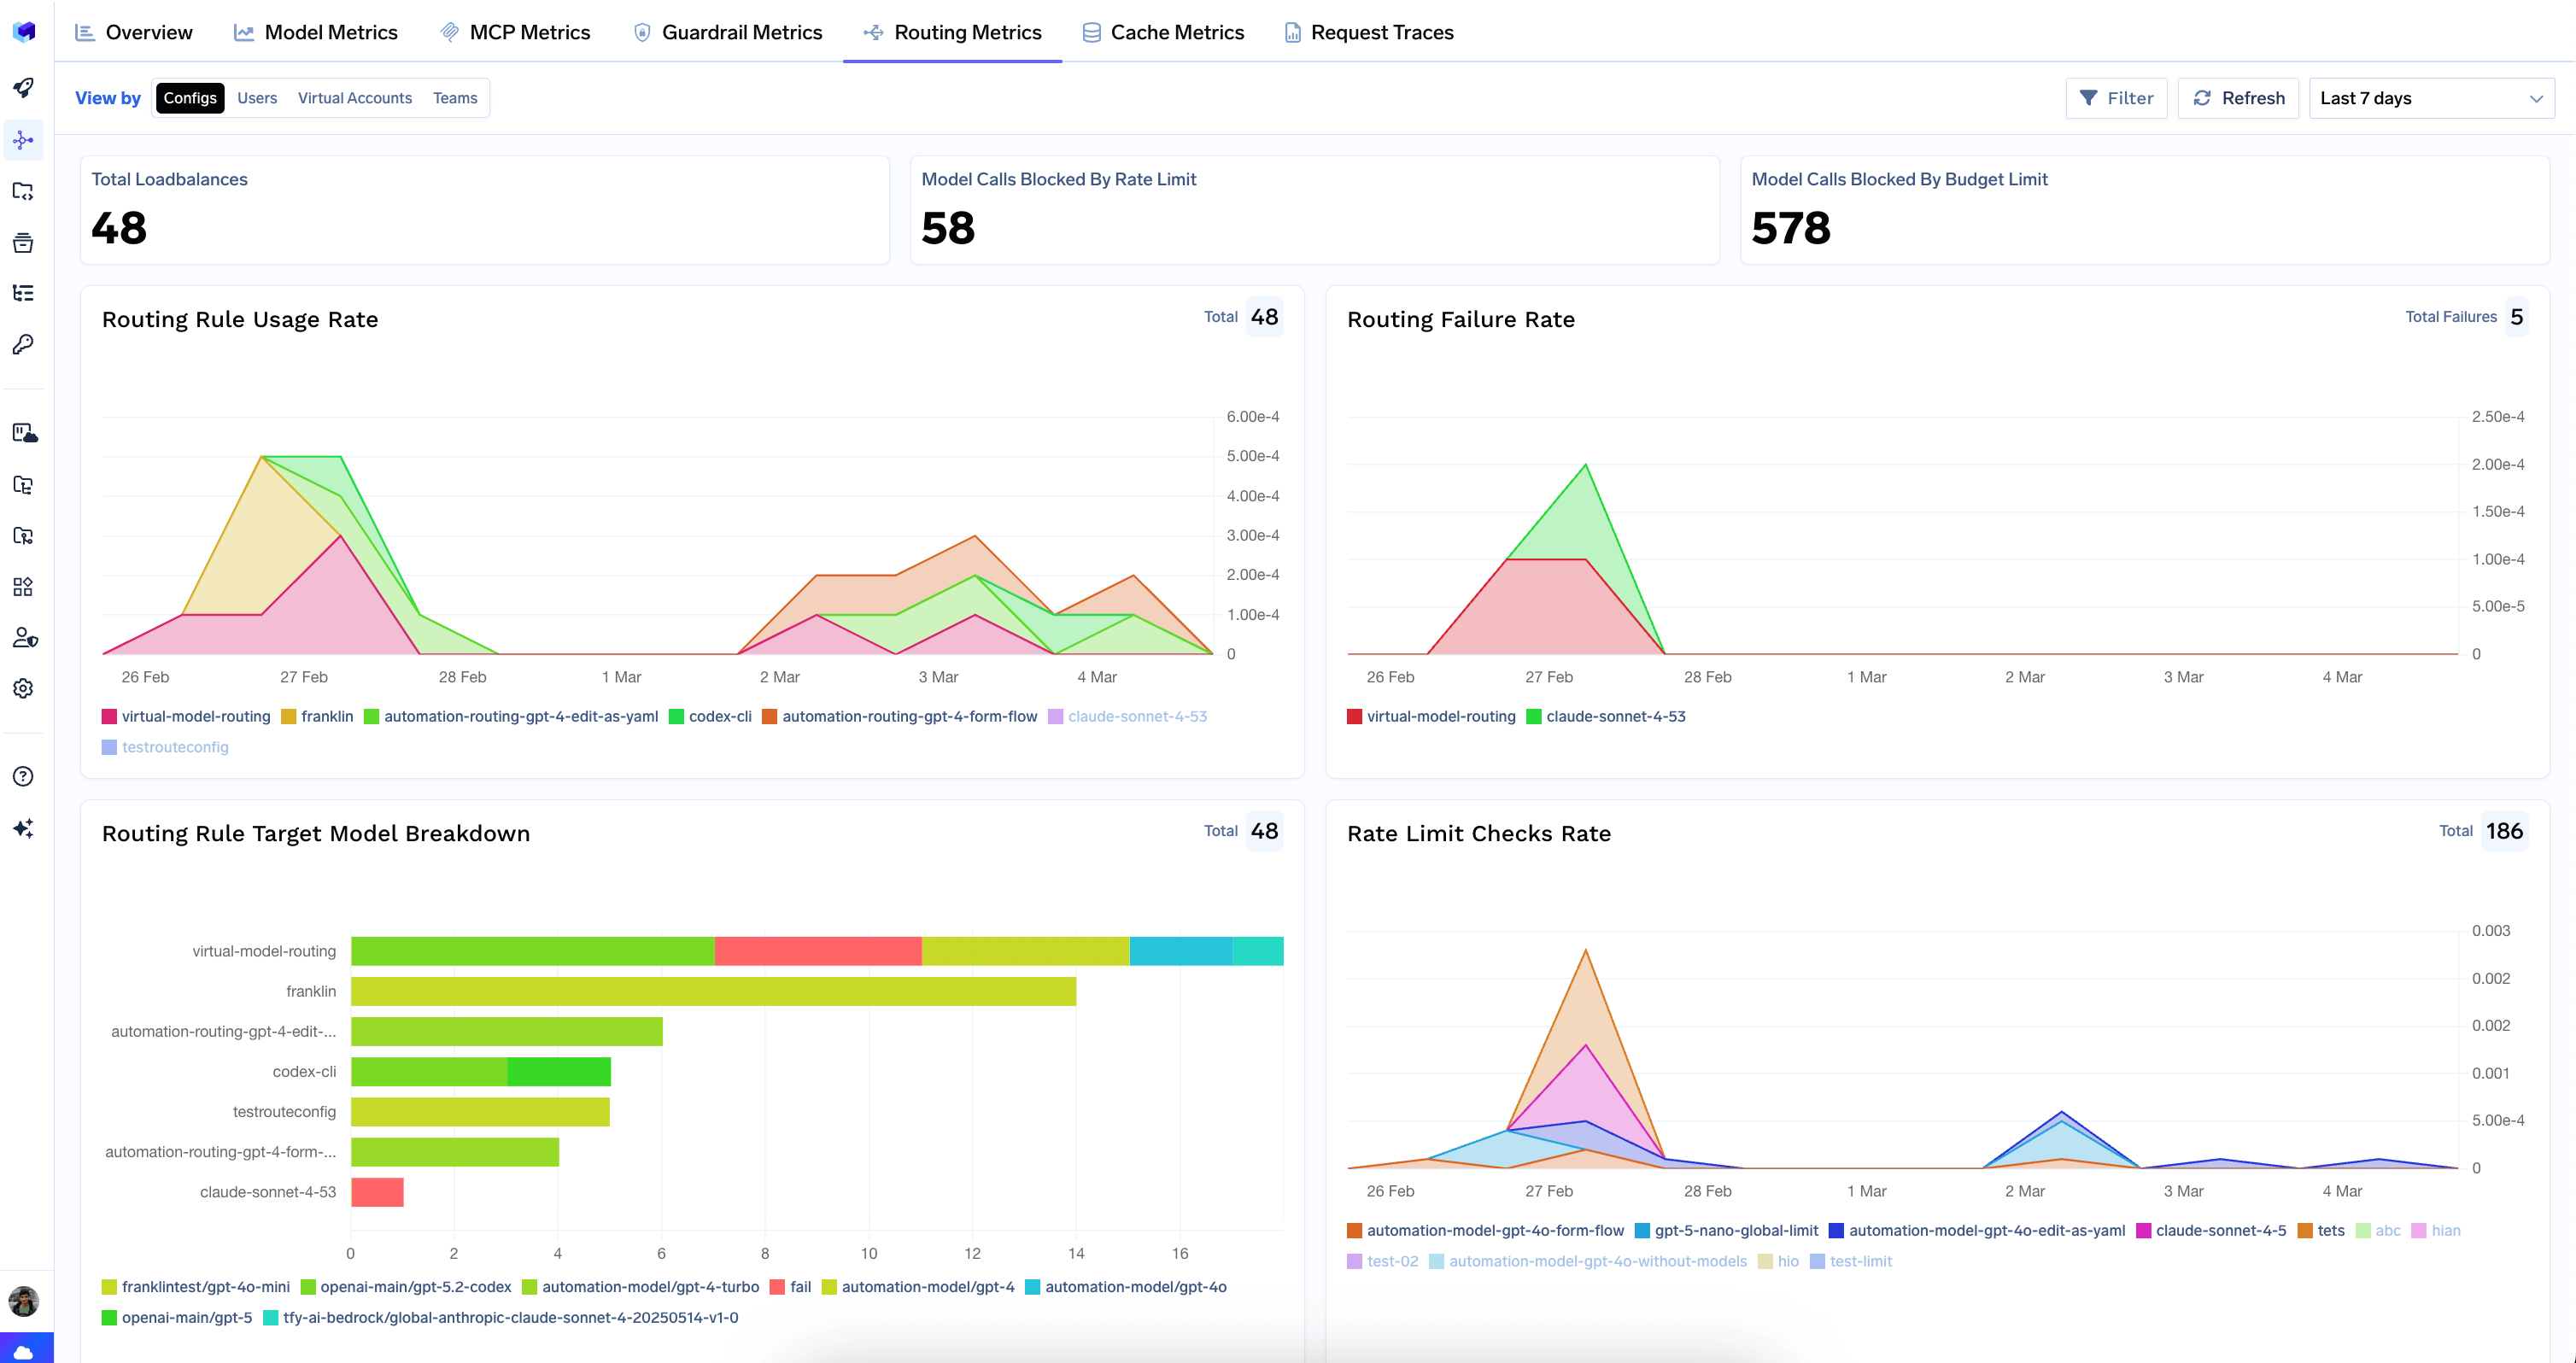 * **Total Loadbalances** — number of times load balancing was applied.
* **Model Calls Blocked By Rate Limit** — requests rejected for exceeding a rate limit.
* **Model Calls Blocked By Budget Limit** — requests rejected for exceeding a budget constraint.
* **Routing Rule Usage Rate** — how often each routing rule is triggered over time.
* **Routing Failure Rate** — routing-level failures where no valid target was found.
* **Routing Rule Target Model Breakdown** — which target models each routing rule resolves to.
* **Rate Limit Checks Rate** — rate of rate-limit evaluations over time.
* **Rate Limit Exceeded Rate** — how often rate limits are being hit.
* **Rate Limit Result Breakdown** — allowed vs. blocked counts per rate-limit rule.
* **Budget Limit Checks Rate** — rate of budget-limit evaluations over time.
* **Budget Limit Exceeded Rate** — how often budget limits are being hit.
* **Budget Limit Result Breakdown** — allowed vs. blocked counts per budget rule.
| View by | Groups metrics by | When to use |
| -------------------- | ----------------------------------- | --------------------------------------------------------------------- |
| **Configs** | Configuration / rule name (default) | See which configs, rate limits, and budget limits are being triggered |
| **Users** | Username of the caller | Identify users hitting rate or budget limits |
| **Virtual Accounts** | Virtual account | Monitor policy impact by application |
| **Teams** | Team name | Understand policy impact per team |
***
## Cache Metrics
Measures the performance of your semantic cache — hit rates, cost savings, latency overhead, and errors.
* **Total Loadbalances** — number of times load balancing was applied.
* **Model Calls Blocked By Rate Limit** — requests rejected for exceeding a rate limit.
* **Model Calls Blocked By Budget Limit** — requests rejected for exceeding a budget constraint.
* **Routing Rule Usage Rate** — how often each routing rule is triggered over time.
* **Routing Failure Rate** — routing-level failures where no valid target was found.
* **Routing Rule Target Model Breakdown** — which target models each routing rule resolves to.
* **Rate Limit Checks Rate** — rate of rate-limit evaluations over time.
* **Rate Limit Exceeded Rate** — how often rate limits are being hit.
* **Rate Limit Result Breakdown** — allowed vs. blocked counts per rate-limit rule.
* **Budget Limit Checks Rate** — rate of budget-limit evaluations over time.
* **Budget Limit Exceeded Rate** — how often budget limits are being hit.
* **Budget Limit Result Breakdown** — allowed vs. blocked counts per budget rule.
| View by | Groups metrics by | When to use |
| -------------------- | ----------------------------------- | --------------------------------------------------------------------- |
| **Configs** | Configuration / rule name (default) | See which configs, rate limits, and budget limits are being triggered |
| **Users** | Username of the caller | Identify users hitting rate or budget limits |
| **Virtual Accounts** | Virtual account | Monitor policy impact by application |
| **Teams** | Team name | Understand policy impact per team |
***
## Cache Metrics
Measures the performance of your semantic cache — hit rates, cost savings, latency overhead, and errors.
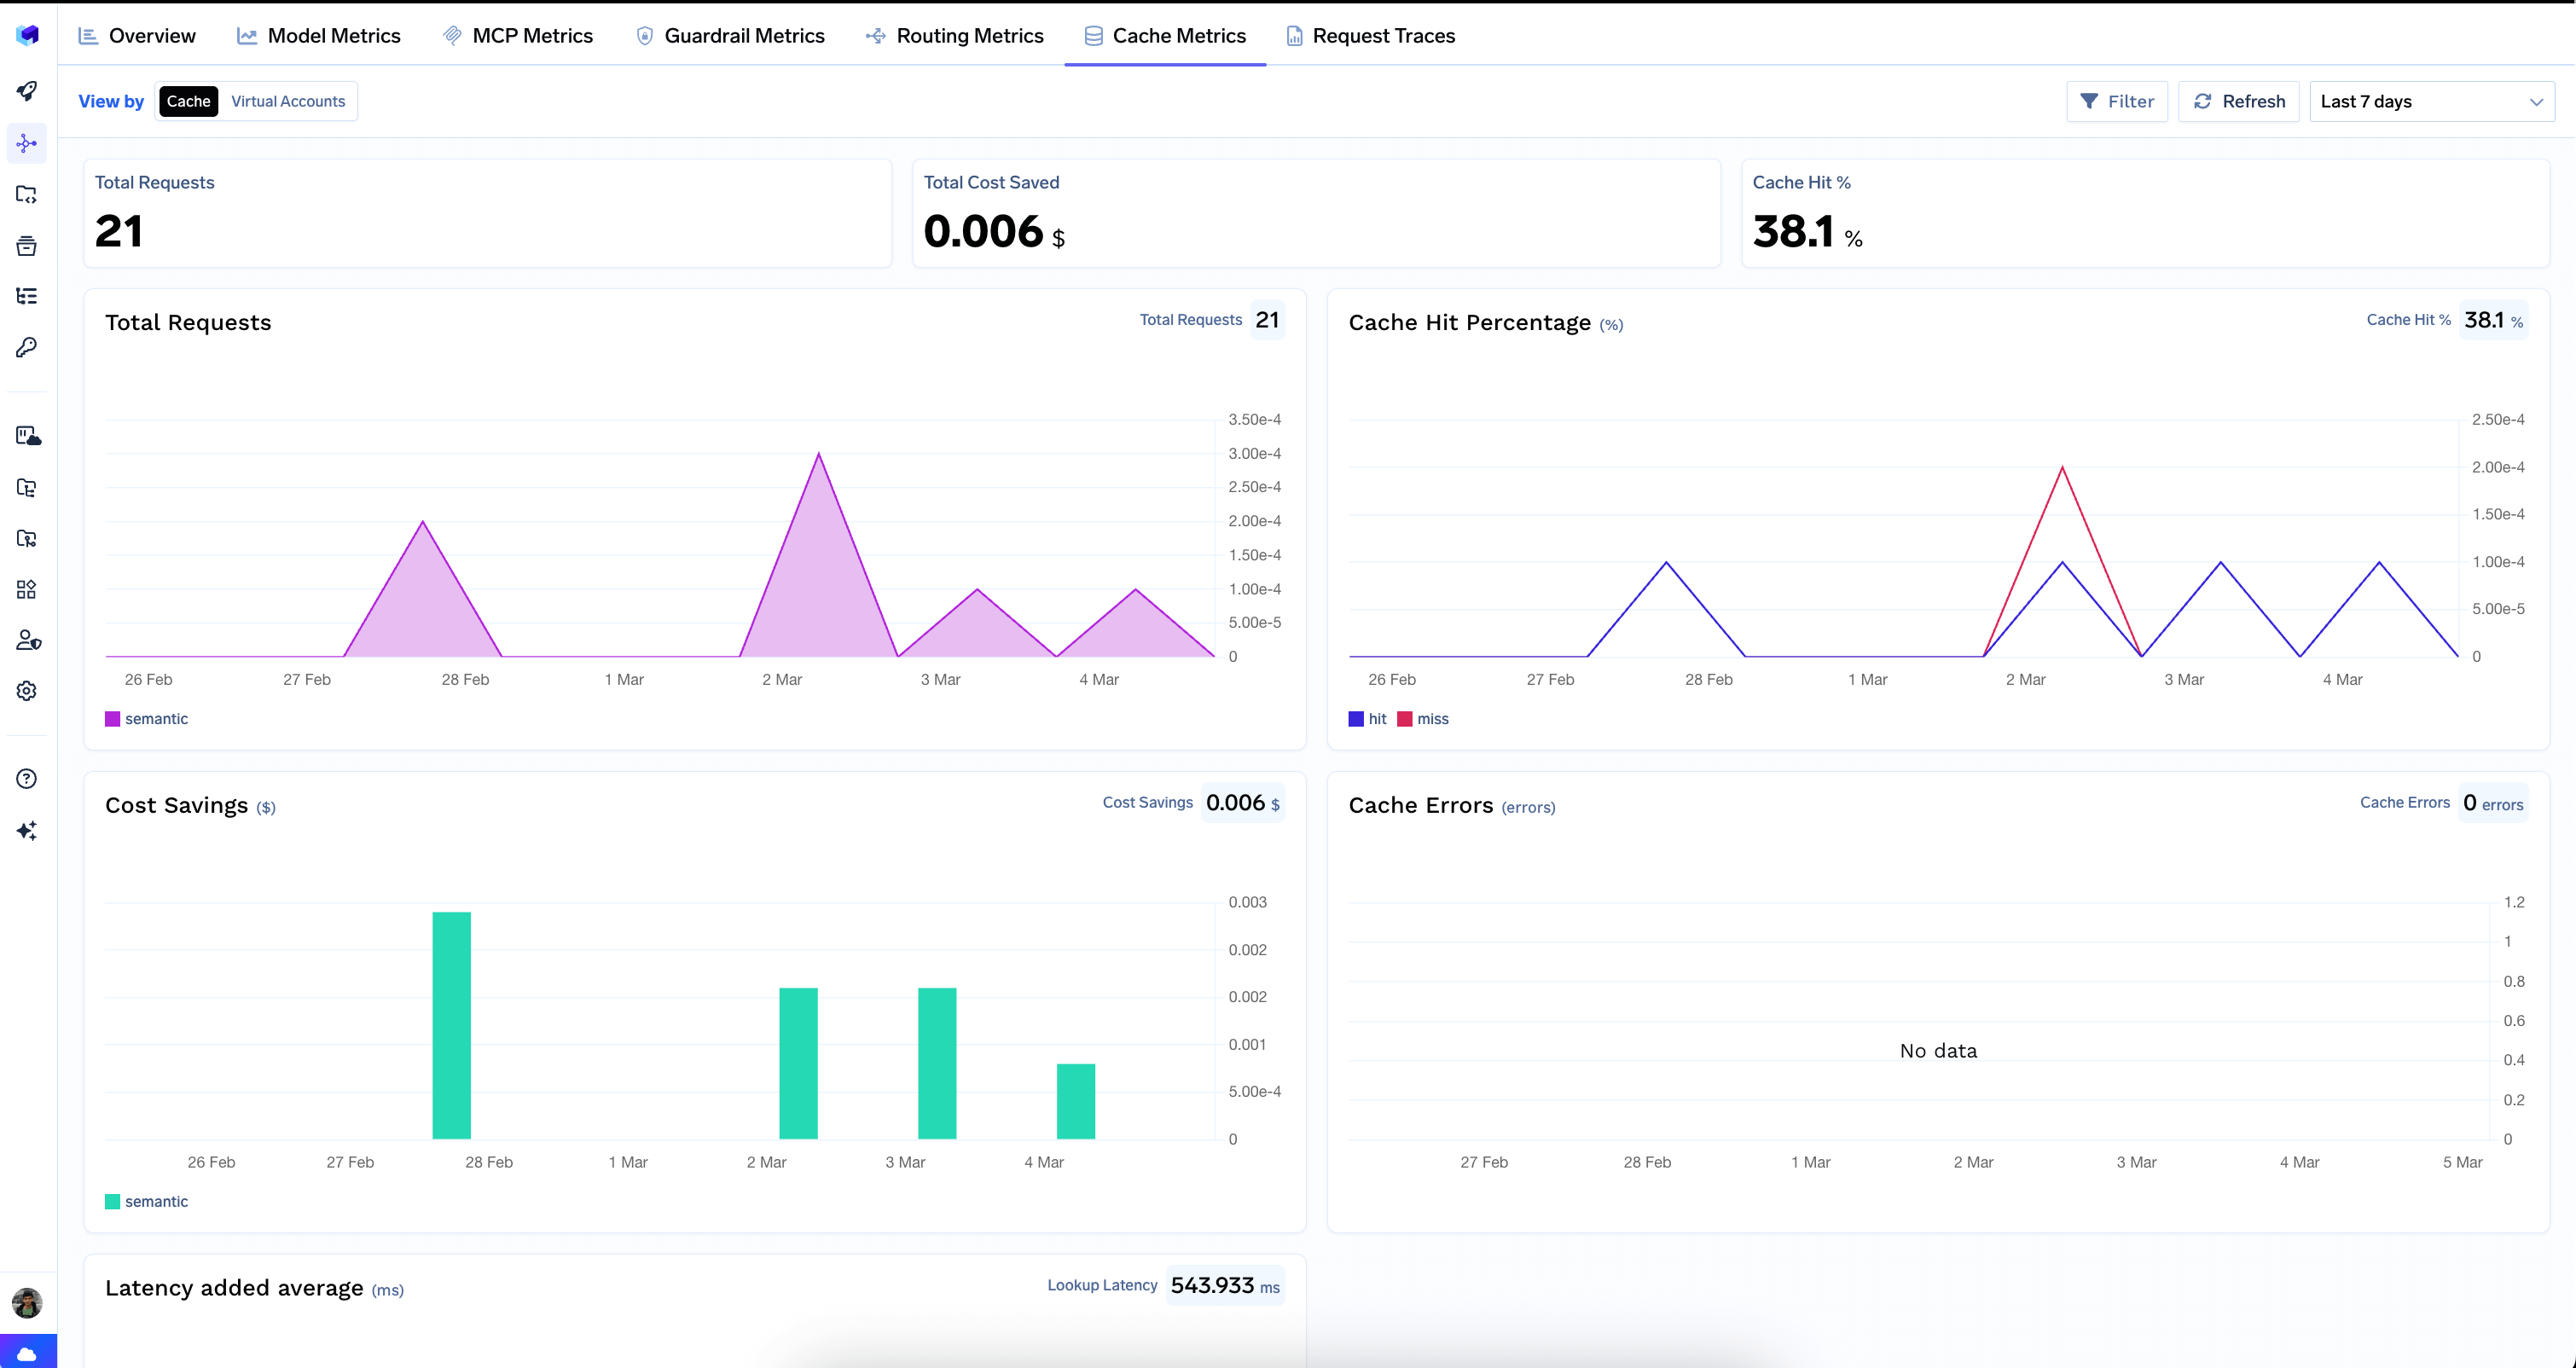 * **Total Requests** — number of requests that went through the cache lookup.
* **Total Cost Saved** — dollar amount saved by serving responses from cache.
* **Cache Hit %** — percentage of requests served from cache.
* **Total Requests** — cache request volume over time.
* **Cache Hit Percentage** — hit vs. miss rate over time. A high hit rate means the cache is working well; a low or declining hit rate may indicate queries are too diverse for the current cache configuration.
* **Cost Savings** — dollar savings from cache hits over time.
* **Cache Errors** — errors encountered during cache operations. Ideally this should show "No data".
* **Latency Added Average** — average latency overhead introduced by cache lookups.
| View by | Groups metrics by | When to use |
| -------------------- | -------------------- | ----------------------------------------------- |
| **Cache** | Cache type (default) | Overall cache performance |
| **Virtual Accounts** | Virtual account | Compare cache effectiveness across applications |
***
## Filtering and Drill-Down
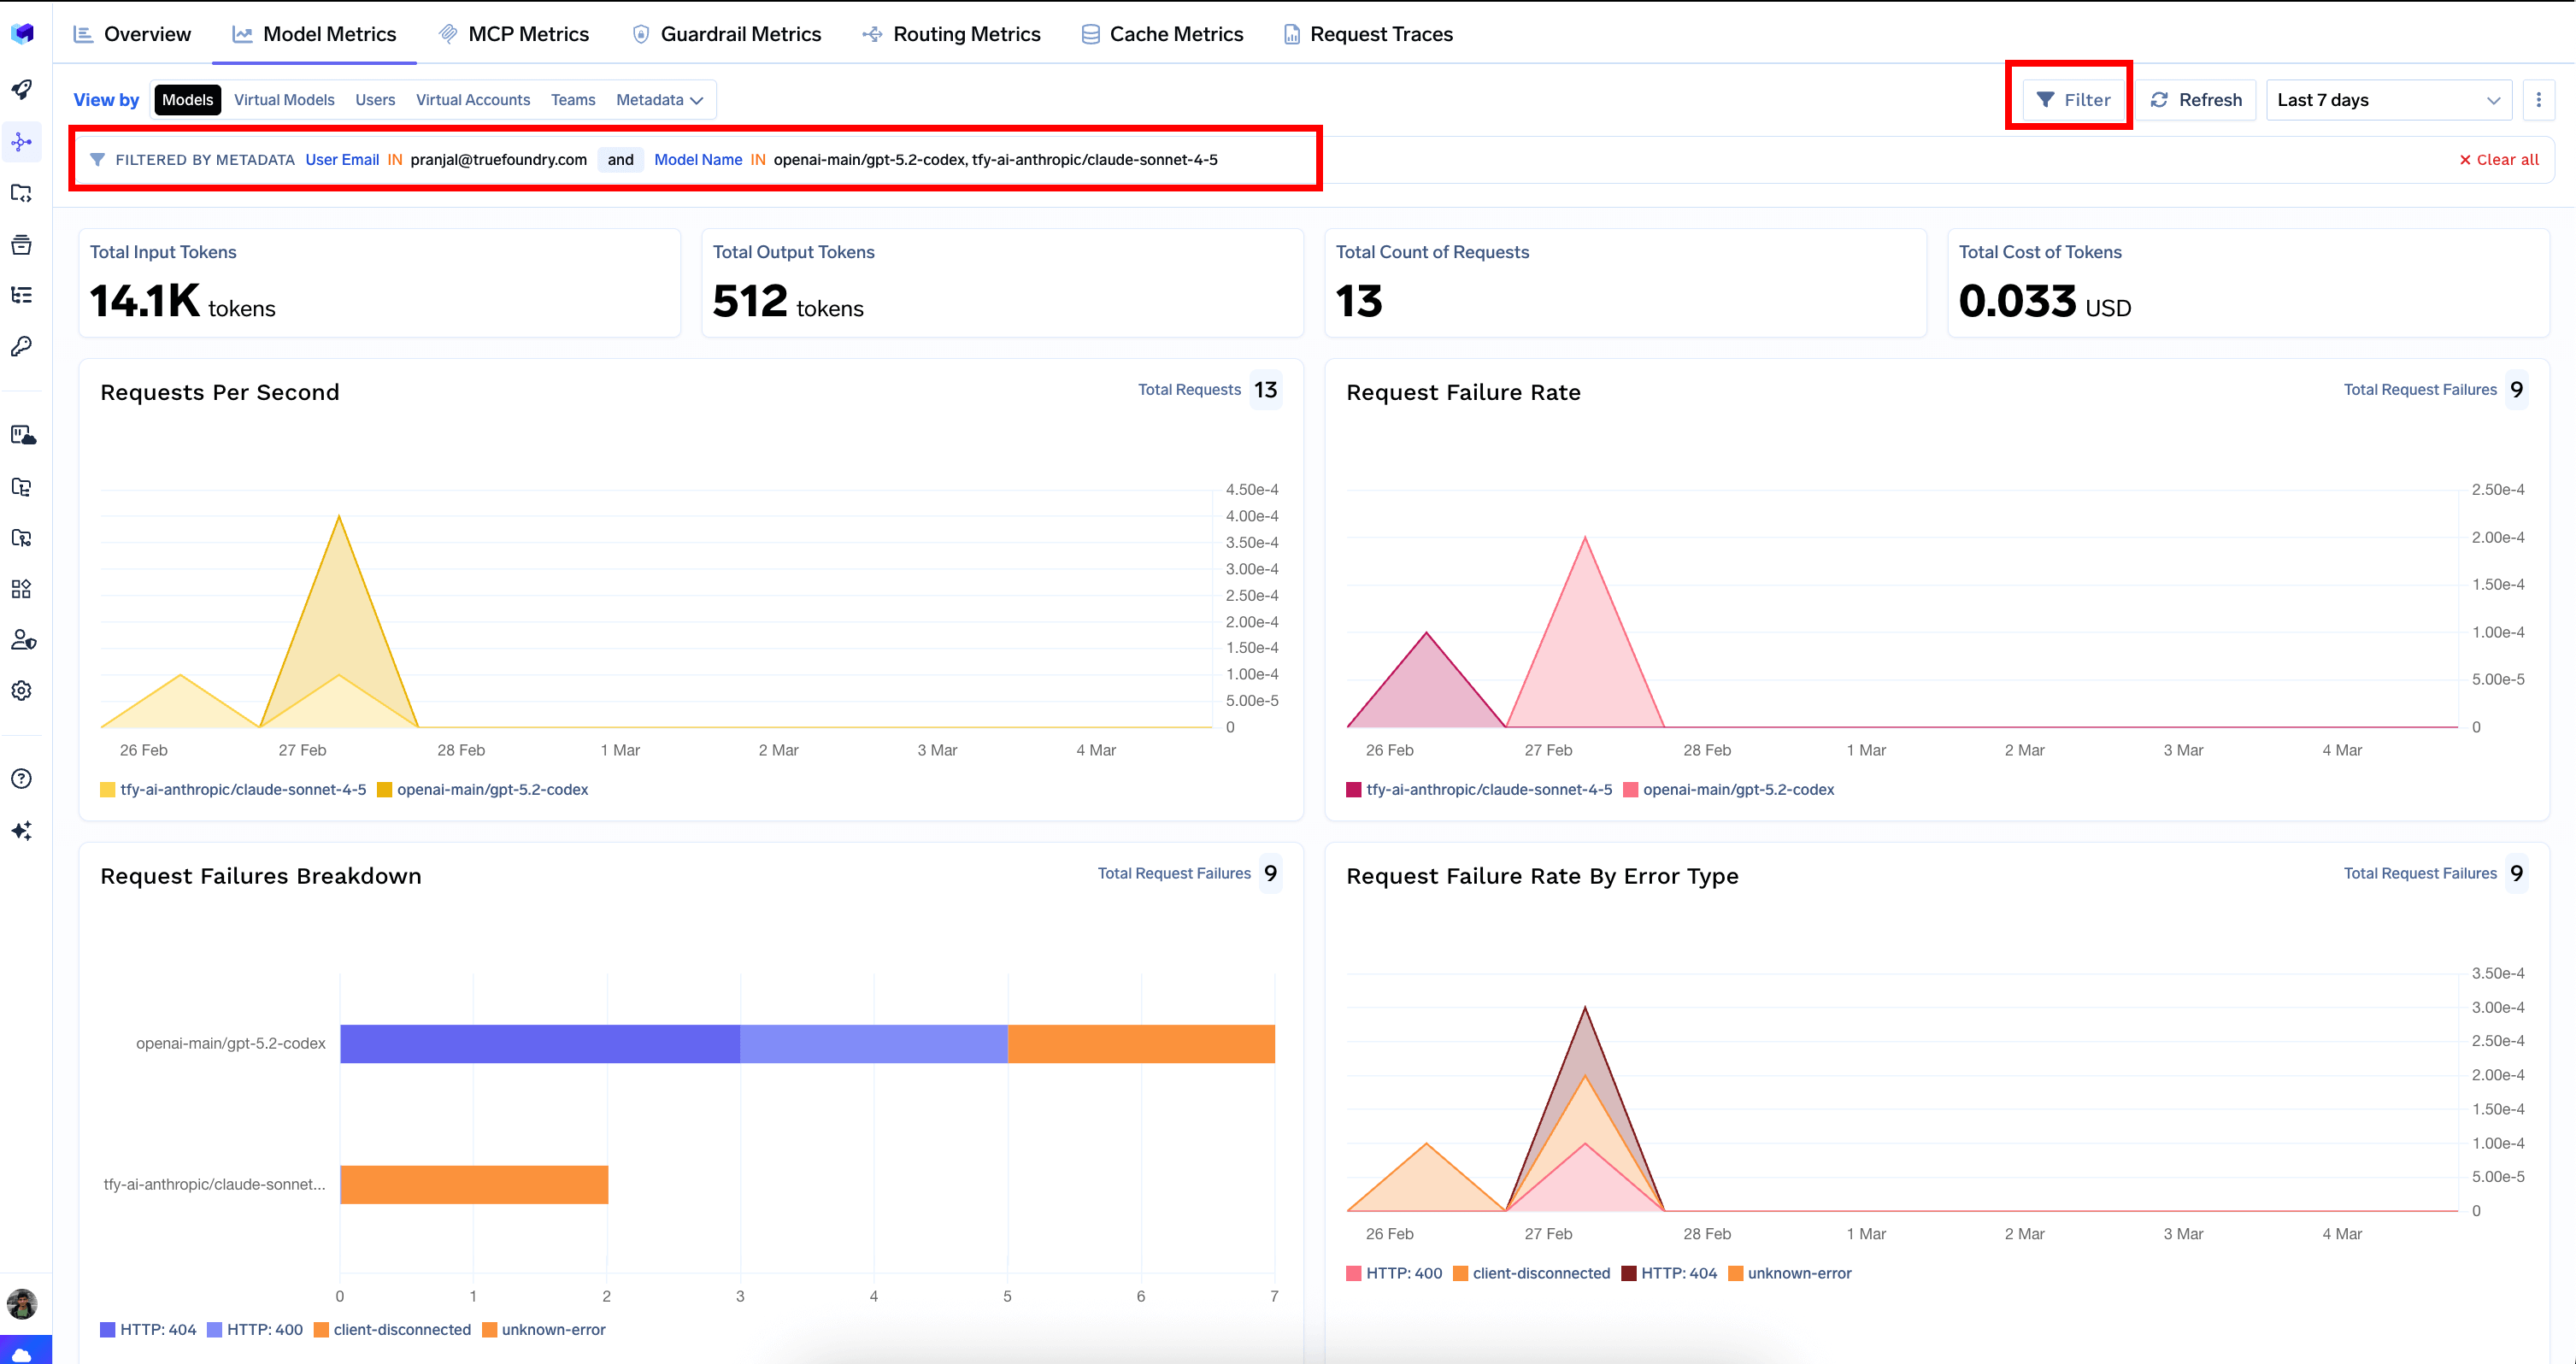
The dashboard includes filters that allow you to narrow down your analysis to specific models, users, virtual accounts, teams, MCP servers, tools, or custom metadata fields. Filters persist across tabs, making it easy to investigate a specific user or model across all dimensions.
* **Total Requests** — number of requests that went through the cache lookup.
* **Total Cost Saved** — dollar amount saved by serving responses from cache.
* **Cache Hit %** — percentage of requests served from cache.
* **Total Requests** — cache request volume over time.
* **Cache Hit Percentage** — hit vs. miss rate over time. A high hit rate means the cache is working well; a low or declining hit rate may indicate queries are too diverse for the current cache configuration.
* **Cost Savings** — dollar savings from cache hits over time.
* **Cache Errors** — errors encountered during cache operations. Ideally this should show "No data".
* **Latency Added Average** — average latency overhead introduced by cache lookups.
| View by | Groups metrics by | When to use |
| -------------------- | -------------------- | ----------------------------------------------- |
| **Cache** | Cache type (default) | Overall cache performance |
| **Virtual Accounts** | Virtual account | Compare cache effectiveness across applications |
***
## Filtering and Drill-Down
The dashboard includes filters that allow you to narrow down your analysis to specific models, users, virtual accounts, teams, MCP servers, tools, or custom metadata fields. Filters persist across tabs, making it easy to investigate a specific user or model across all dimensions.
 ## Exporting Data
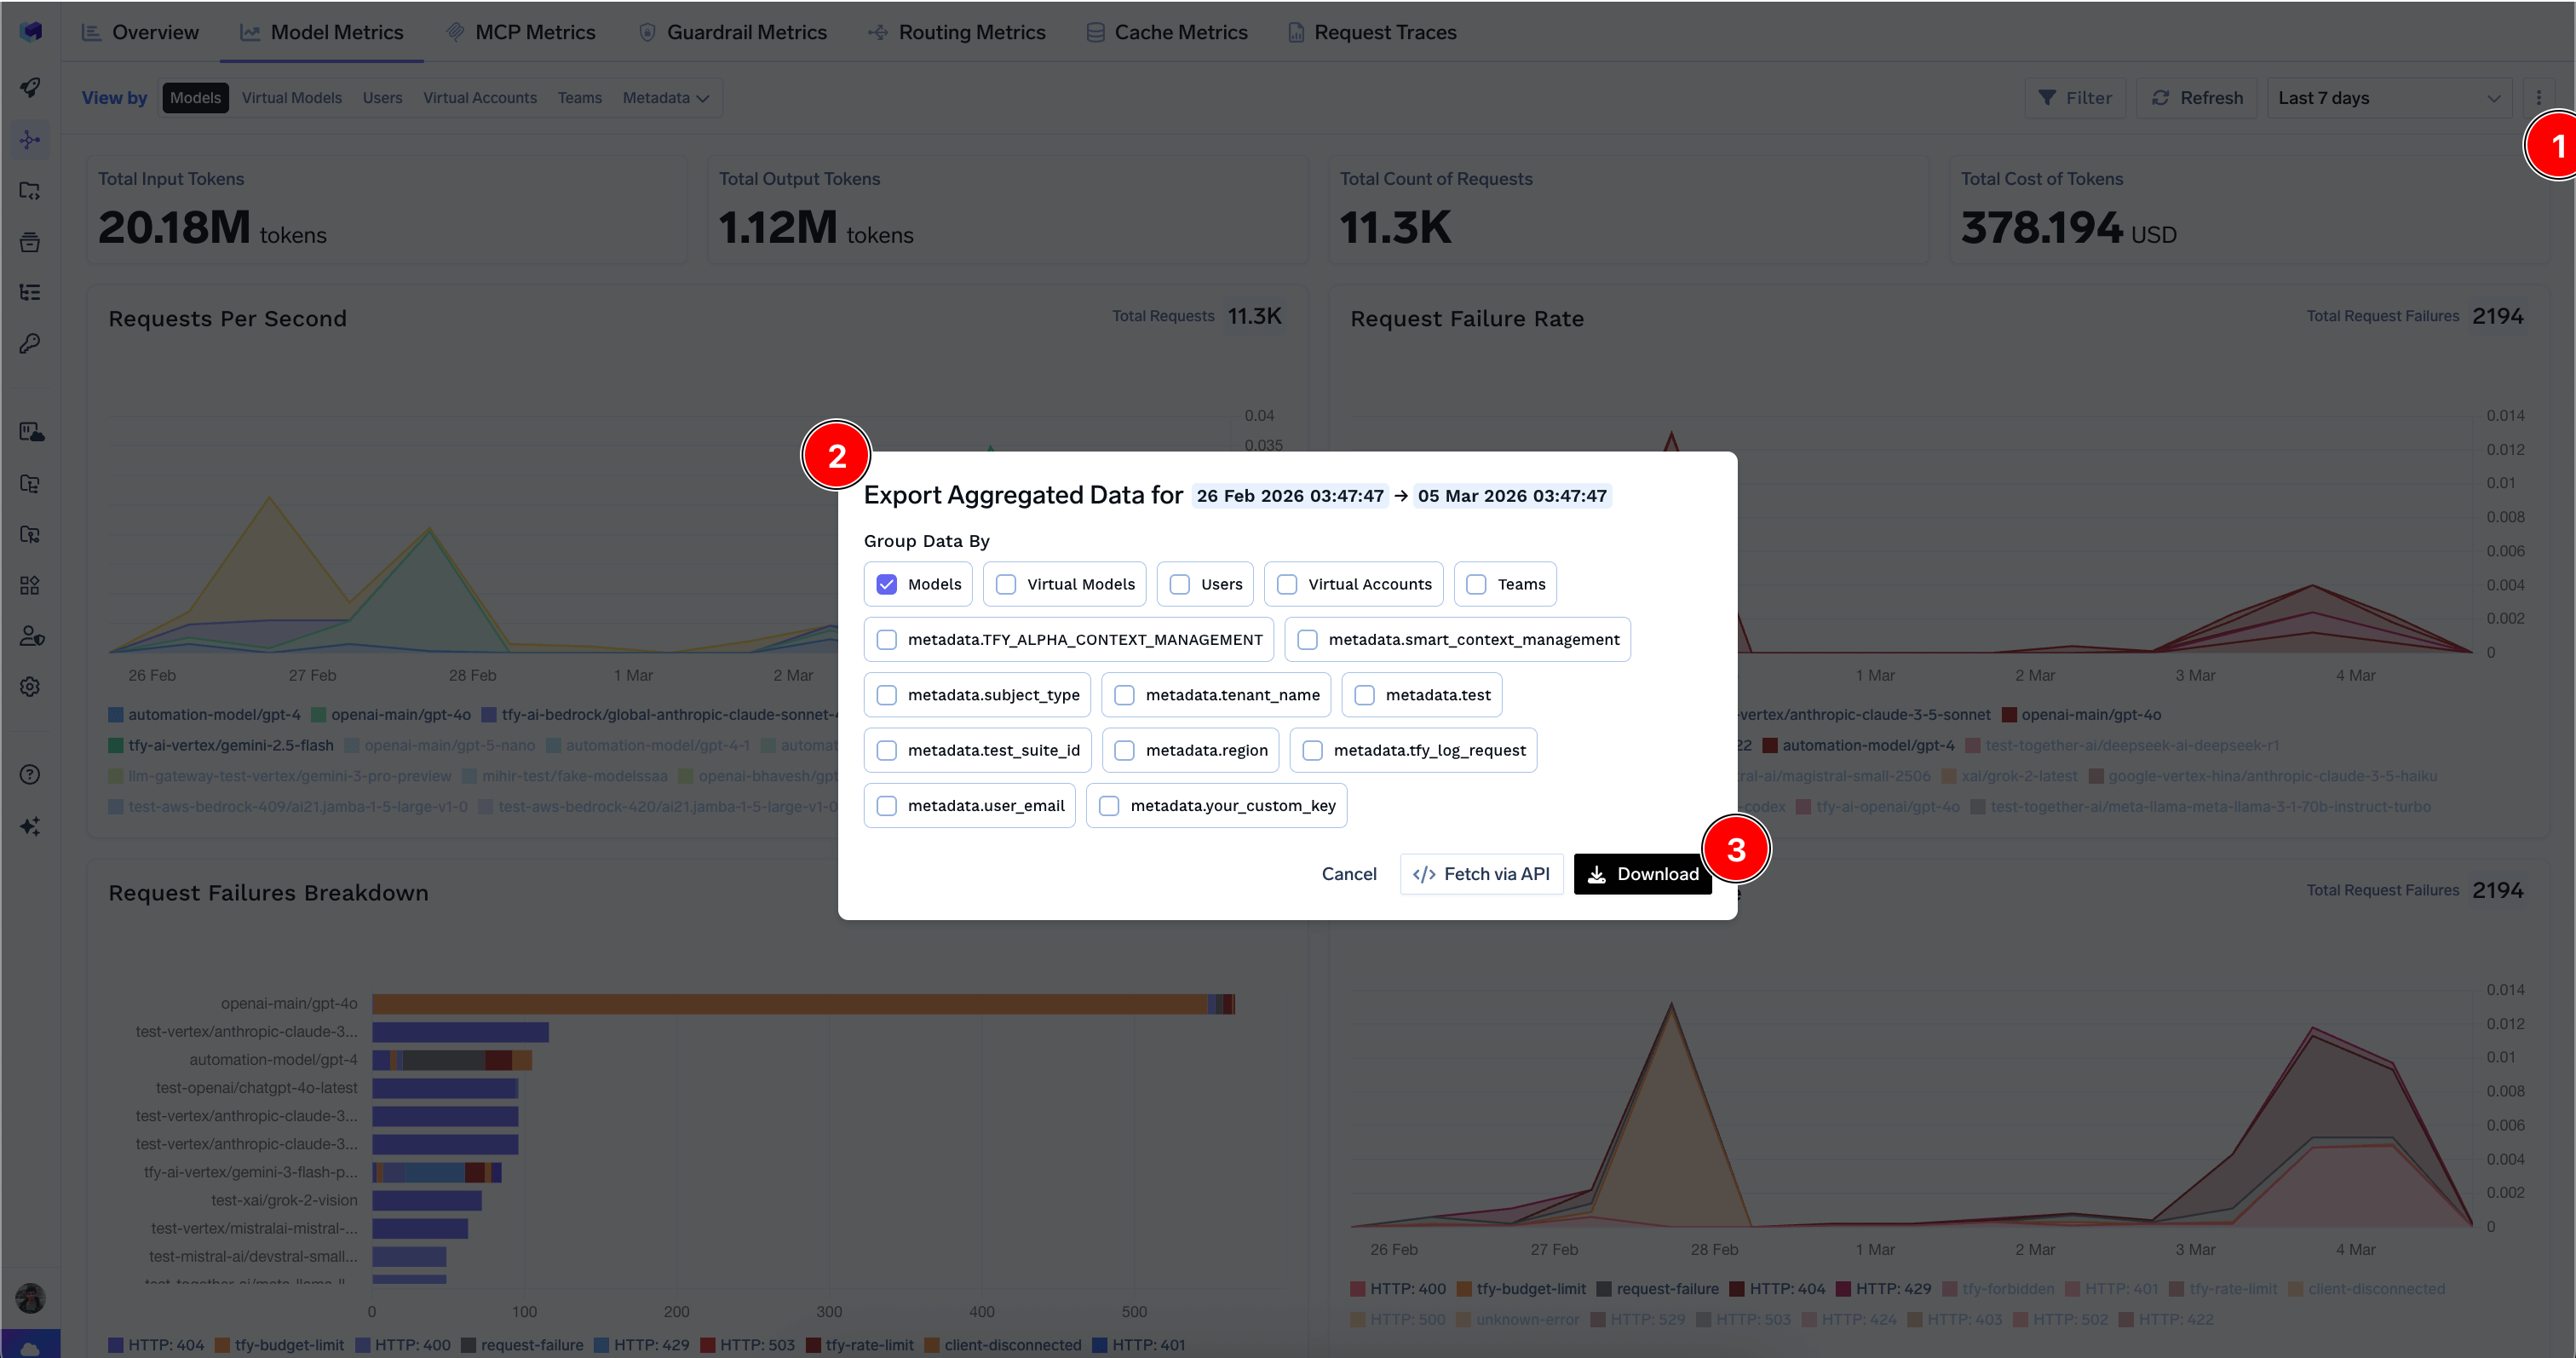
You can download aggregated metrics data in CSV format by clicking the export icon on supported tabs. Choose which dimensions to group the data by and optionally include custom metadata keys. You can also fetch the data via API for programmatic access; see the per-datasource guides for [Model](/docs/ai-gateway/fetch-model-metrics), [MCP](/docs/ai-gateway/fetch-mcp-metrics), [Guardrail](/docs/ai-gateway/fetch-guardrail-metrics), [Cache](/docs/ai-gateway/fetch-cache-metrics), [Routing](/docs/ai-gateway/fetch-routing-metrics), and [Agent](/docs/ai-gateway/fetch-agent-metrics) metrics.
## Exporting Data
You can download aggregated metrics data in CSV format by clicking the export icon on supported tabs. Choose which dimensions to group the data by and optionally include custom metadata keys. You can also fetch the data via API for programmatic access; see the per-datasource guides for [Model](/docs/ai-gateway/fetch-model-metrics), [MCP](/docs/ai-gateway/fetch-mcp-metrics), [Guardrail](/docs/ai-gateway/fetch-guardrail-metrics), [Cache](/docs/ai-gateway/fetch-cache-metrics), [Routing](/docs/ai-gateway/fetch-routing-metrics), and [Agent](/docs/ai-gateway/fetch-agent-metrics) metrics.