> ## Documentation Index
> Fetch the complete documentation index at: https://www.truefoundry.com/llms.txt
> Use this file to discover all available pages before exploring further.
# Observability
> Inspect every agent session on TrueFoundry with cost, tokens, turns, tool calls, and end-to-end traces in one place.
Observability is one of the layers TrueFoundry adds on top of the open-source [TrueForge](https://trueforge.dev/introduction) harness (see [What TrueFoundry Adds](/docs/agent-platform/agent-harness/what-truefoundry-adds) for the rest, including [governance](/docs/agent-platform/agent-harness/what-truefoundry-adds#governance)). Every agent session runs through the AI Gateway, so each turn, tool call, and model call is captured with cost, tokens, and latency — no extra instrumentation in your agent code.
This gives you a single place to answer three questions: who is using an agent, how much each run costs, and where a run went wrong.
## Agent Sessions
Open **Agents > Sessions** in the sidebar to see every session across all your agents. Each row is one conversation, with the agent it ran against, who created it, and the cost, turns, and duration for the whole session.
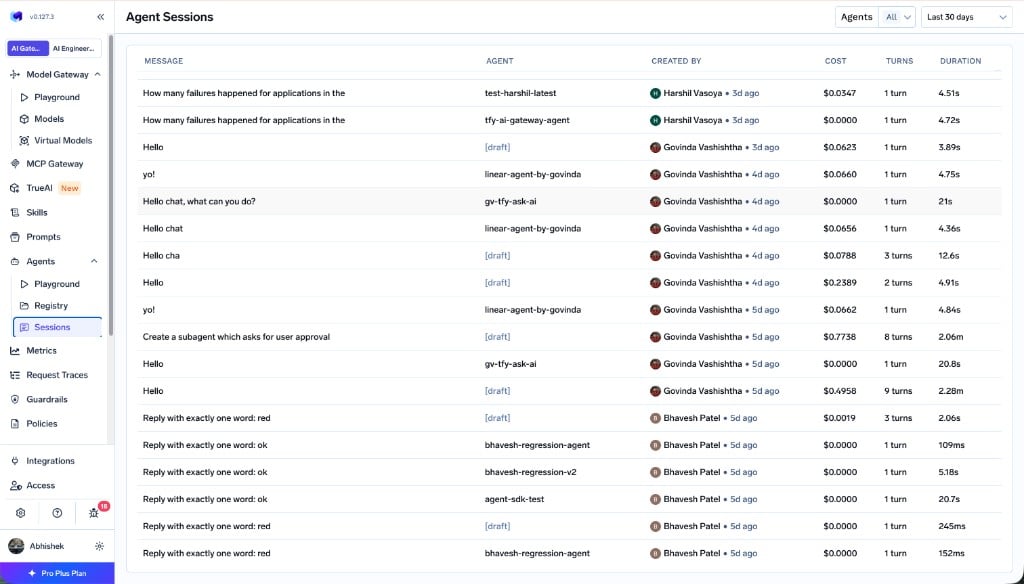 From this view you can:
* **Filter by agent** — narrow to a single agent to see how it is being used.
* **Filter by time range** — scope to the last 24 hours, 7 days, 30 days, or a custom window.
* **See who is using each agent** — every session shows the user or virtual account that created it.
* **Gauge cost and complexity** — turn count and dollar cost are visible per session without opening anything.
You can also open the sessions scoped to a single agent from the **Agent Sessions** tab on that agent's [detail page](/docs/agent-platform/agent-harness/getting-started#saved-agent).
## Session detail
Click any session to open its detail view. The header summarizes the whole session, and the transcript below shows every turn in order.
From this view you can:
* **Filter by agent** — narrow to a single agent to see how it is being used.
* **Filter by time range** — scope to the last 24 hours, 7 days, 30 days, or a custom window.
* **See who is using each agent** — every session shows the user or virtual account that created it.
* **Gauge cost and complexity** — turn count and dollar cost are visible per session without opening anything.
You can also open the sessions scoped to a single agent from the **Agent Sessions** tab on that agent's [detail page](/docs/agent-platform/agent-harness/getting-started#saved-agent).
## Session detail
Click any session to open its detail view. The header summarizes the whole session, and the transcript below shows every turn in order.
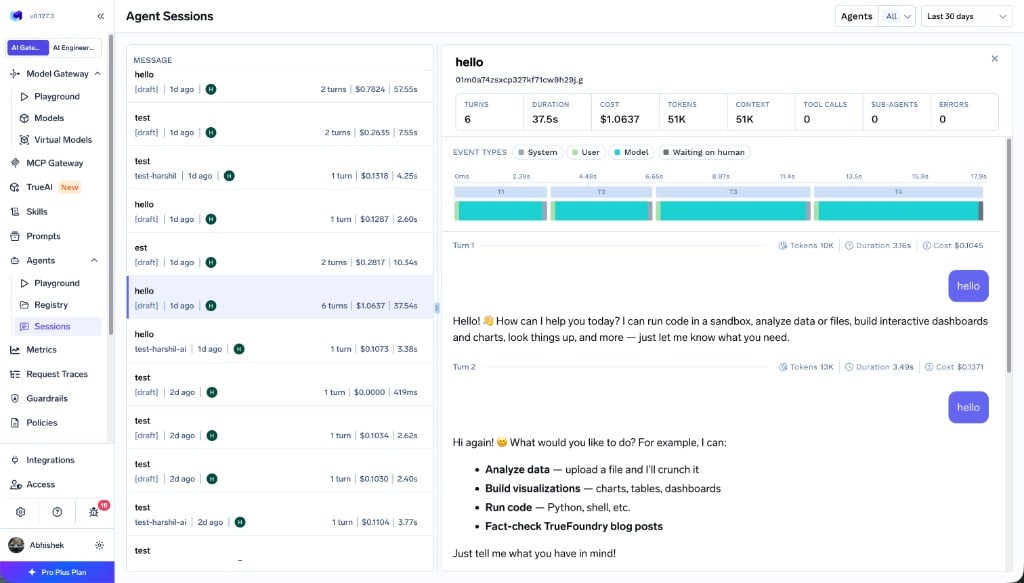 The summary metrics cover the whole session:
| Metric | What it tells you |
| -------------- | ----------------------------------------------------------------------------------------------------------------------- |
| **Turns** | Number of request/response turns in the session |
| **Duration** | Total wall-clock time across all turns |
| **Cost** | Total dollar cost, aggregated from every model and tool call |
| **Tokens** | Total tokens consumed across the session |
| **Context** | Size of the active context, useful for spotting when [compaction](https://trueforge.dev/key-features/overview) kicks in |
| **Tool calls** | How many MCP or sandbox tools the agent invoked |
| **Sub-agents** | How many [subagents](https://trueforge.dev/key-features/subagents) the run spawned |
| **Errors** | Count of failed steps in the session |
The **event-type timeline** breaks the session down by what the harness was doing at each moment — `System`, `User`, `Model`, and `Waiting on human` — so you can see at a glance where time went, including any pauses for [tool approval or user questions](https://trueforge.dev/key-features/overview).
Each turn in the transcript shows its own tokens, duration, and cost. From a turn you can open the corresponding span in [AI Monitoring](/docs/ai-gateway/analytics) to debug the underlying tool calls, reasoning steps, and latency.
## One pane of glass across the stack
Because Agent Harness runs in the same gateway plane as model and MCP traffic, agent sessions are not a separate silo — they inherit the full AI Gateway observability surface:
Model, MCP, and agent traffic in one analytics view, filterable by user, team, and agent.
Full request and response logs for every model and tool call, subject to your redaction policy.
Stream traces and metrics to your own observability backend.
Scrape gateway metrics and build dashboards and alerts.
For programmatic access to aggregated agent metrics, see [Fetch Agent Metrics](/docs/ai-gateway/fetch-agent-metrics).
The summary metrics cover the whole session:
| Metric | What it tells you |
| -------------- | ----------------------------------------------------------------------------------------------------------------------- |
| **Turns** | Number of request/response turns in the session |
| **Duration** | Total wall-clock time across all turns |
| **Cost** | Total dollar cost, aggregated from every model and tool call |
| **Tokens** | Total tokens consumed across the session |
| **Context** | Size of the active context, useful for spotting when [compaction](https://trueforge.dev/key-features/overview) kicks in |
| **Tool calls** | How many MCP or sandbox tools the agent invoked |
| **Sub-agents** | How many [subagents](https://trueforge.dev/key-features/subagents) the run spawned |
| **Errors** | Count of failed steps in the session |
The **event-type timeline** breaks the session down by what the harness was doing at each moment — `System`, `User`, `Model`, and `Waiting on human` — so you can see at a glance where time went, including any pauses for [tool approval or user questions](https://trueforge.dev/key-features/overview).
Each turn in the transcript shows its own tokens, duration, and cost. From a turn you can open the corresponding span in [AI Monitoring](/docs/ai-gateway/analytics) to debug the underlying tool calls, reasoning steps, and latency.
## One pane of glass across the stack
Because Agent Harness runs in the same gateway plane as model and MCP traffic, agent sessions are not a separate silo — they inherit the full AI Gateway observability surface:
Model, MCP, and agent traffic in one analytics view, filterable by user, team, and agent.
Full request and response logs for every model and tool call, subject to your redaction policy.
Stream traces and metrics to your own observability backend.
Scrape gateway metrics and build dashboards and alerts.
For programmatic access to aggregated agent metrics, see [Fetch Agent Metrics](/docs/ai-gateway/fetch-agent-metrics).