> ## Documentation Index
> Fetch the complete documentation index at: https://www.truefoundry.com/llms.txt
> Use this file to discover all available pages before exploring further.
# Generative UI
> Let the agent respond with rich, interactive components — charts, tables, cards, forms — instead of plain text.
Plain text and markdown work for short answers, but they fall flat the moment an agent needs to show a dashboard, compare metrics across models, render a sortable table, or guide a user through a form. Users end up squinting at walls of numbers when a single chart would have told the story in seconds.
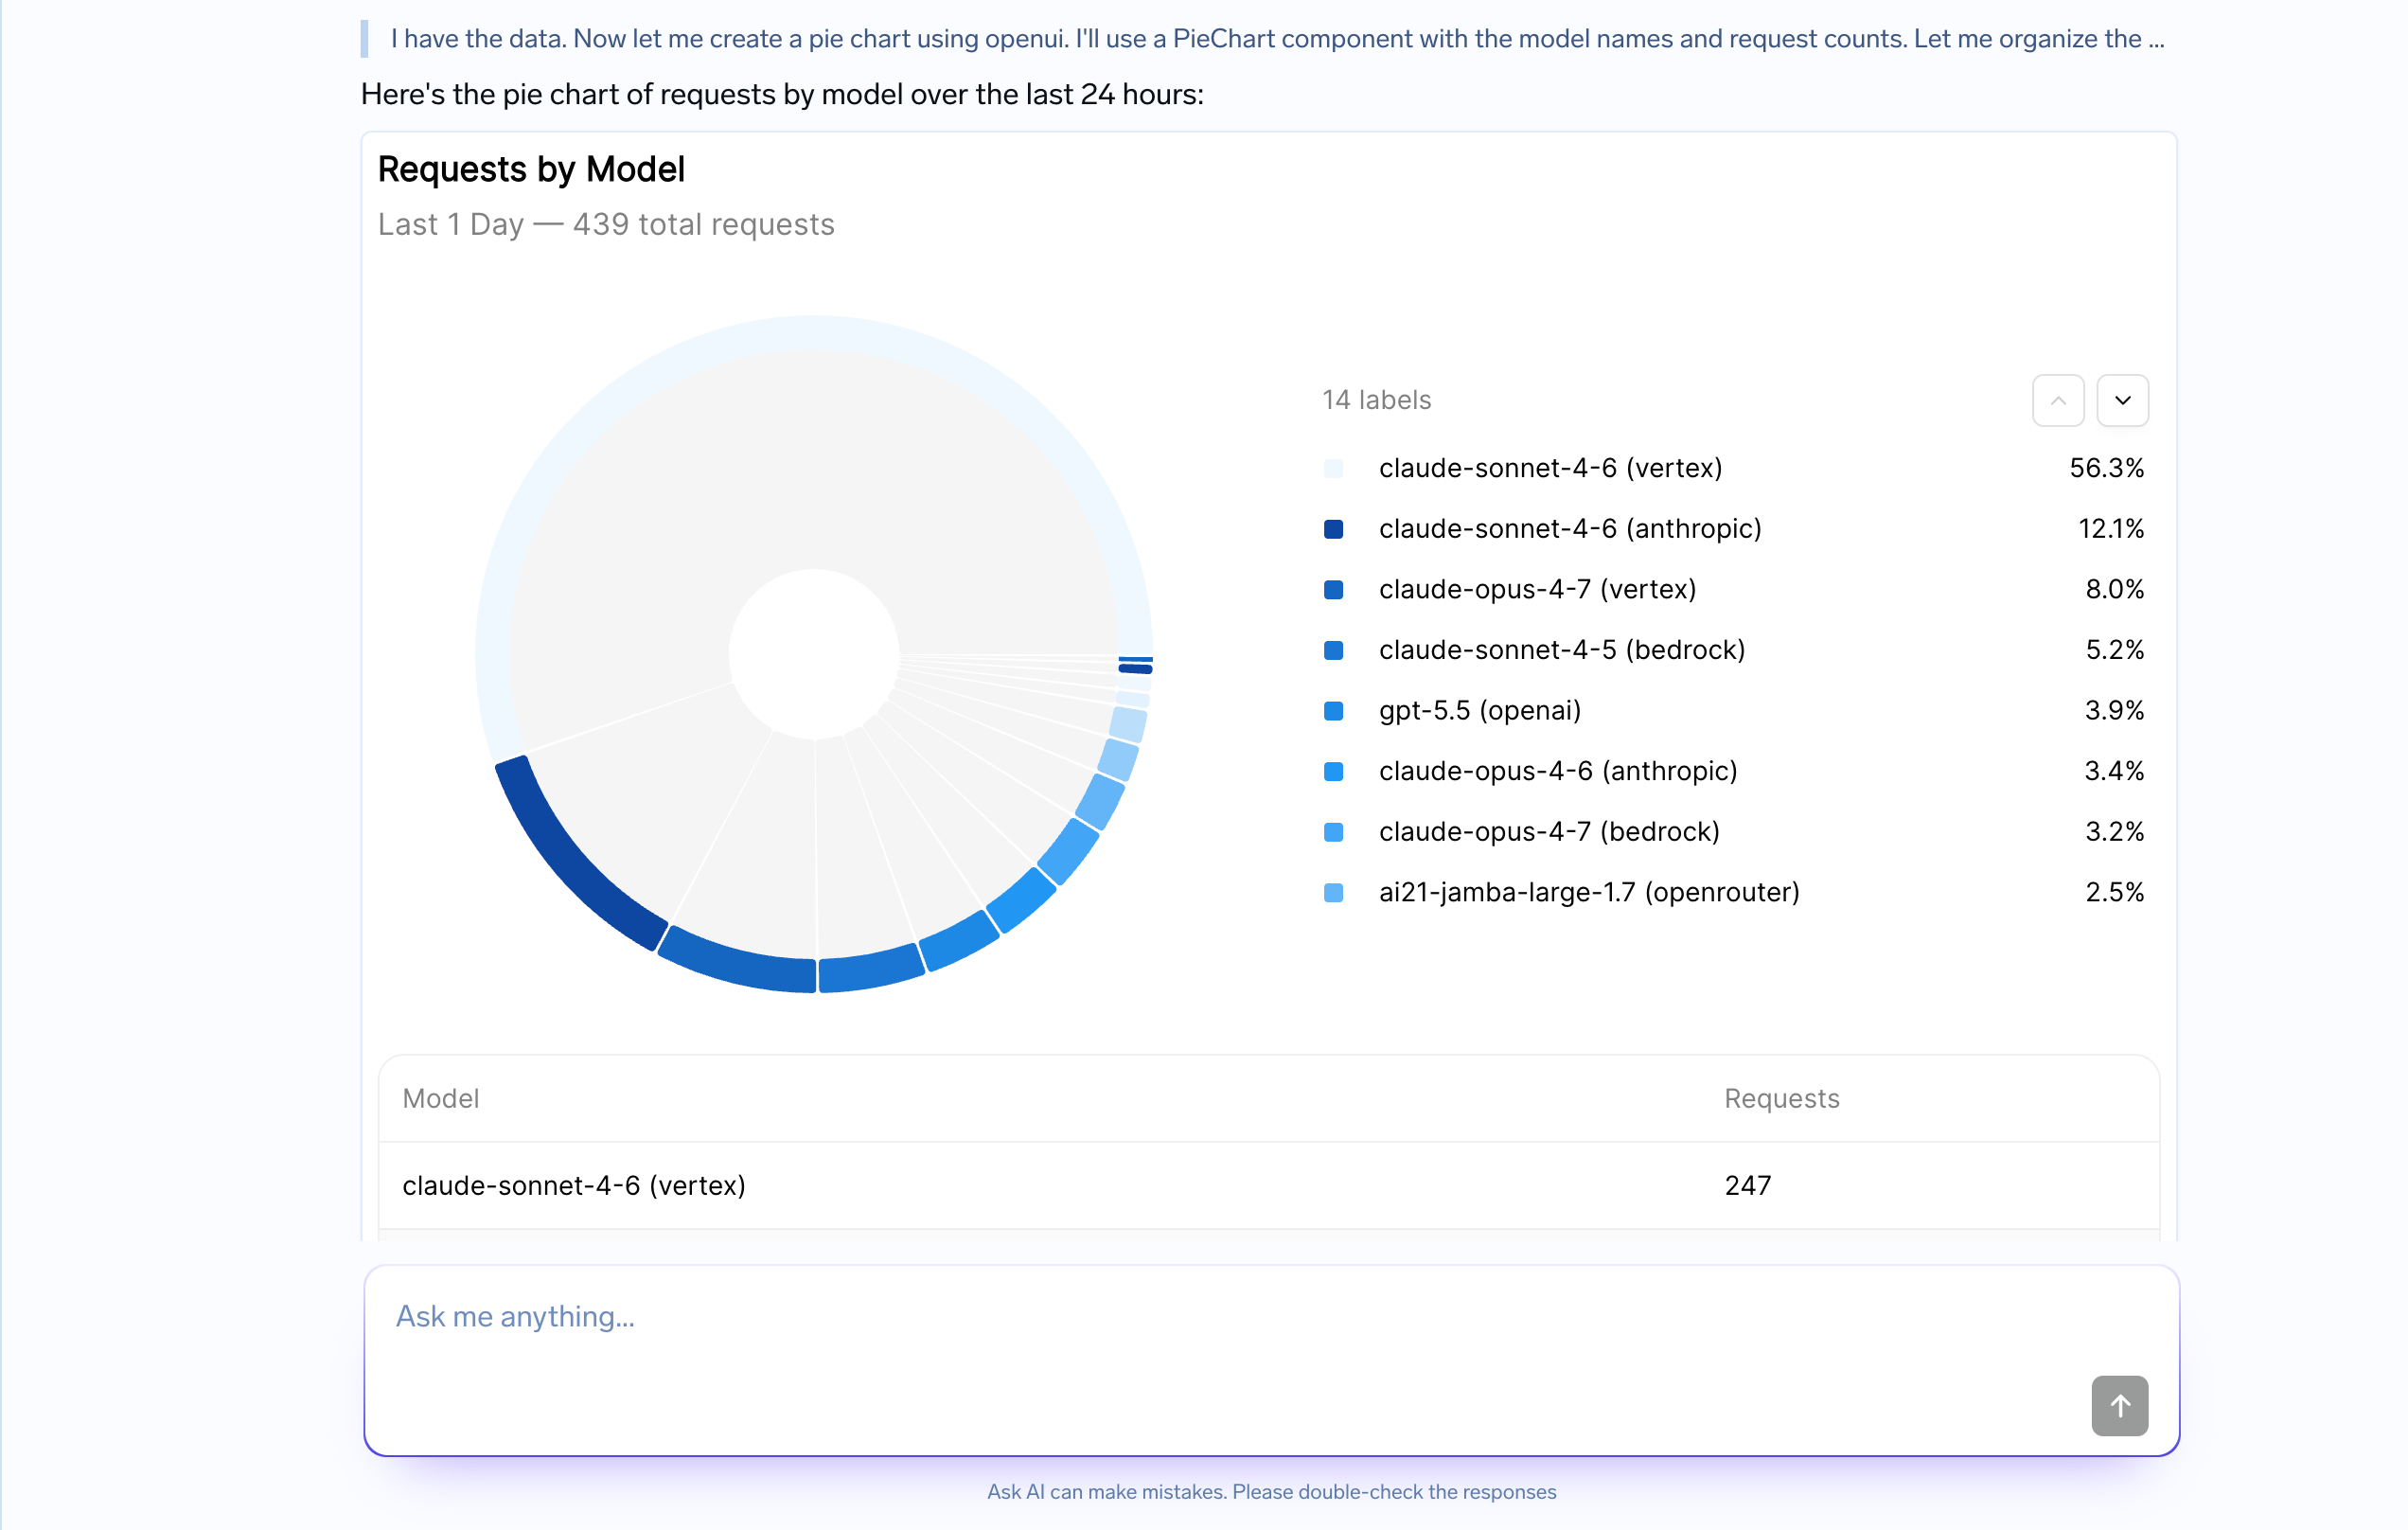
**Generative UI** lets your agent respond with real, interactive components — charts, tables, cards, forms, layouts — that your client renders as actual React UI. The agent decides *what* to show; the harness ships it in a standard format your renderer turns into pixels.
 ## Why it matters
A few patterns where Generative UI changes the experience dramatically:
* **Analytics & dashboards** — "Show me request volume by model" returns a chart with a sortable table, not a paragraph of numbers.
* **Comparisons** — "Compare cost across my last 3 deployments" returns a bar chart and a side-by-side table.
* **Reports & summaries** — Multi-section results with KPI cards, charts, and supporting data laid out cleanly.
* **Forms & guided actions** — The agent gathers structured input from the user — dropdowns, toggles, text fields — instead of asking question after question in chat.
* **Browsable results** — Search results, log entries, or resources rendered as cards or tables the user can scan.
The result: users get to the answer faster, and the agent stops repeating data the UI already shows.
## Enabling Generative UI
Set `config.generative_ui.enabled: true` in your agent configuration. The harness will automatically inject the OpenUI component library and rendering instructions into the agent's system prompt — you do not need to write any prompt logic yourself.
```yaml Saved agent (YAML manifest) theme={"dark"}
config:
generative_ui:
enabled: true
```
```python Inline agent (Python SDK) theme={"dark"}
stream = client.agents.responses.create(
request=AgentResponsesInlineAgent(
model={"name": "anthropic/claude-sonnet-4-6"},
instructions="You are a helpful analytics assistant.",
input=[AgentInputUserMessage(role="user", content="Show me request volume by model.")],
config={"generative_ui": {"enabled": True}},
)
)
```
```typescript Inline agent (TypeScript SDK) theme={"dark"}
const stream = client.agents.responses.create({
model: { name: "anthropic/claude-sonnet-4-6" },
instructions: "You are a helpful analytics assistant.",
input: [{ role: "user", content: "Show me request volume by model." }],
config: { generativeUi: { enabled: true } },
});
```
The TrueFoundry Agent Playground renders OpenUI out of the box. If you are building your own client, see [Client usage](#client-usage) for the renderer setup.
The next time the agent answers a question where a chart or table makes the response clearer, it will return one — automatically.
## How it works
Generative UI is **not** a separate tool call. The agent simply writes a small, streaming-friendly snippet inside its normal assistant message, and the client renders it on the fly as tokens arrive.
Under the hood, this uses [OpenUI](https://www.openui.com/) — an open standard for agent-generated UI:
* **OpenUI Lang** — A compact, streaming-first language for describing UI. \~67% more token-efficient than equivalent JSON, so charts and tables stream in fast.
* **Component library** — Built-in charts, tables, forms, cards, layouts, and more — ready to use or extend with your own design system.
* **Streaming renderer** — Parses and renders UI progressively in React as the response streams in.
* **Safe by default** — No arbitrary code execution. The agent can only emit components you've registered.
```mermaid theme={"dark"}
sequenceDiagram
participant User
participant Client
participant Harness as Agent Harness
participant Model
User->>Client: "Show me request volume by model"
Client->>Harness: responses.create
Harness->>Model: LLM call (OpenUI component library injected into system prompt)
Model->>Harness: Streams assistant message with openui block
Harness-->>Client: agent.message events (content includes openui code)
Client->>Client: Detect openui fence, render with OpenUI Renderer
Client->>User: Interactive chart + table
```
The stream uses normal `agent.message` events. The only difference is that some message content contains an ` ```openui ` fenced block that the client extracts and renders as React components.
## When to use Generative UI
Turn it on whenever your agent's answers benefit from visual structure:
| Use case | What the agent renders |
| ------------------- | ------------------------------------------------------------------- |
| **Dashboards** | KPI cards, charts, and tables for metrics, trends, and comparisons |
| **Tables** | Sortable structured data — logs, resources, results to scan |
| **Charts** | Bar, line, and pie charts that show patterns faster than prose |
| **Cards & layouts** | Summary panels, multi-section reports, side-by-side comparisons |
| **Forms** | Inputs, dropdowns, and selections that guide the user's next action |
The agent can still include brief text alongside the UI to explain the result — it just stops repeating values that the components already show.
Skip Generative UI for simple answers where markdown is enough — a short explanation, a bullet list, or a code block. The overhead of structured components is not worth it for small tasks. Generative UI is also not a replacement for server-side actions: if a UI button needs to trigger a follow-up, the client sends that back as a normal user message in the next turn.
## Available components
The OpenUI built-in library covers the patterns most agents need out of the box:
| Category | Components |
| ---------- | --------------------------------------------- |
| **Layout** | `Stack`, `Card`, `Tabs`, `Accordion` |
| **Text** | `TextContent`, `Markdown` |
| **Data** | `Table`, `Col` |
| **Charts** | `BarChart`, `LineChart`, `PieChart`, `Series` |
| **Input** | `TextInput`, `Select`, `Button`, `Form` |
| **Media** | `Image`, `Link` |
Need something custom? Register your own components using `defineComponent` and `createLibrary` from `@openuidev/react-lang`. The agent will only ever emit components that are registered — it cannot generate arbitrary HTML or code.
## Example
} noAnchor>
Show me a dashboard comparing request volume and error rate across my three production models.
} noAnchor>
I will summarize the model traffic visually.
```openui theme={"dark"}
root = Stack([title, cards, chart, table])
title = TextContent("Production Model Health", "large-heavy")
cards = Stack([totalCard, errorCard], "row", "m", "stretch")
totalCard = Card([TextContent("Total requests", "small"), TextContent("2,630", "large-heavy")])
errorCard = Card([TextContent("Average error rate", "small"), TextContent("1.8%", "large-heavy")])
chart = BarChart(models, [requests], "grouped", "Model", "Requests")
table = Table([Col("Model", models), Col("Requests", requestValues, "number"), Col("Error rate", errorRates)])
models = ["gpt-4.1", "claude-sonnet", "llama-3.1"]
requestValues = [1240, 980, 410]
errorRates = ["1.2%", "2.1%", "2.5%"]
requests = Series("Requests", requestValues)
```
The highest traffic is on `gpt-4.1`, while `llama-3.1` has the highest error rate despite lower volume.
The client's OpenUI renderer turns the snippet above into a full dashboard — summary cards on top, a grouped bar chart in the middle, and a sortable data table at the bottom — all real React components, not markdown.
## Client usage
For the streaming event format and a full working client example, see [Complete example](/docs/agent-platform/agent-harness/sdk/complete-example).
## Why it matters
A few patterns where Generative UI changes the experience dramatically:
* **Analytics & dashboards** — "Show me request volume by model" returns a chart with a sortable table, not a paragraph of numbers.
* **Comparisons** — "Compare cost across my last 3 deployments" returns a bar chart and a side-by-side table.
* **Reports & summaries** — Multi-section results with KPI cards, charts, and supporting data laid out cleanly.
* **Forms & guided actions** — The agent gathers structured input from the user — dropdowns, toggles, text fields — instead of asking question after question in chat.
* **Browsable results** — Search results, log entries, or resources rendered as cards or tables the user can scan.
The result: users get to the answer faster, and the agent stops repeating data the UI already shows.
## Enabling Generative UI
Set `config.generative_ui.enabled: true` in your agent configuration. The harness will automatically inject the OpenUI component library and rendering instructions into the agent's system prompt — you do not need to write any prompt logic yourself.
```yaml Saved agent (YAML manifest) theme={"dark"}
config:
generative_ui:
enabled: true
```
```python Inline agent (Python SDK) theme={"dark"}
stream = client.agents.responses.create(
request=AgentResponsesInlineAgent(
model={"name": "anthropic/claude-sonnet-4-6"},
instructions="You are a helpful analytics assistant.",
input=[AgentInputUserMessage(role="user", content="Show me request volume by model.")],
config={"generative_ui": {"enabled": True}},
)
)
```
```typescript Inline agent (TypeScript SDK) theme={"dark"}
const stream = client.agents.responses.create({
model: { name: "anthropic/claude-sonnet-4-6" },
instructions: "You are a helpful analytics assistant.",
input: [{ role: "user", content: "Show me request volume by model." }],
config: { generativeUi: { enabled: true } },
});
```
The TrueFoundry Agent Playground renders OpenUI out of the box. If you are building your own client, see [Client usage](#client-usage) for the renderer setup.
The next time the agent answers a question where a chart or table makes the response clearer, it will return one — automatically.
## How it works
Generative UI is **not** a separate tool call. The agent simply writes a small, streaming-friendly snippet inside its normal assistant message, and the client renders it on the fly as tokens arrive.
Under the hood, this uses [OpenUI](https://www.openui.com/) — an open standard for agent-generated UI:
* **OpenUI Lang** — A compact, streaming-first language for describing UI. \~67% more token-efficient than equivalent JSON, so charts and tables stream in fast.
* **Component library** — Built-in charts, tables, forms, cards, layouts, and more — ready to use or extend with your own design system.
* **Streaming renderer** — Parses and renders UI progressively in React as the response streams in.
* **Safe by default** — No arbitrary code execution. The agent can only emit components you've registered.
```mermaid theme={"dark"}
sequenceDiagram
participant User
participant Client
participant Harness as Agent Harness
participant Model
User->>Client: "Show me request volume by model"
Client->>Harness: responses.create
Harness->>Model: LLM call (OpenUI component library injected into system prompt)
Model->>Harness: Streams assistant message with openui block
Harness-->>Client: agent.message events (content includes openui code)
Client->>Client: Detect openui fence, render with OpenUI Renderer
Client->>User: Interactive chart + table
```
The stream uses normal `agent.message` events. The only difference is that some message content contains an ` ```openui ` fenced block that the client extracts and renders as React components.
## When to use Generative UI
Turn it on whenever your agent's answers benefit from visual structure:
| Use case | What the agent renders |
| ------------------- | ------------------------------------------------------------------- |
| **Dashboards** | KPI cards, charts, and tables for metrics, trends, and comparisons |
| **Tables** | Sortable structured data — logs, resources, results to scan |
| **Charts** | Bar, line, and pie charts that show patterns faster than prose |
| **Cards & layouts** | Summary panels, multi-section reports, side-by-side comparisons |
| **Forms** | Inputs, dropdowns, and selections that guide the user's next action |
The agent can still include brief text alongside the UI to explain the result — it just stops repeating values that the components already show.
Skip Generative UI for simple answers where markdown is enough — a short explanation, a bullet list, or a code block. The overhead of structured components is not worth it for small tasks. Generative UI is also not a replacement for server-side actions: if a UI button needs to trigger a follow-up, the client sends that back as a normal user message in the next turn.
## Available components
The OpenUI built-in library covers the patterns most agents need out of the box:
| Category | Components |
| ---------- | --------------------------------------------- |
| **Layout** | `Stack`, `Card`, `Tabs`, `Accordion` |
| **Text** | `TextContent`, `Markdown` |
| **Data** | `Table`, `Col` |
| **Charts** | `BarChart`, `LineChart`, `PieChart`, `Series` |
| **Input** | `TextInput`, `Select`, `Button`, `Form` |
| **Media** | `Image`, `Link` |
Need something custom? Register your own components using `defineComponent` and `createLibrary` from `@openuidev/react-lang`. The agent will only ever emit components that are registered — it cannot generate arbitrary HTML or code.
## Example
} noAnchor>
Show me a dashboard comparing request volume and error rate across my three production models.
} noAnchor>
I will summarize the model traffic visually.
```openui theme={"dark"}
root = Stack([title, cards, chart, table])
title = TextContent("Production Model Health", "large-heavy")
cards = Stack([totalCard, errorCard], "row", "m", "stretch")
totalCard = Card([TextContent("Total requests", "small"), TextContent("2,630", "large-heavy")])
errorCard = Card([TextContent("Average error rate", "small"), TextContent("1.8%", "large-heavy")])
chart = BarChart(models, [requests], "grouped", "Model", "Requests")
table = Table([Col("Model", models), Col("Requests", requestValues, "number"), Col("Error rate", errorRates)])
models = ["gpt-4.1", "claude-sonnet", "llama-3.1"]
requestValues = [1240, 980, 410]
errorRates = ["1.2%", "2.1%", "2.5%"]
requests = Series("Requests", requestValues)
```
The highest traffic is on `gpt-4.1`, while `llama-3.1` has the highest error rate despite lower volume.
The client's OpenUI renderer turns the snippet above into a full dashboard — summary cards on top, a grouped bar chart in the middle, and a sortable data table at the bottom — all real React components, not markdown.
## Client usage
For the streaming event format and a full working client example, see [Complete example](/docs/agent-platform/agent-harness/sdk/complete-example).